274: Asset Data Assurance
This course is for Platform Administrators who want to ensure the data flowing through Kelvin is trustworthy and that no bad values reach their physical assets.
By the end, you will understand what Data Quality and Guardrails are, know how to configure both, and be able to monitor data health across your assets.
Where this course fits
- 270: Exploring the Kelvin UI for Platform Administrators — the Administration area overview
- 271: Setting Up Platform Infrastructure — clusters, nodes, and users
- 272: Setting Up Assets and Data Streams Quickly — creating assets in bulk
- 273: Getting Data From Your Assets — connecting assets via Connections
- This course — making sure that data is good, and that bad values never reach your assets
Two tools, two directions
Kelvin gives you two separate tools to protect your data. They work in different directions.
Data Quality watches data coming in from your assets. It monitors the live stream and flags problems — things like missing messages, out-of-range values, or stuck sensors. It does not block anything. It tells you what is happening.
Guardrails protect data going out to your assets. Before any value is written back to a physical asset — whether from the UI, an API call, or a SmartApp recommendation — Guardrails checks it. If the value breaks a rule, the write is automatically rejected. Nothing reaches the asset.
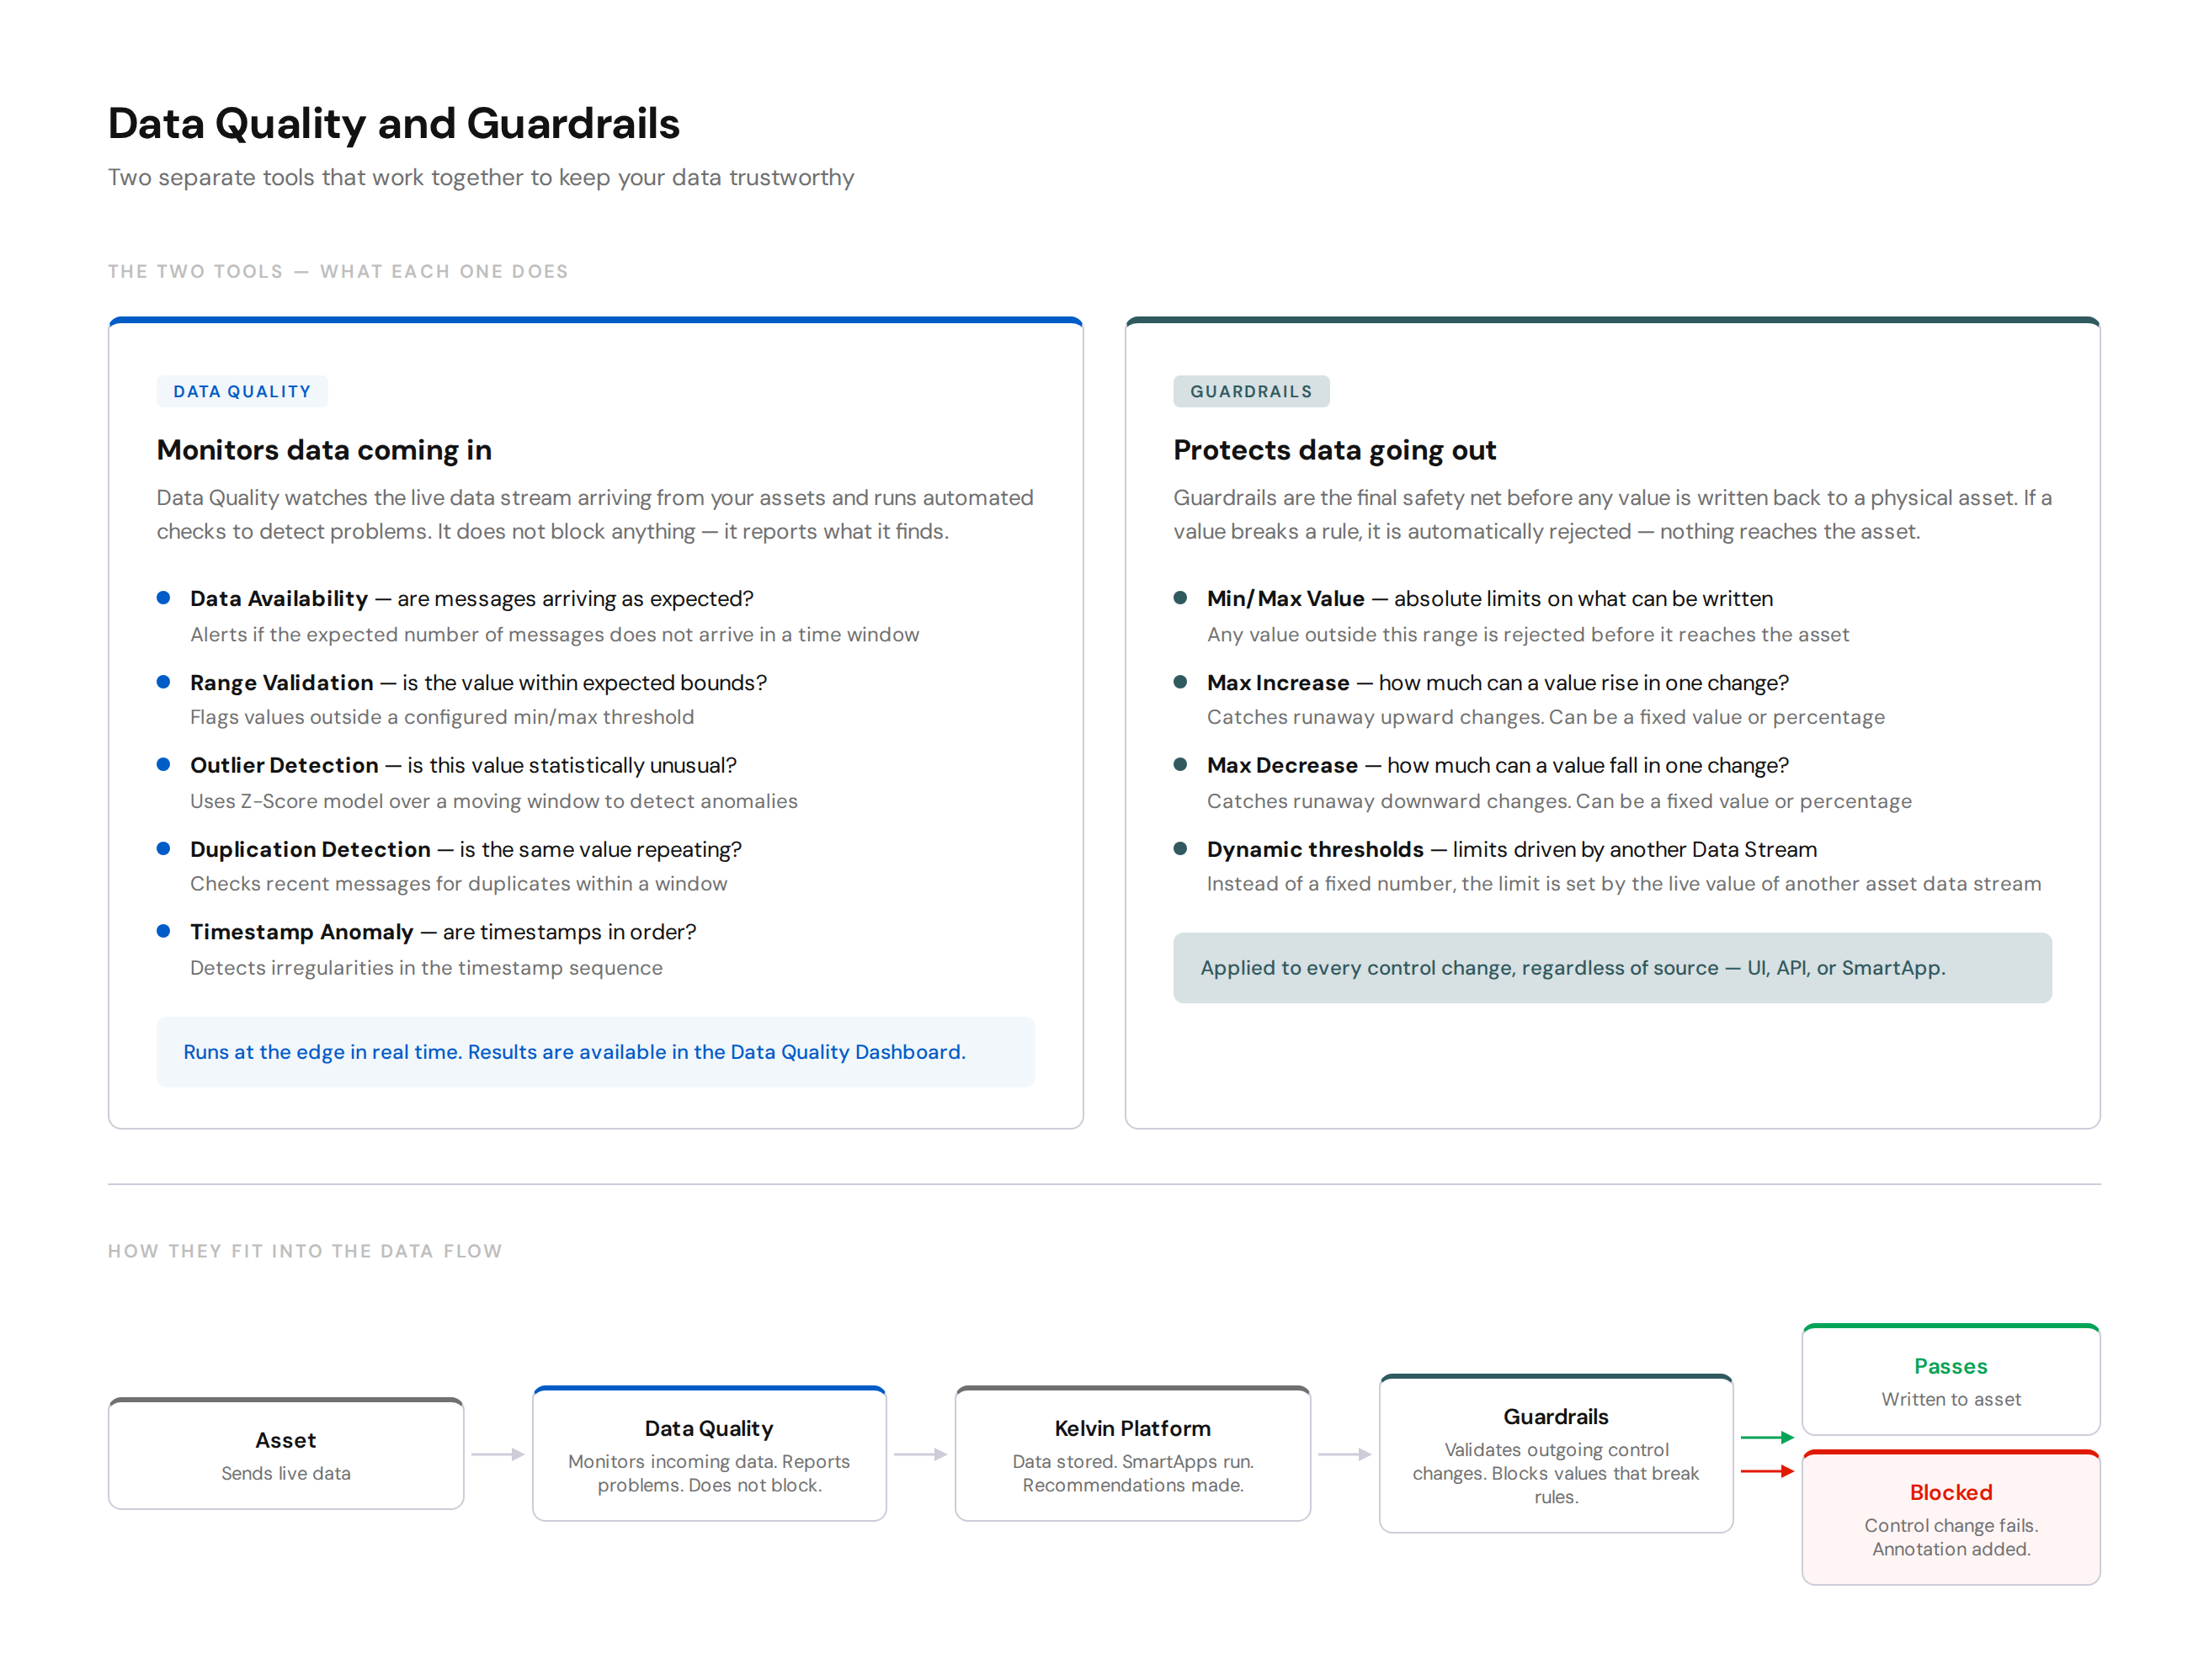
Think of them this way: Data Quality is your monitoring system. Guardrails is your safety interlock.
Part 1: Data Quality
What is Data Quality?
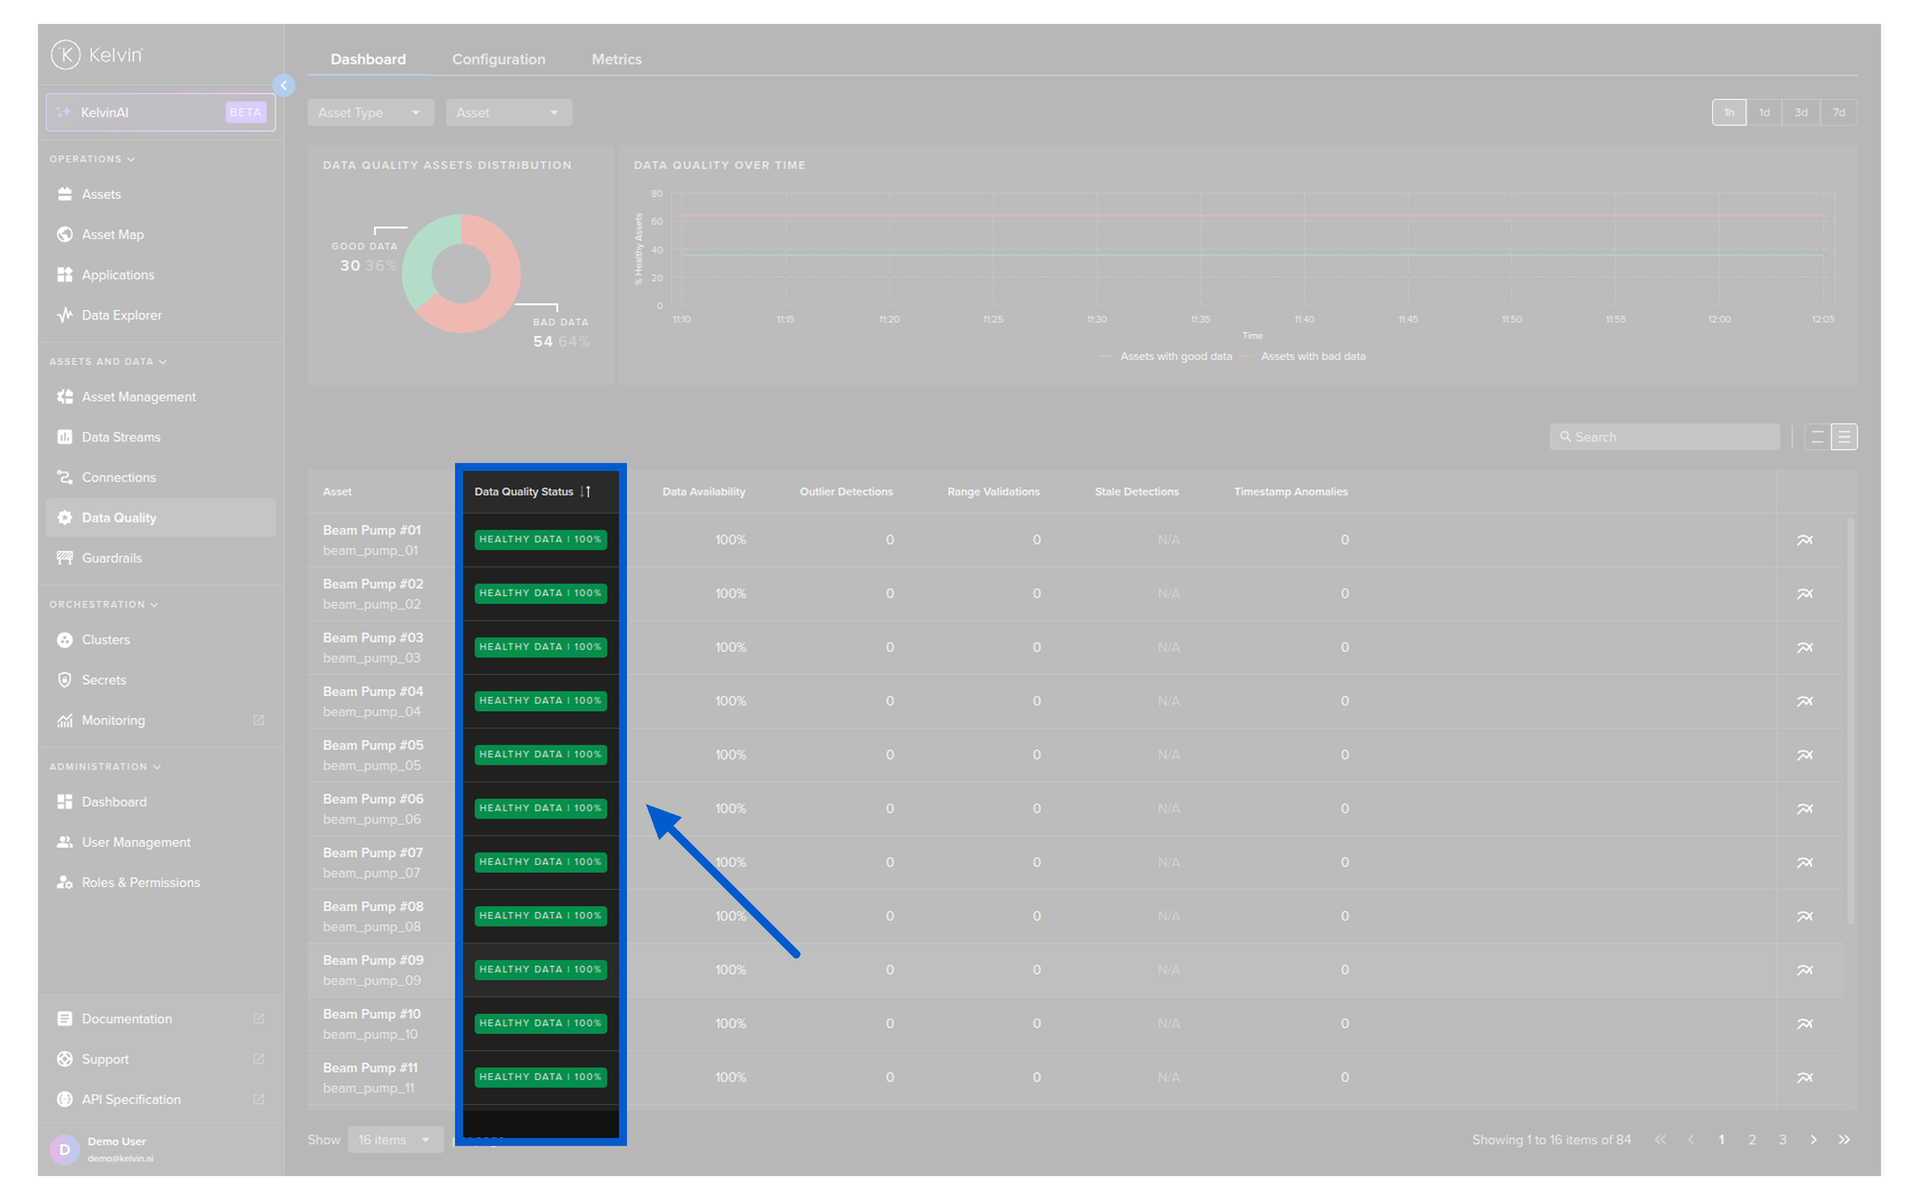
Data Quality is a set of automated validation checks that run at the edge in real time on your Asset / Data Stream pairs. You choose which checks to enable and configure the parameters. The results are reported on the Data Quality Dashboard.
There are five built-in metrics. You can enable any combination of them per data stream.
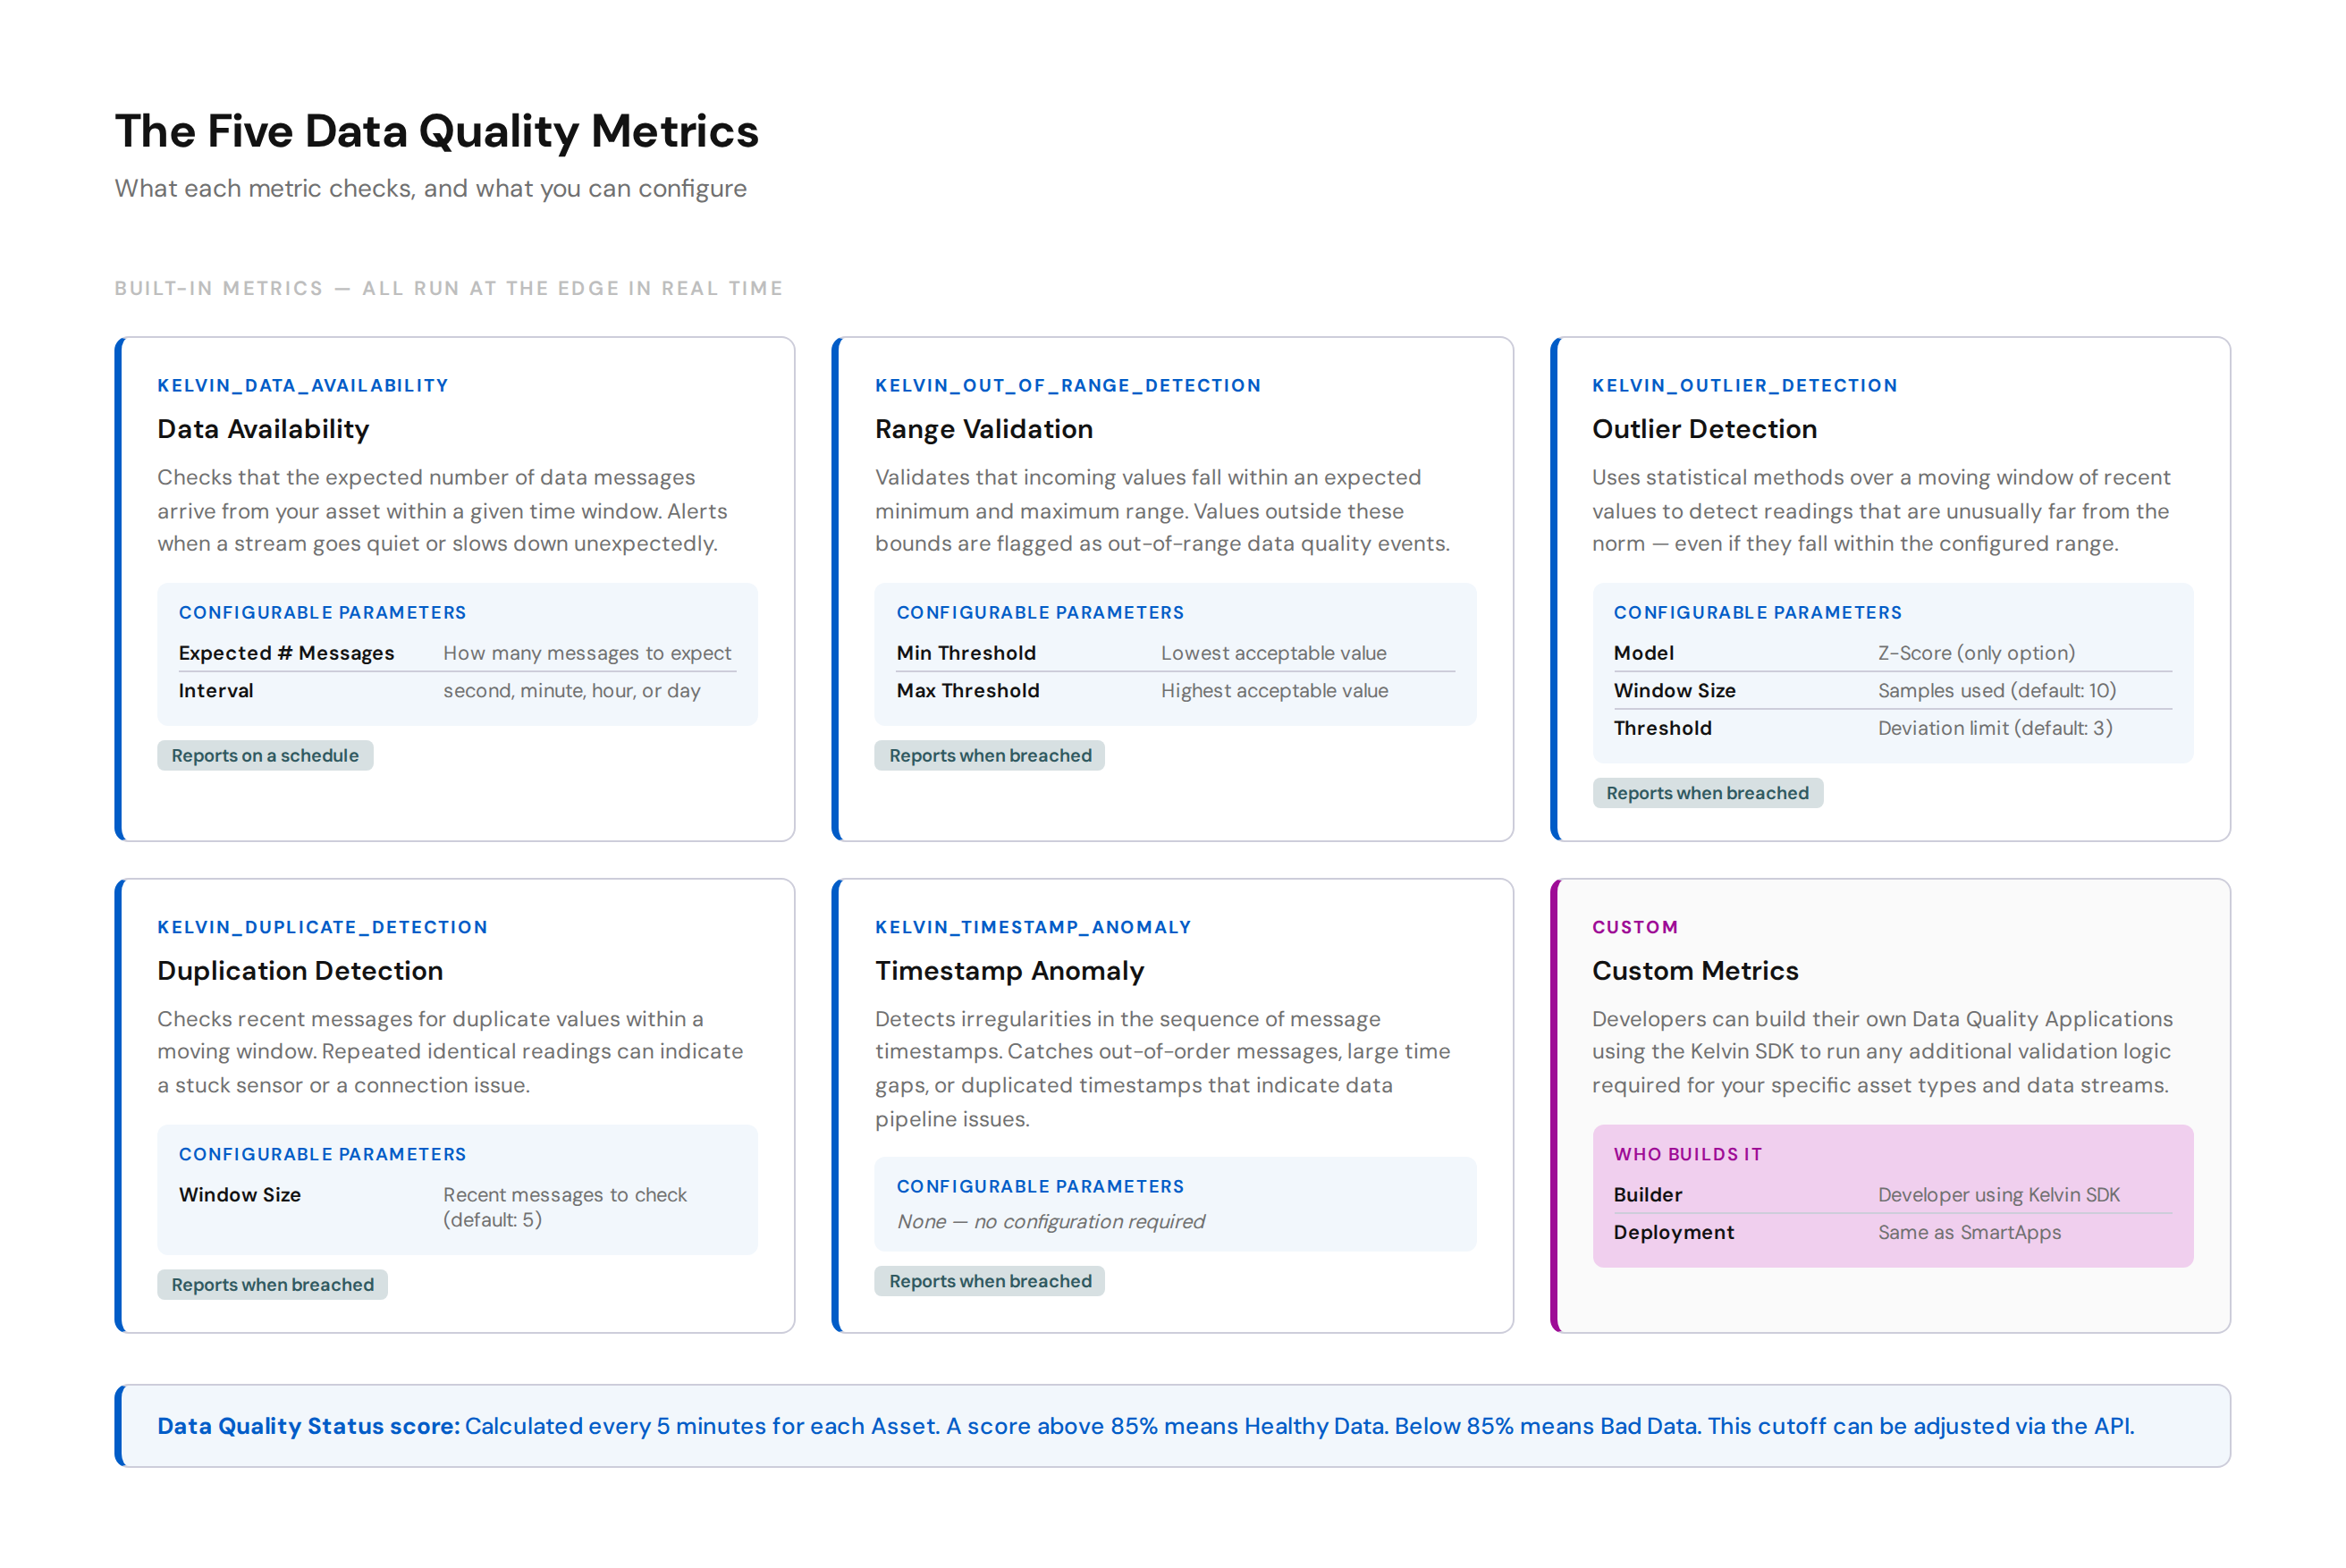
The Data Quality Status for each asset is calculated every 5 minutes. It is a percentage score across all enabled metrics. A score above 85% means Healthy Data. Below 85% means Bad Data. This threshold can be adjusted via the API.
Pro Tip
Not every metric makes sense for every data stream. A flow rate sensor might need Range Validation and Outlier Detection. A binary status signal would need Duplication Detection. Enable only what is relevant to each stream.
Configuring Data Quality
Before any metrics run, you need to configure them for your Asset / Data Stream pairs.
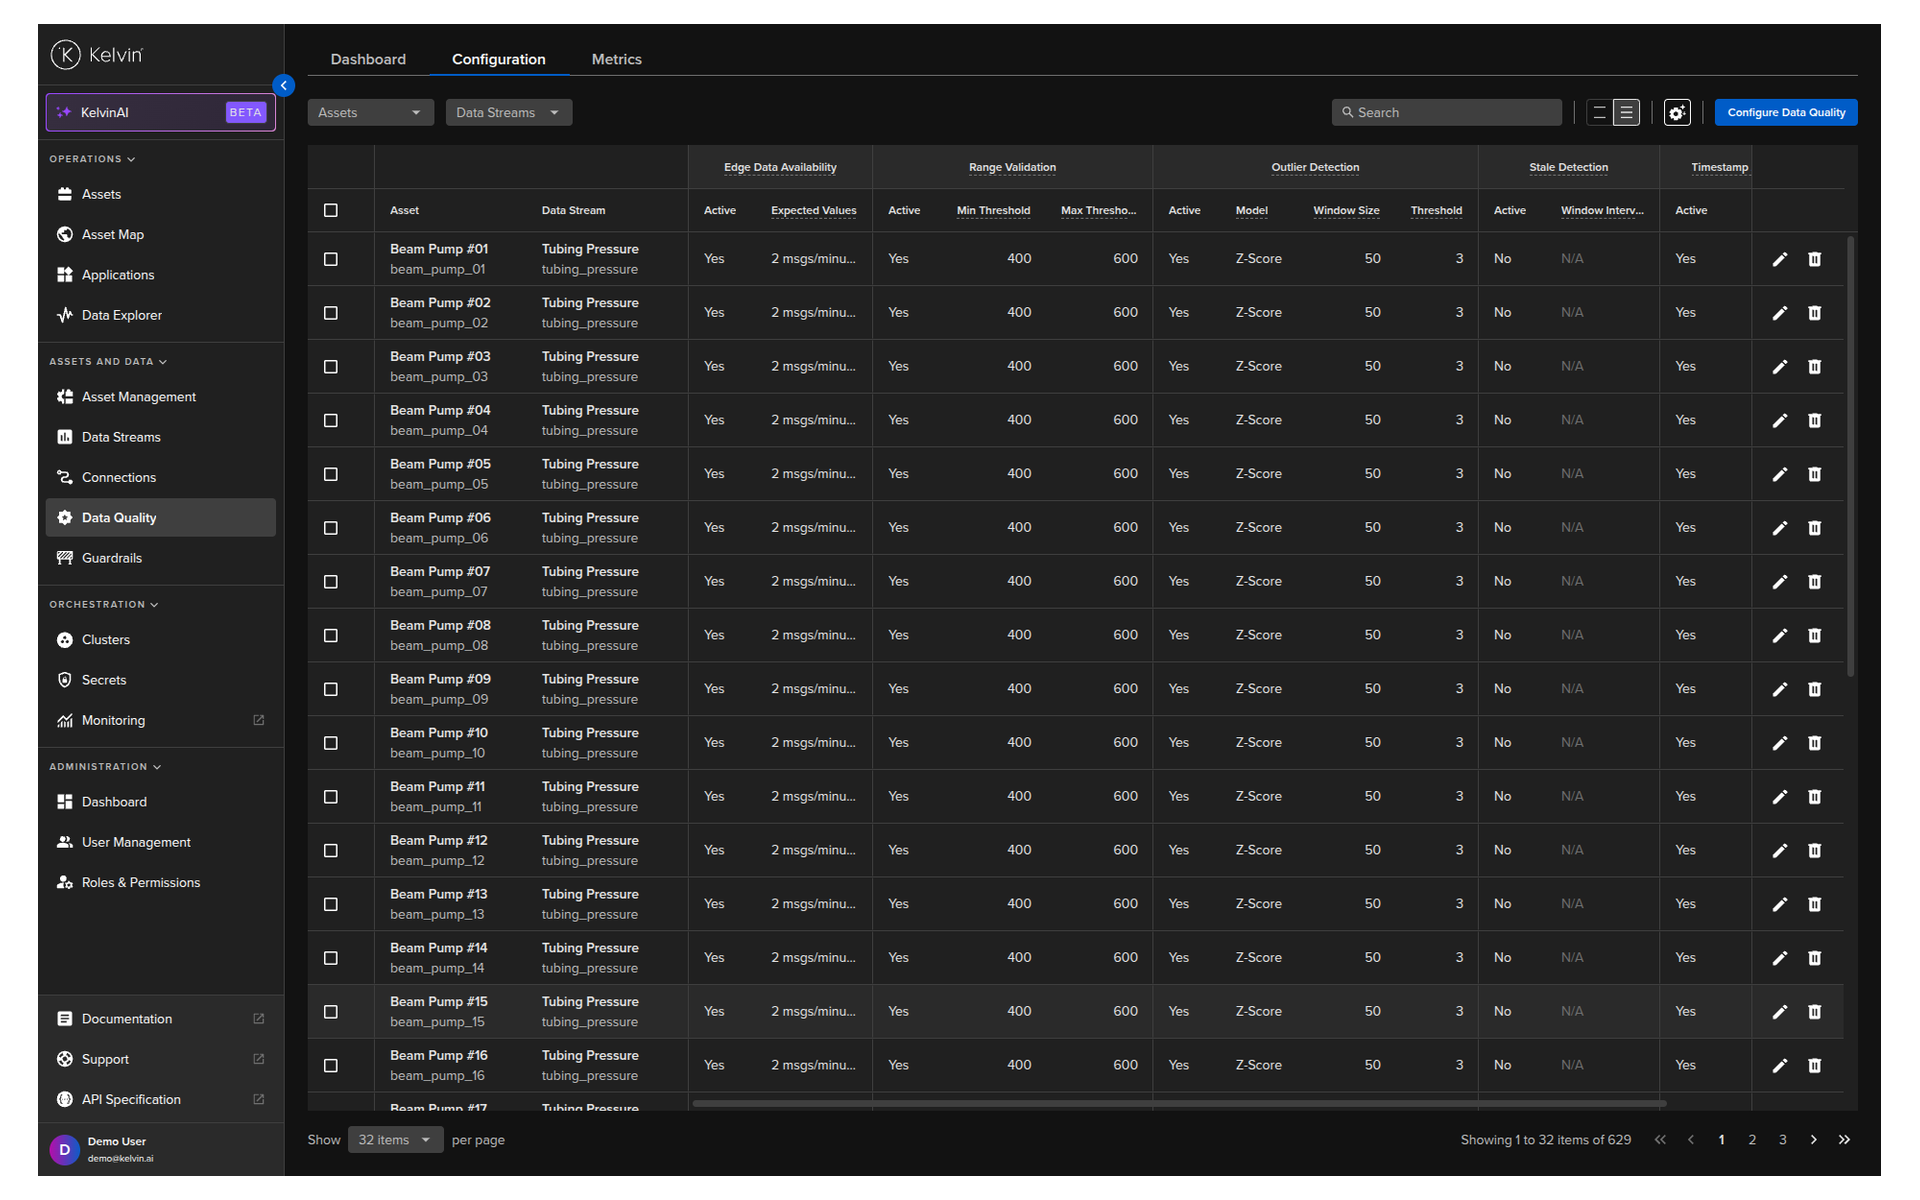
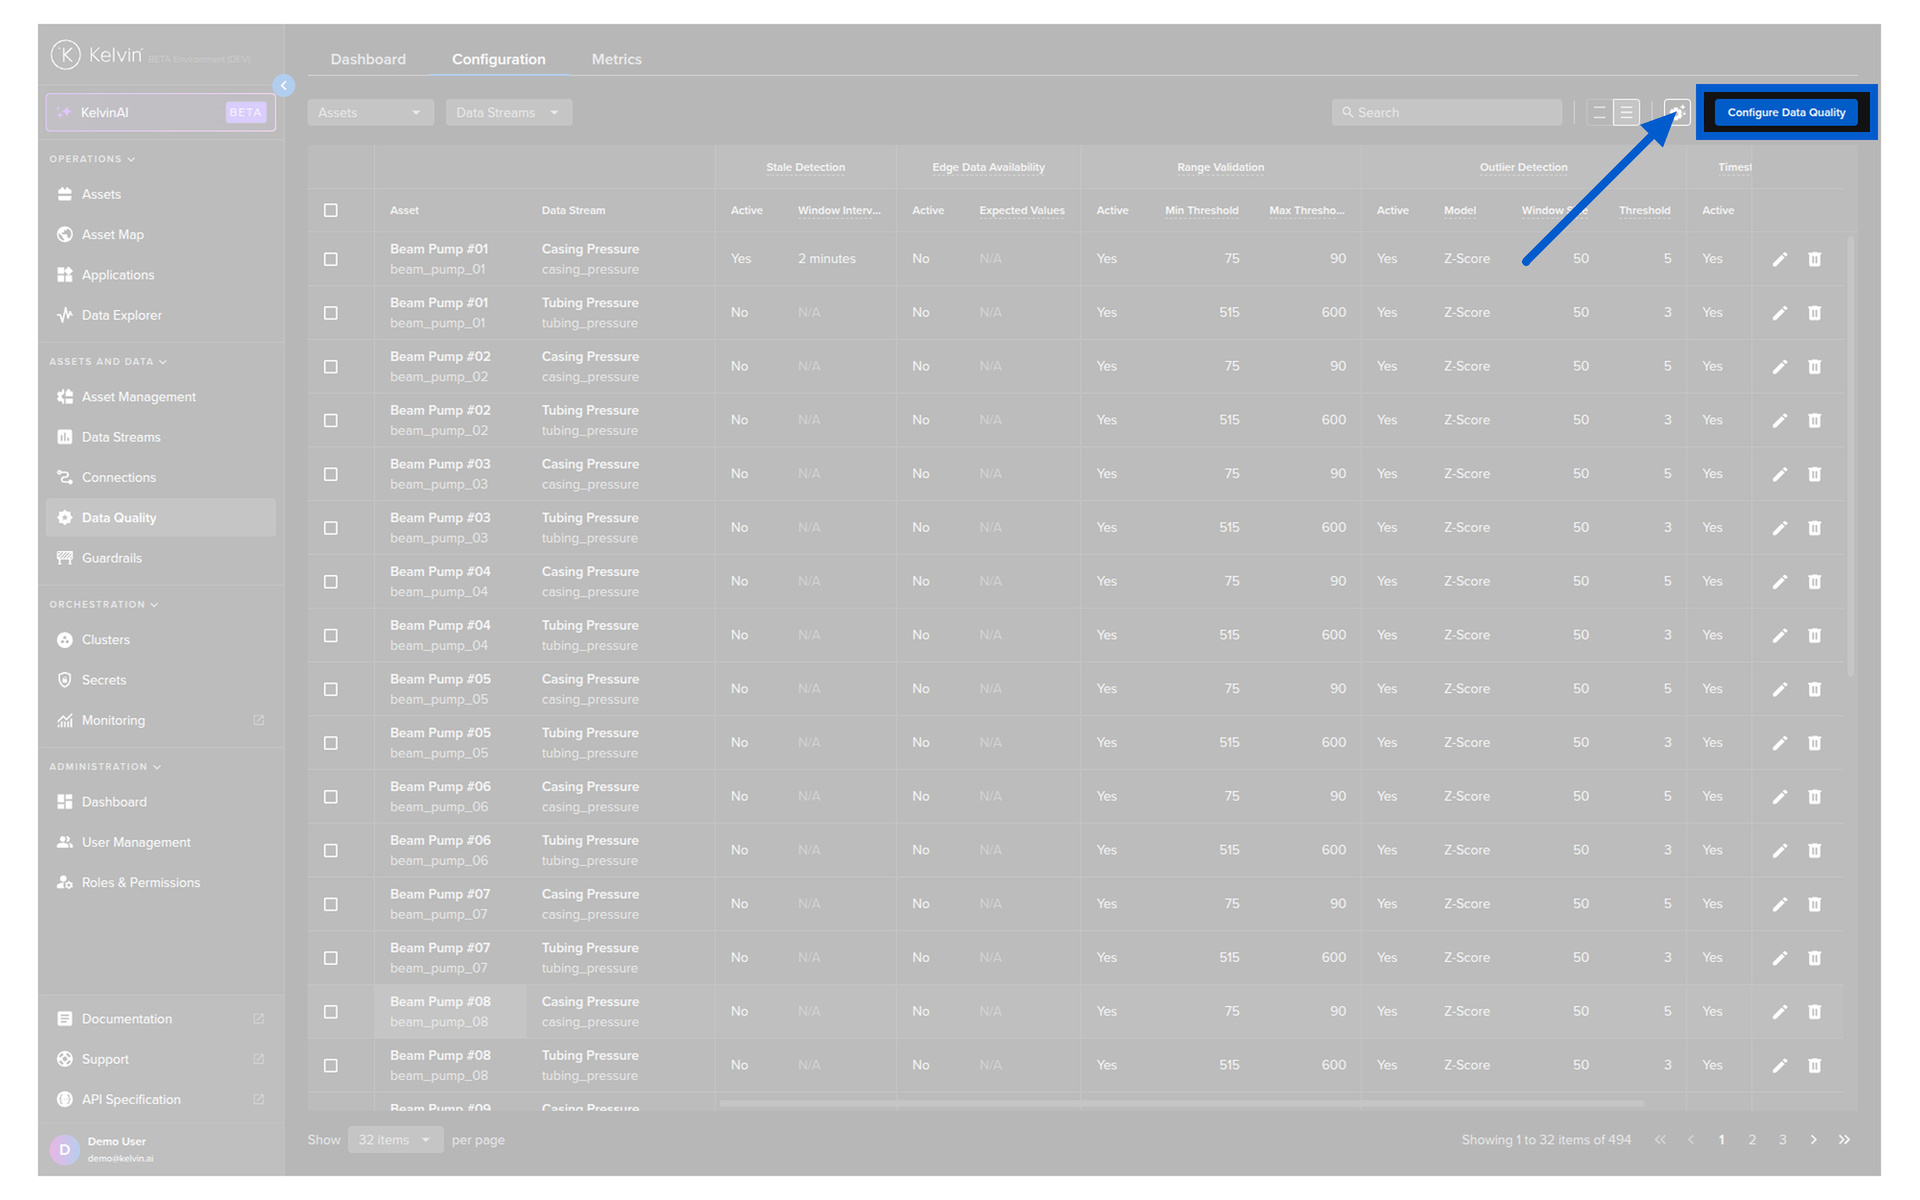
Go to Data Quality in the left sidebar, then click the Configuration tab.
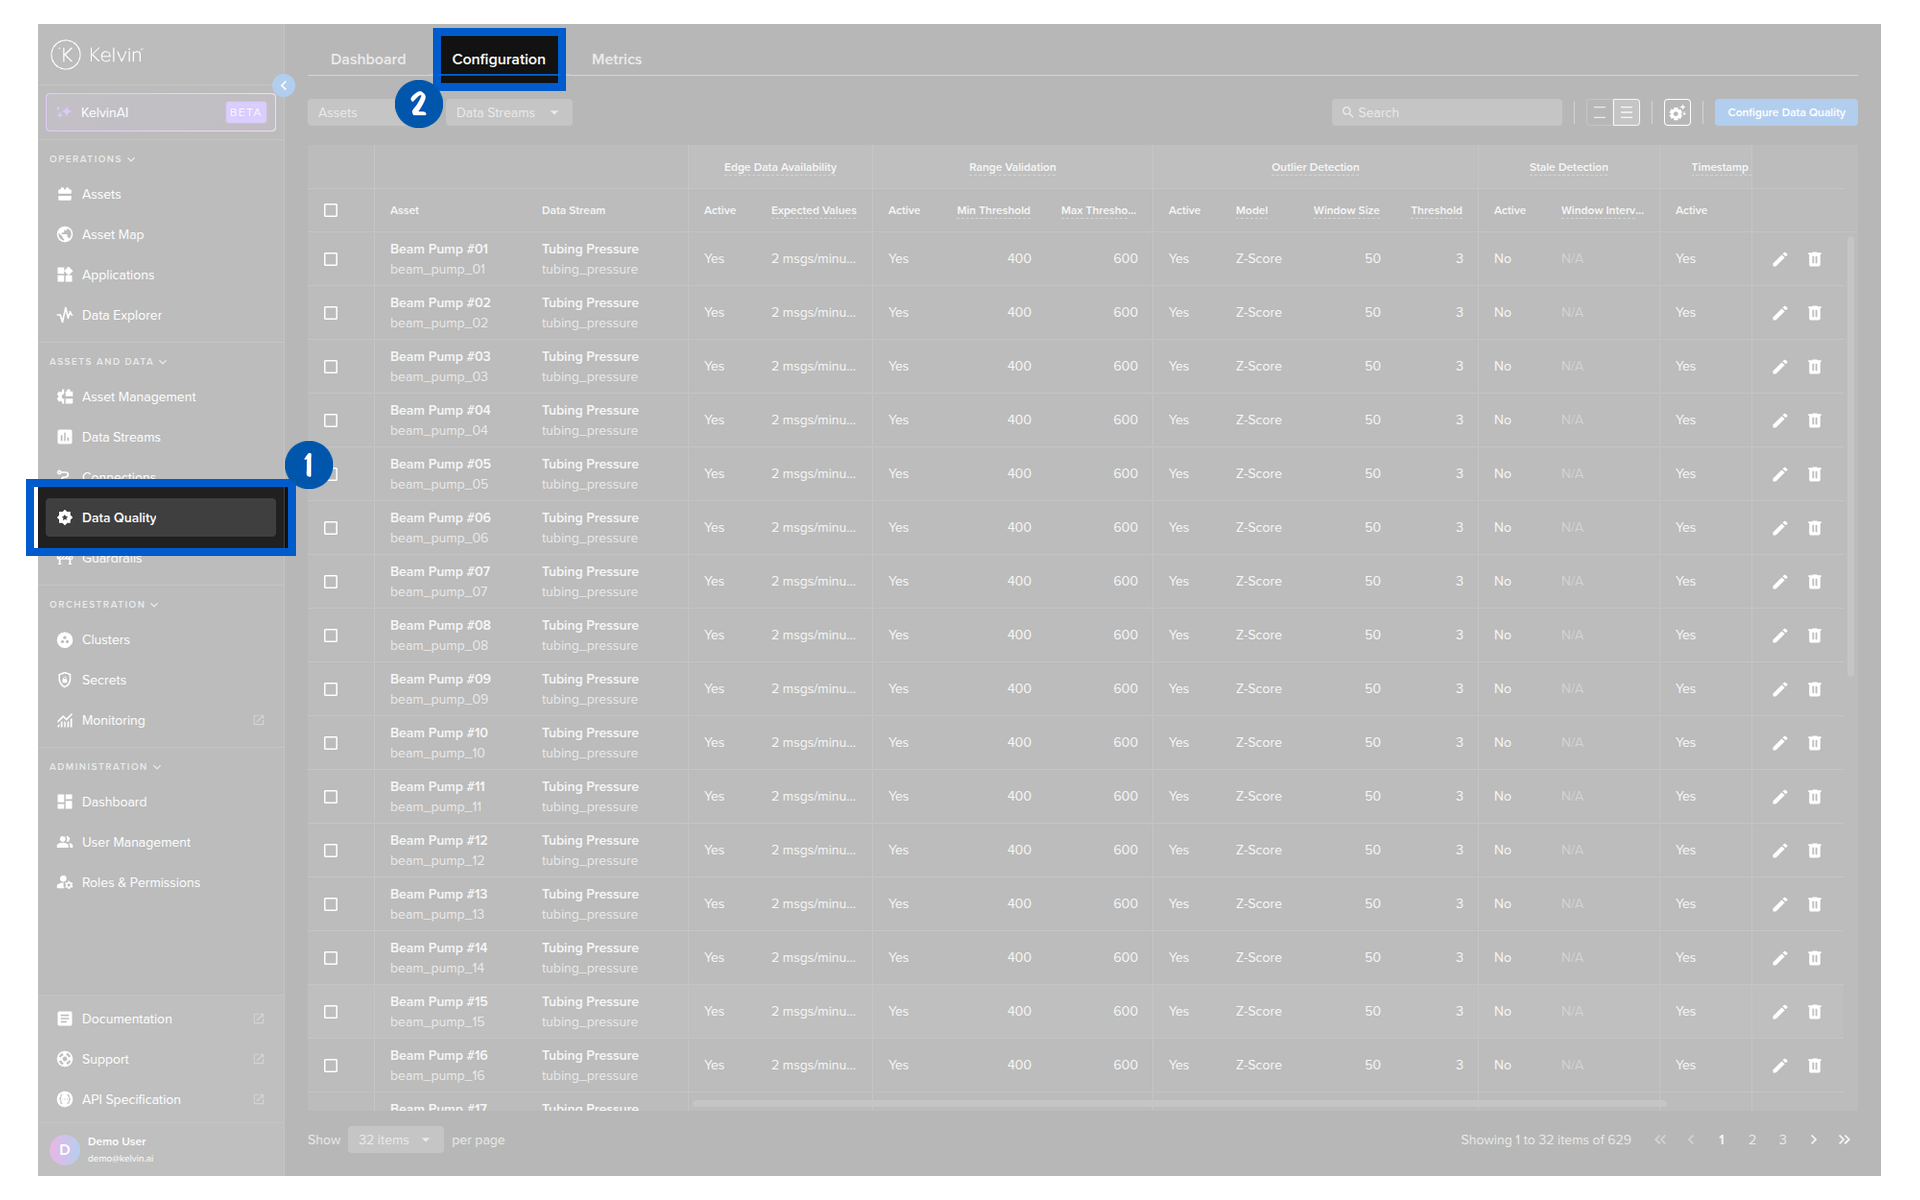
You will see all currently configured pairs. Click the Configure Data Quality button to add new ones.
Selecting your assets
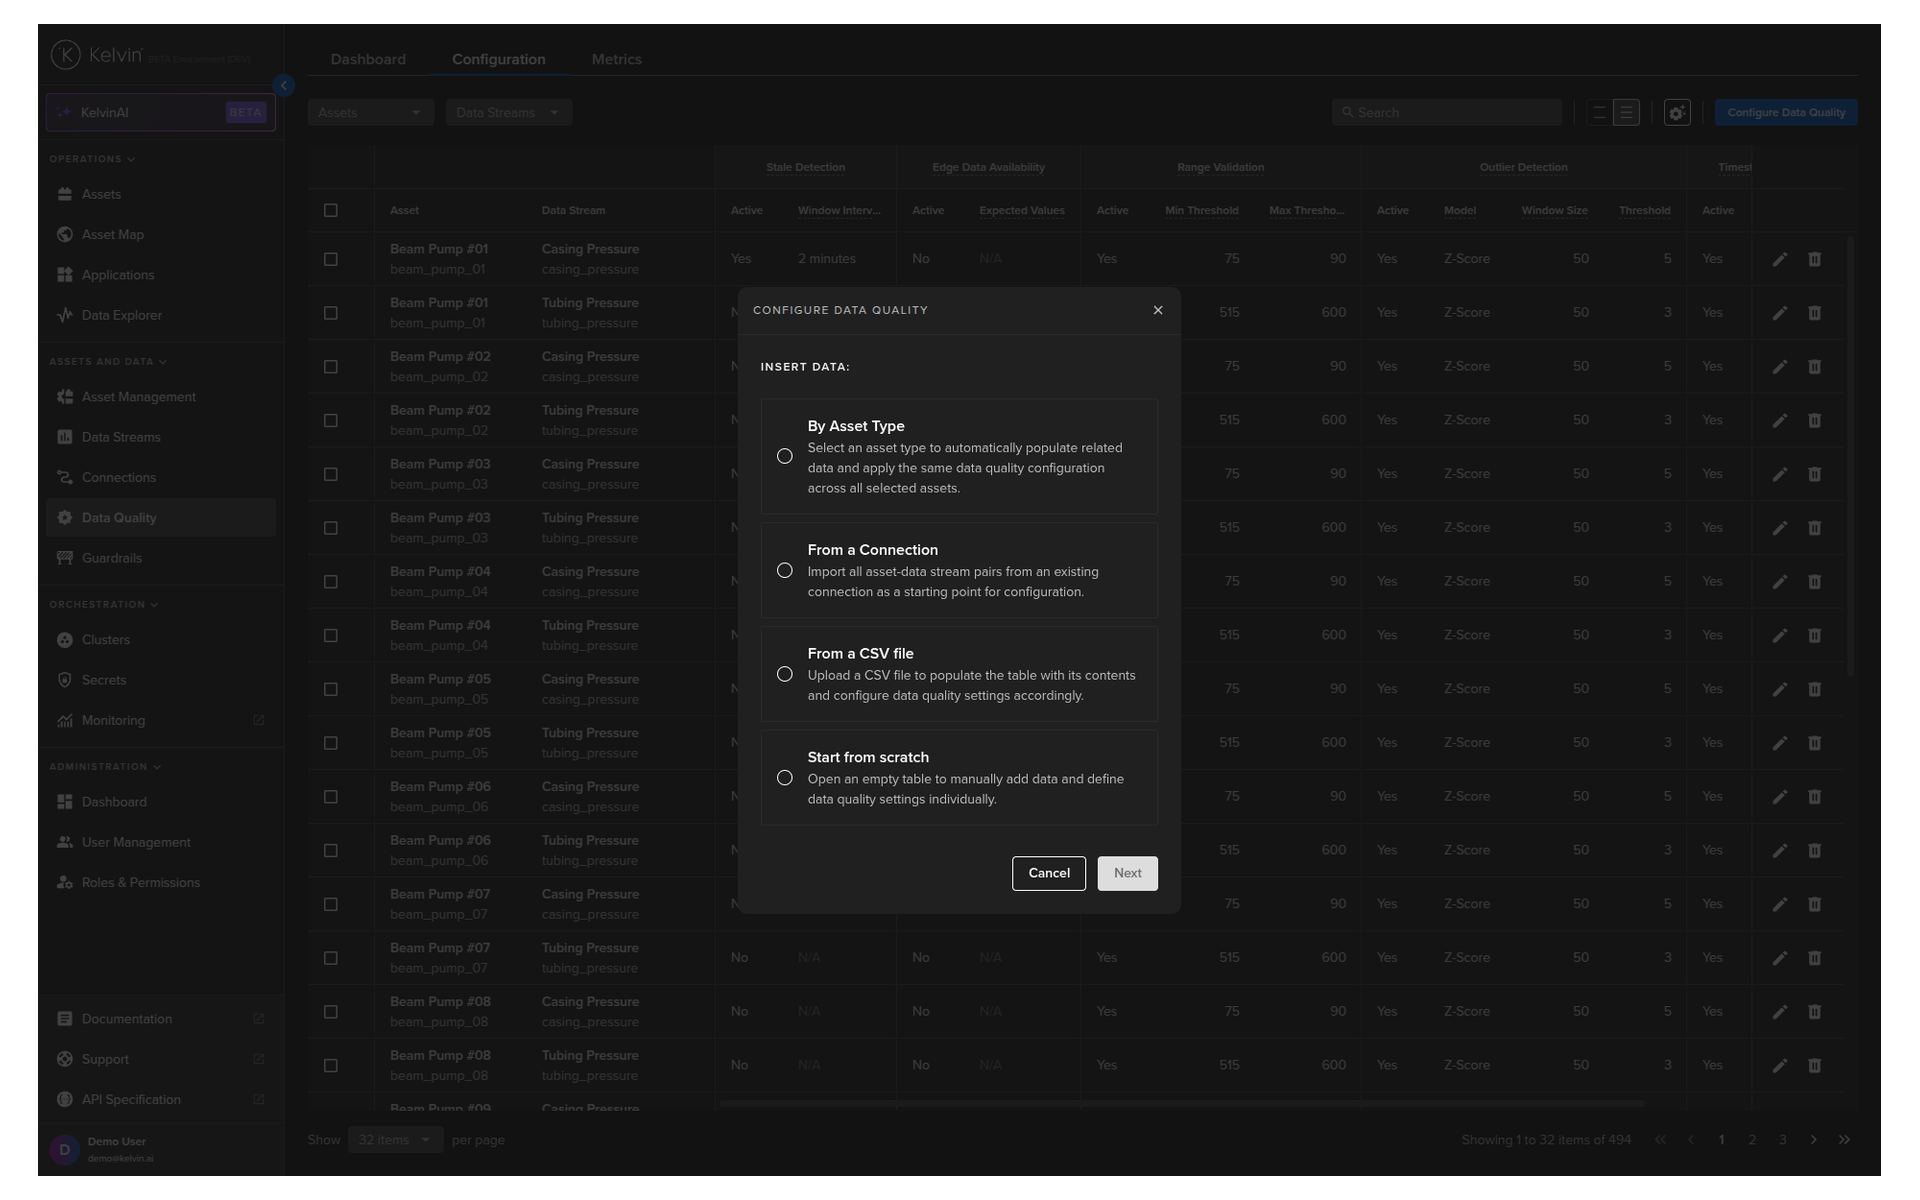
A popup appears with four ways to select which Assets and Data Streams to configure.
| Method | Best for |
|---|---|
| By Asset Type | Configuring all assets of a given type at once. All assets in that type are auto-selected, though you can deselect individual ones. |
| From a Connection | Configuring all Asset / Data Stream pairs that come from a single Connection. No individual selection — all pairs in the Connection are included. |
| From a CSV file | Large-scale configuration. Download the template, fill in Excel or Google Sheets, upload. Fastest option for many assets. |
| Start from scratch | Building a small, hand-picked list manually. |
Pro Tip
For a new platform setup with many assets, use the CSV file option. Download the sample template, fill in the metric settings for each pair, and upload in one step. The platform will validate the file and highlight any errors before applying.
After selecting your assets, click Next to reach the Configure Data Quality screen.
Configuring the metrics
For each Asset / Data Stream row, you can enable or disable each metric and set its parameters.
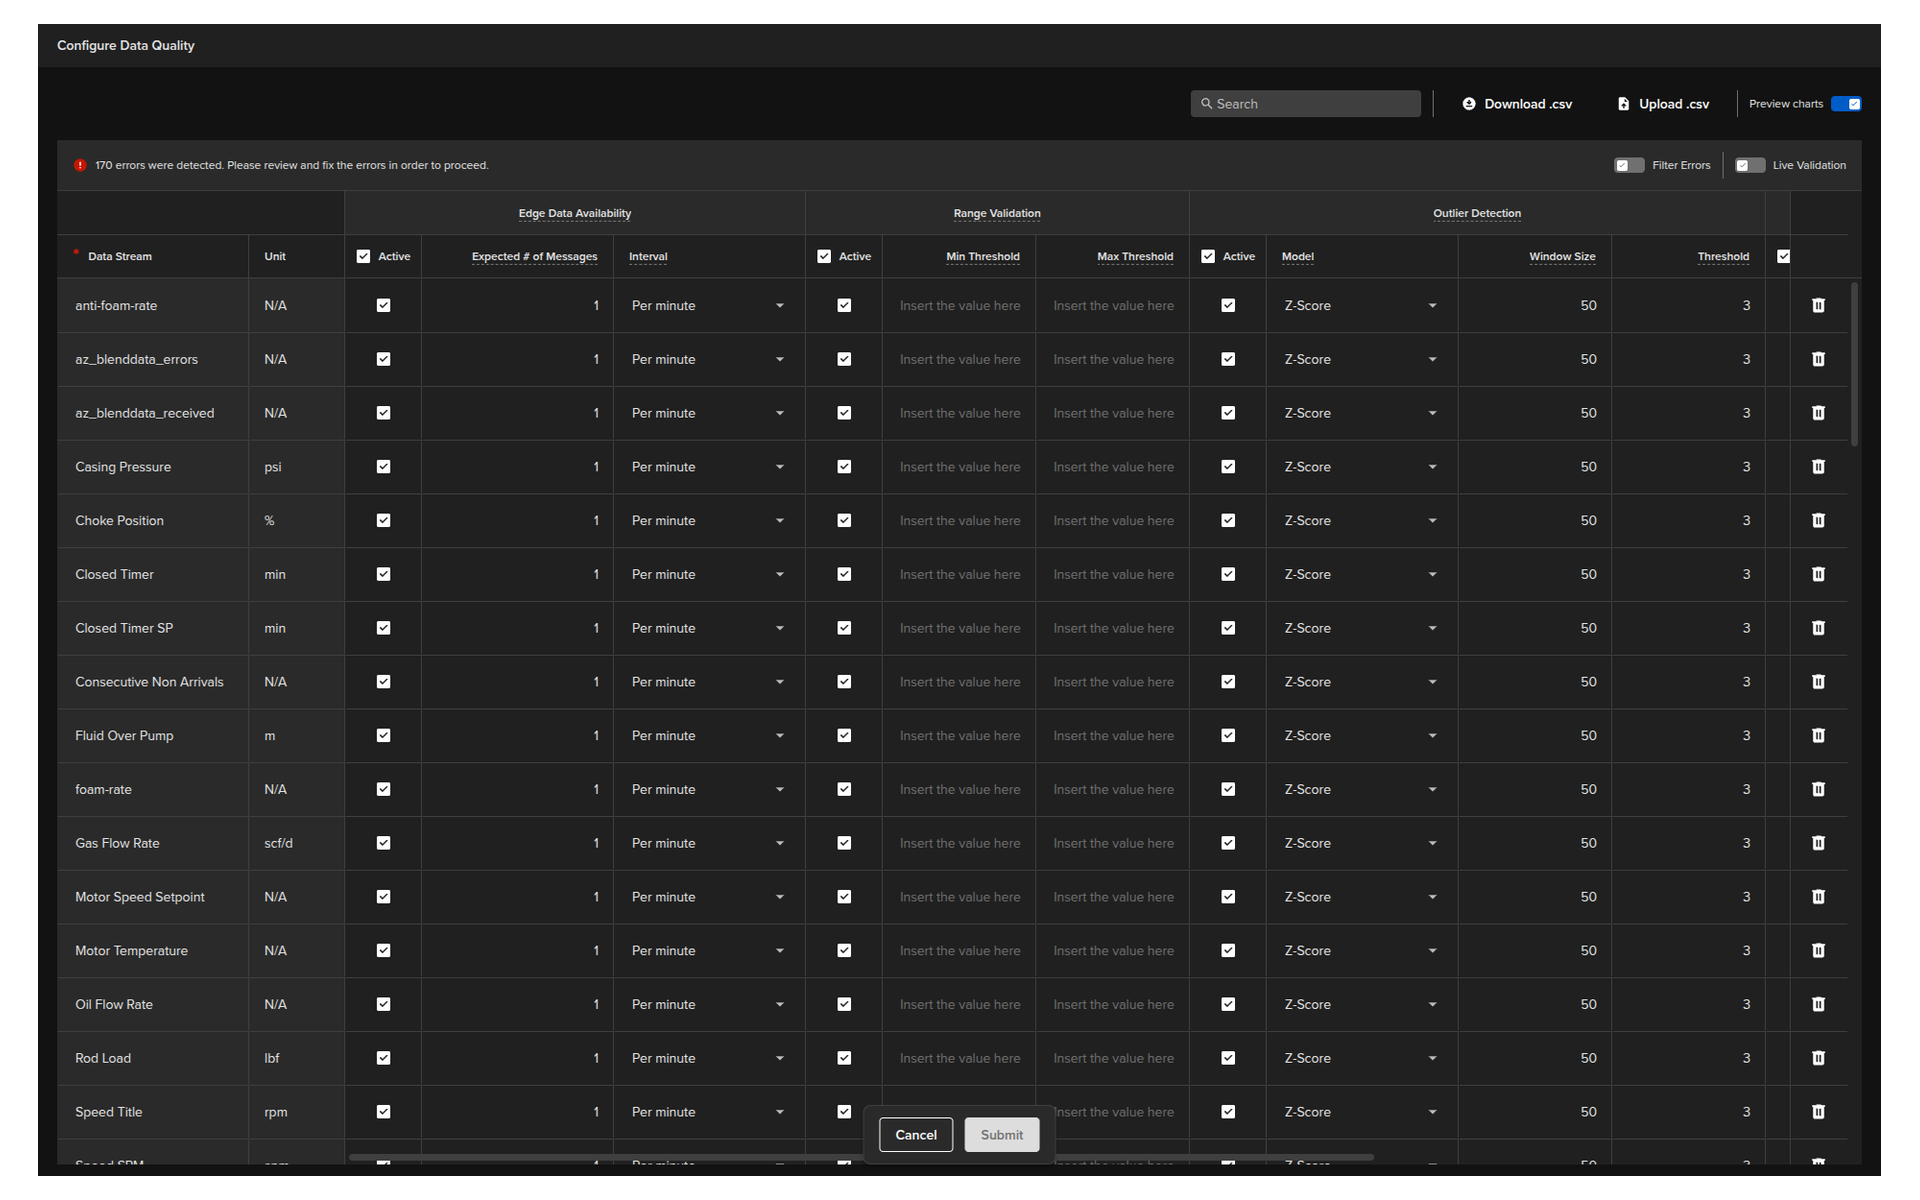
Use the Live Metrics switch in the top right corner to highlight all cells that need to be filled in. Use Filter Errors to show only rows that have configuration problems.
If you have multiple assets or data streams with the same name, a Group By dropdown appears. Group by Asset or Data Stream to apply settings to all matching rows at once — this significantly speeds up the process.
The parameters for each metric:
| Metric | Parameter | What to set |
|---|---|---|
| Edge Data Availability | Expected # Messages | How many messages you expect to arrive |
| Interval | second, minute, hour, or day | |
| Range Validation | Min Threshold | Lowest acceptable incoming value |
| Max Threshold | Highest acceptable incoming value | |
| Outlier Detection | Model | Z-Score (only option currently) |
| Window Size | Number of samples to use (default: 10) | |
| Threshold | Deviation limit to flag as outlier (default: 3) | |
| Duplication Detection | Window Size | Number of recent messages to check (default: 5) |
| Timestamp Anomaly | None | No configuration needed |
For Operations
You do not need to enable all five metrics for every data stream. Each metric you enable adds processing at the edge. Only enable what you need. Data Availability and Range Validation are good starting points for most asset types.
Editing and deleting configurations
To edit an existing configuration, find the row in the Configuration overview and make your changes inline. To delete a configuration, select the row and use the delete option. Deleting stops all metric checks for that Asset / Data Stream pair.
The Data Quality Dashboard
Once metrics are running, the dashboard shows you the results.
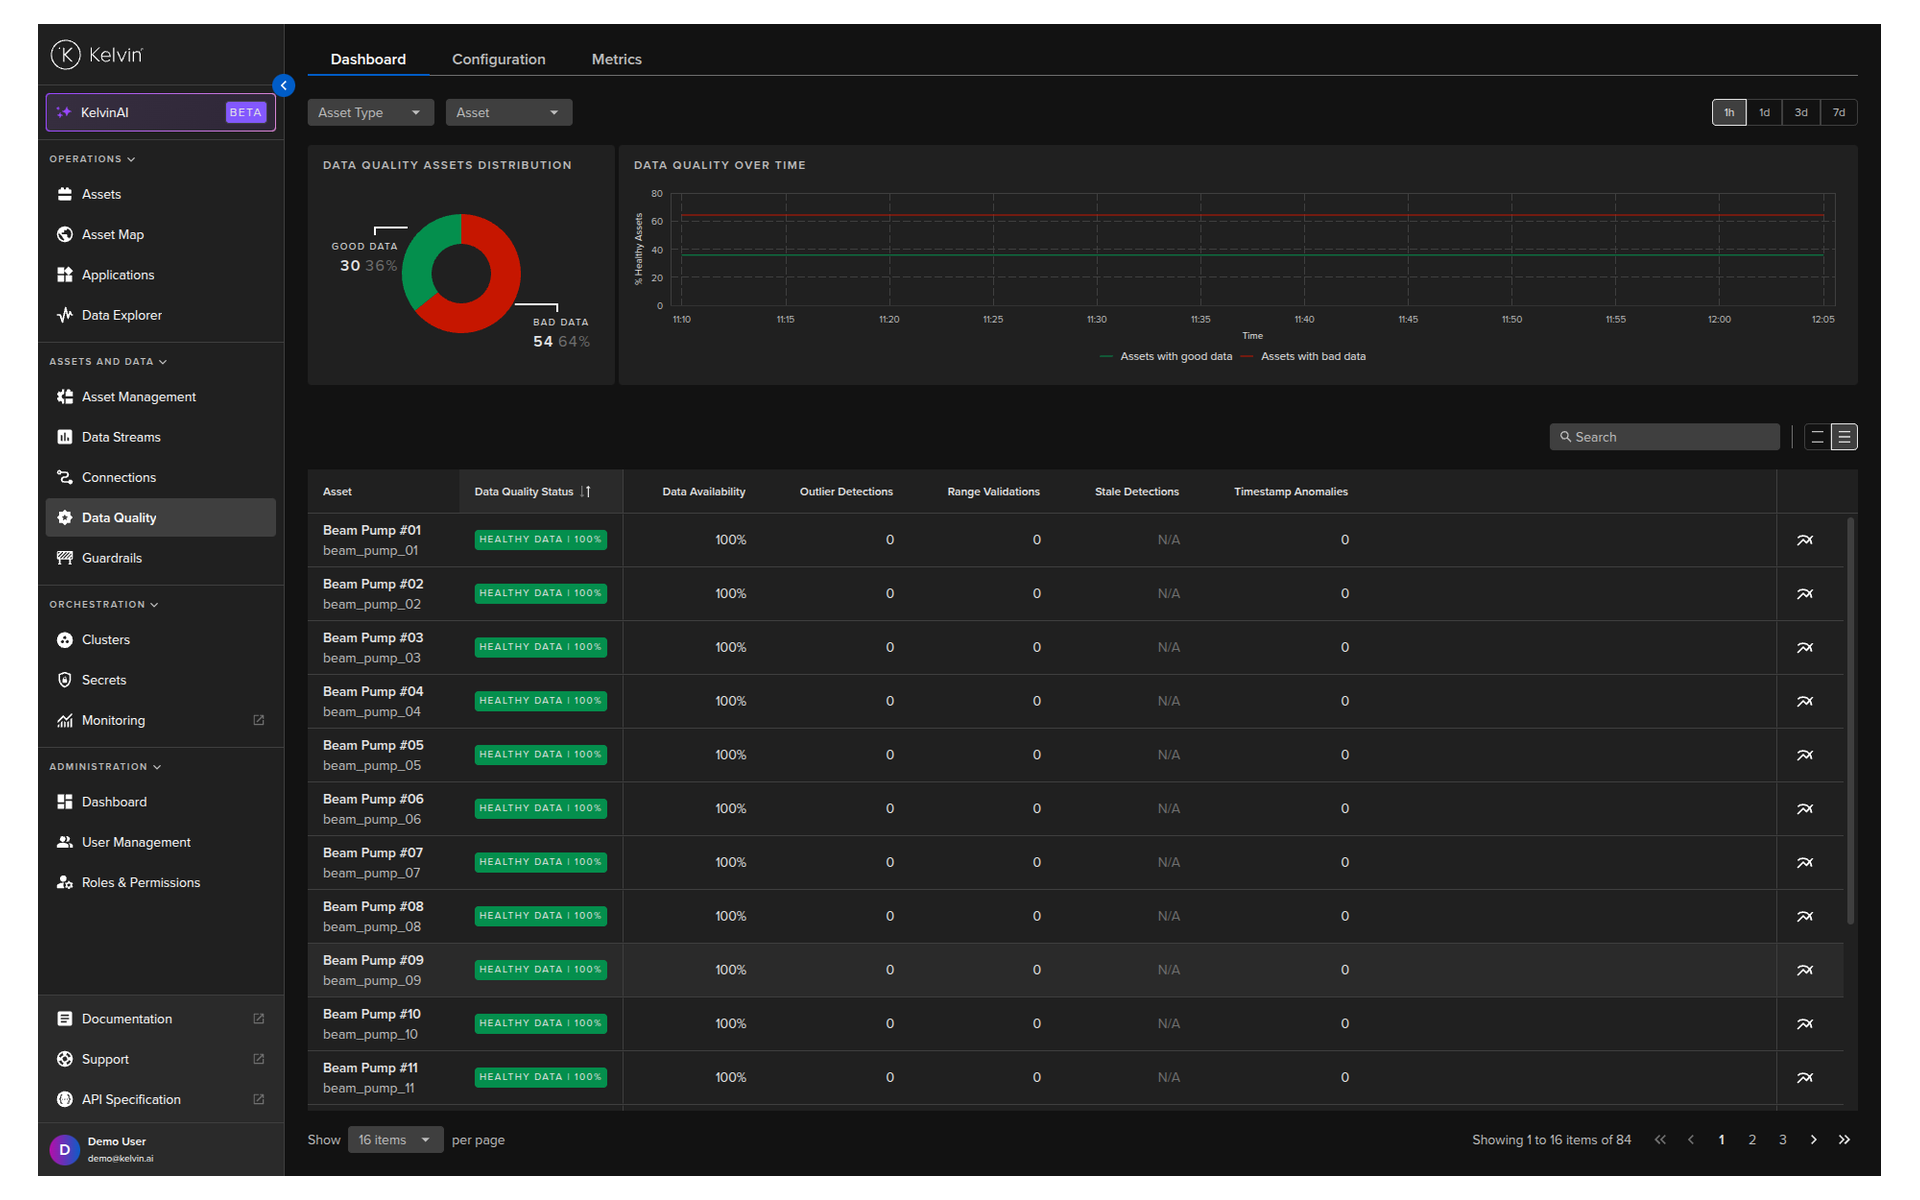
Go to Data Quality in the left sidebar, then click the Dashboard tab.
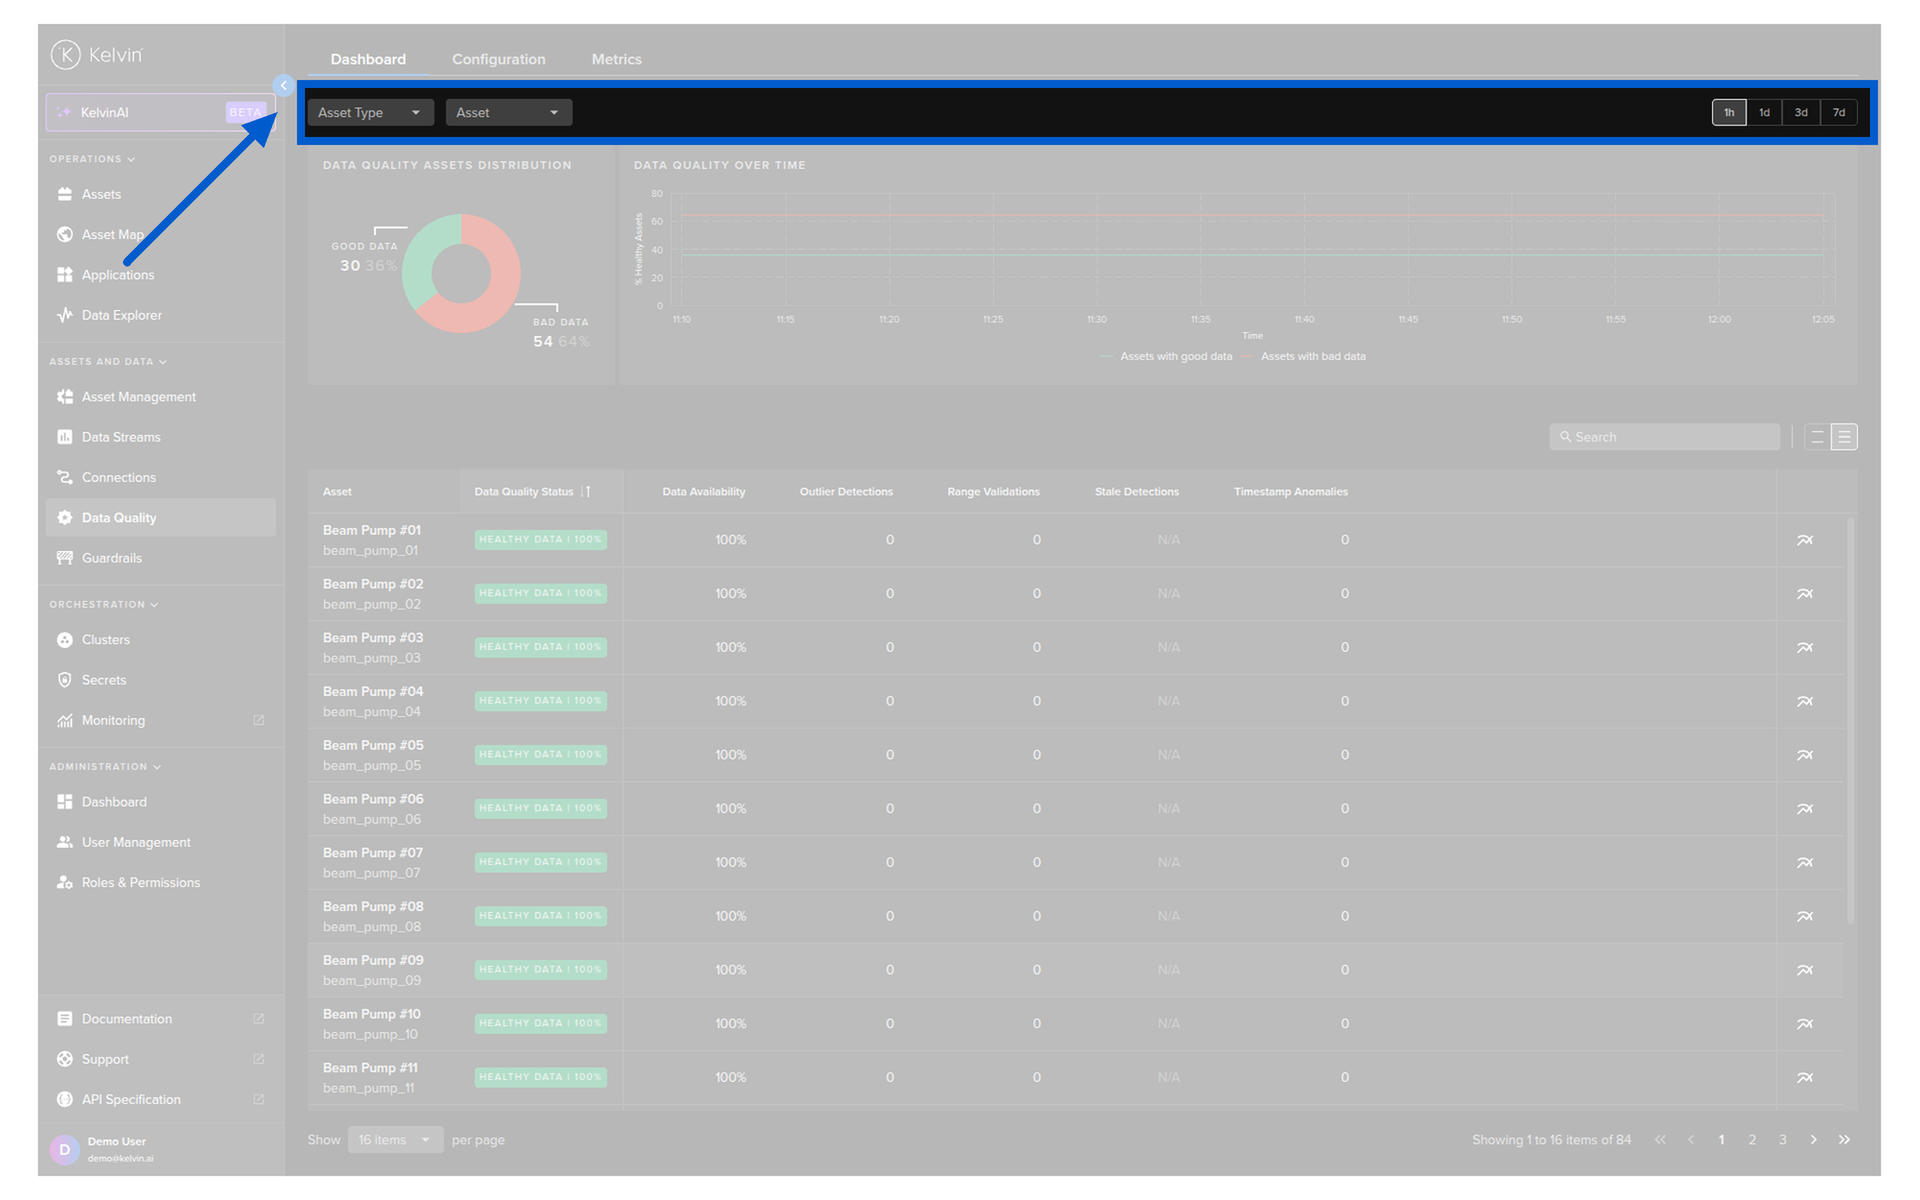
Filters
Three filters at the top apply to both the statistics and the asset list.
| Filter | Description |
|---|---|
| Asset Type | Select one or more asset types to limit the view |
| Asset | Select specific assets |
| Time | 1 hour, 1 day, 3 days, or 7 days — based on current time |
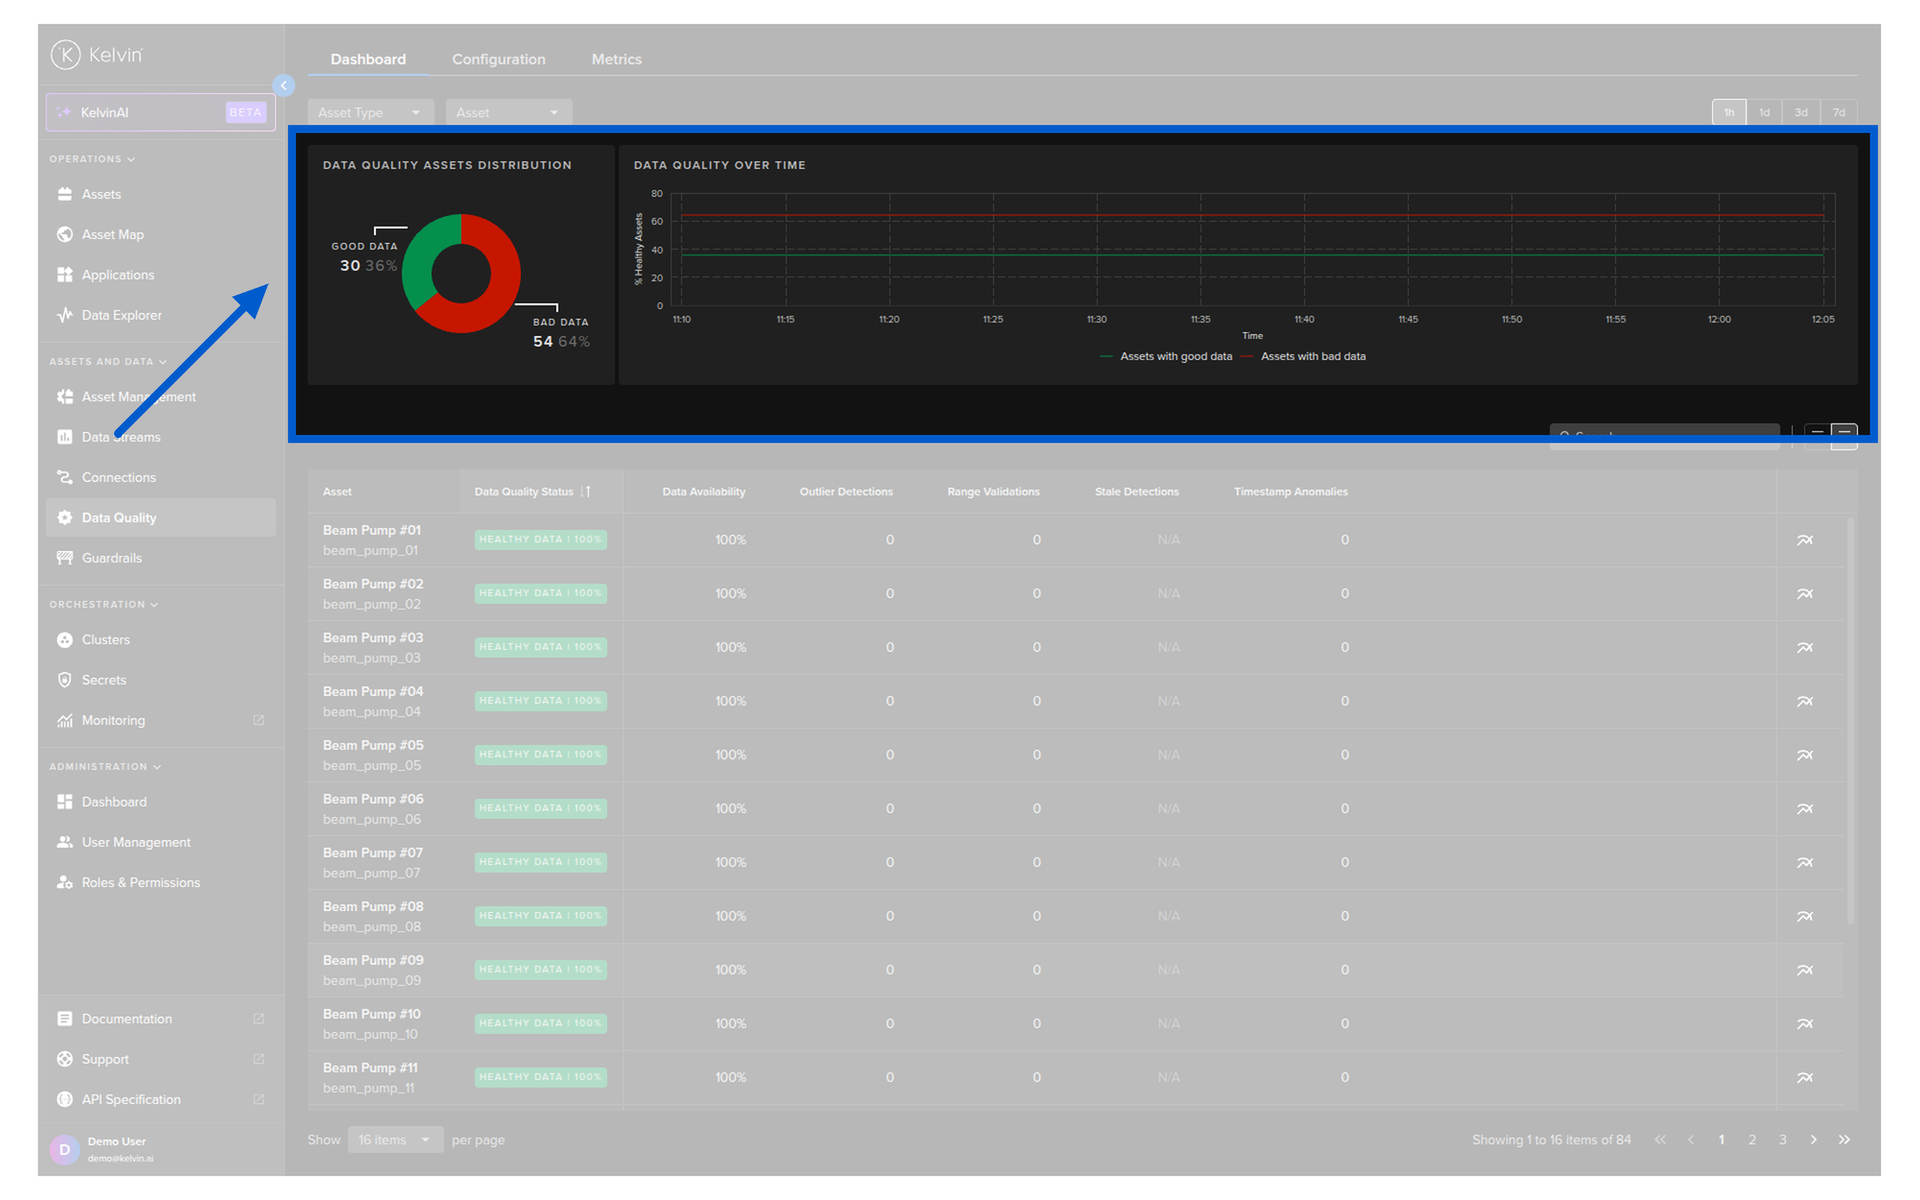
Statistics
The statistics section shows the percentage of good vs bad data across your filtered assets over the selected time period.
Asset list
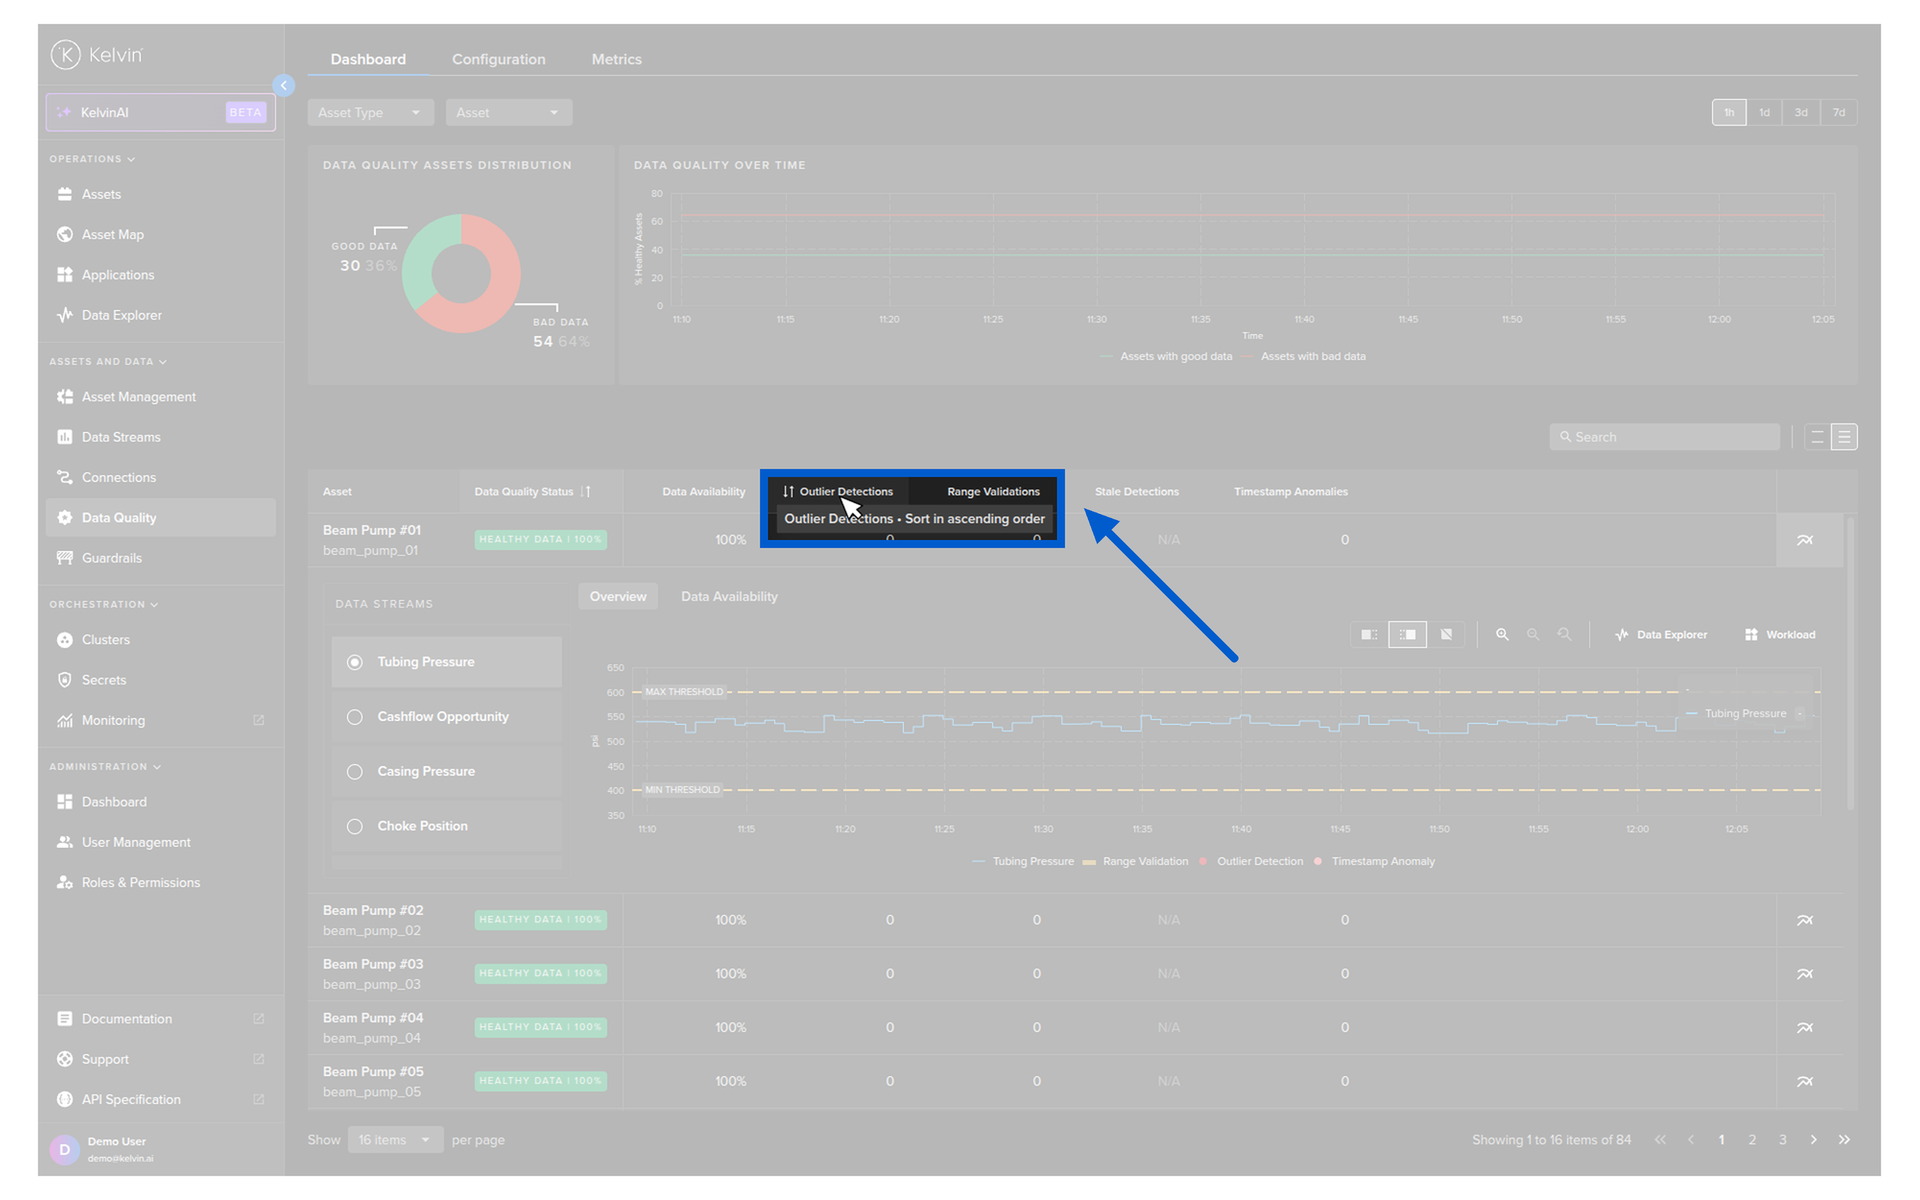
The asset list shows each asset's Data Quality results per metric.
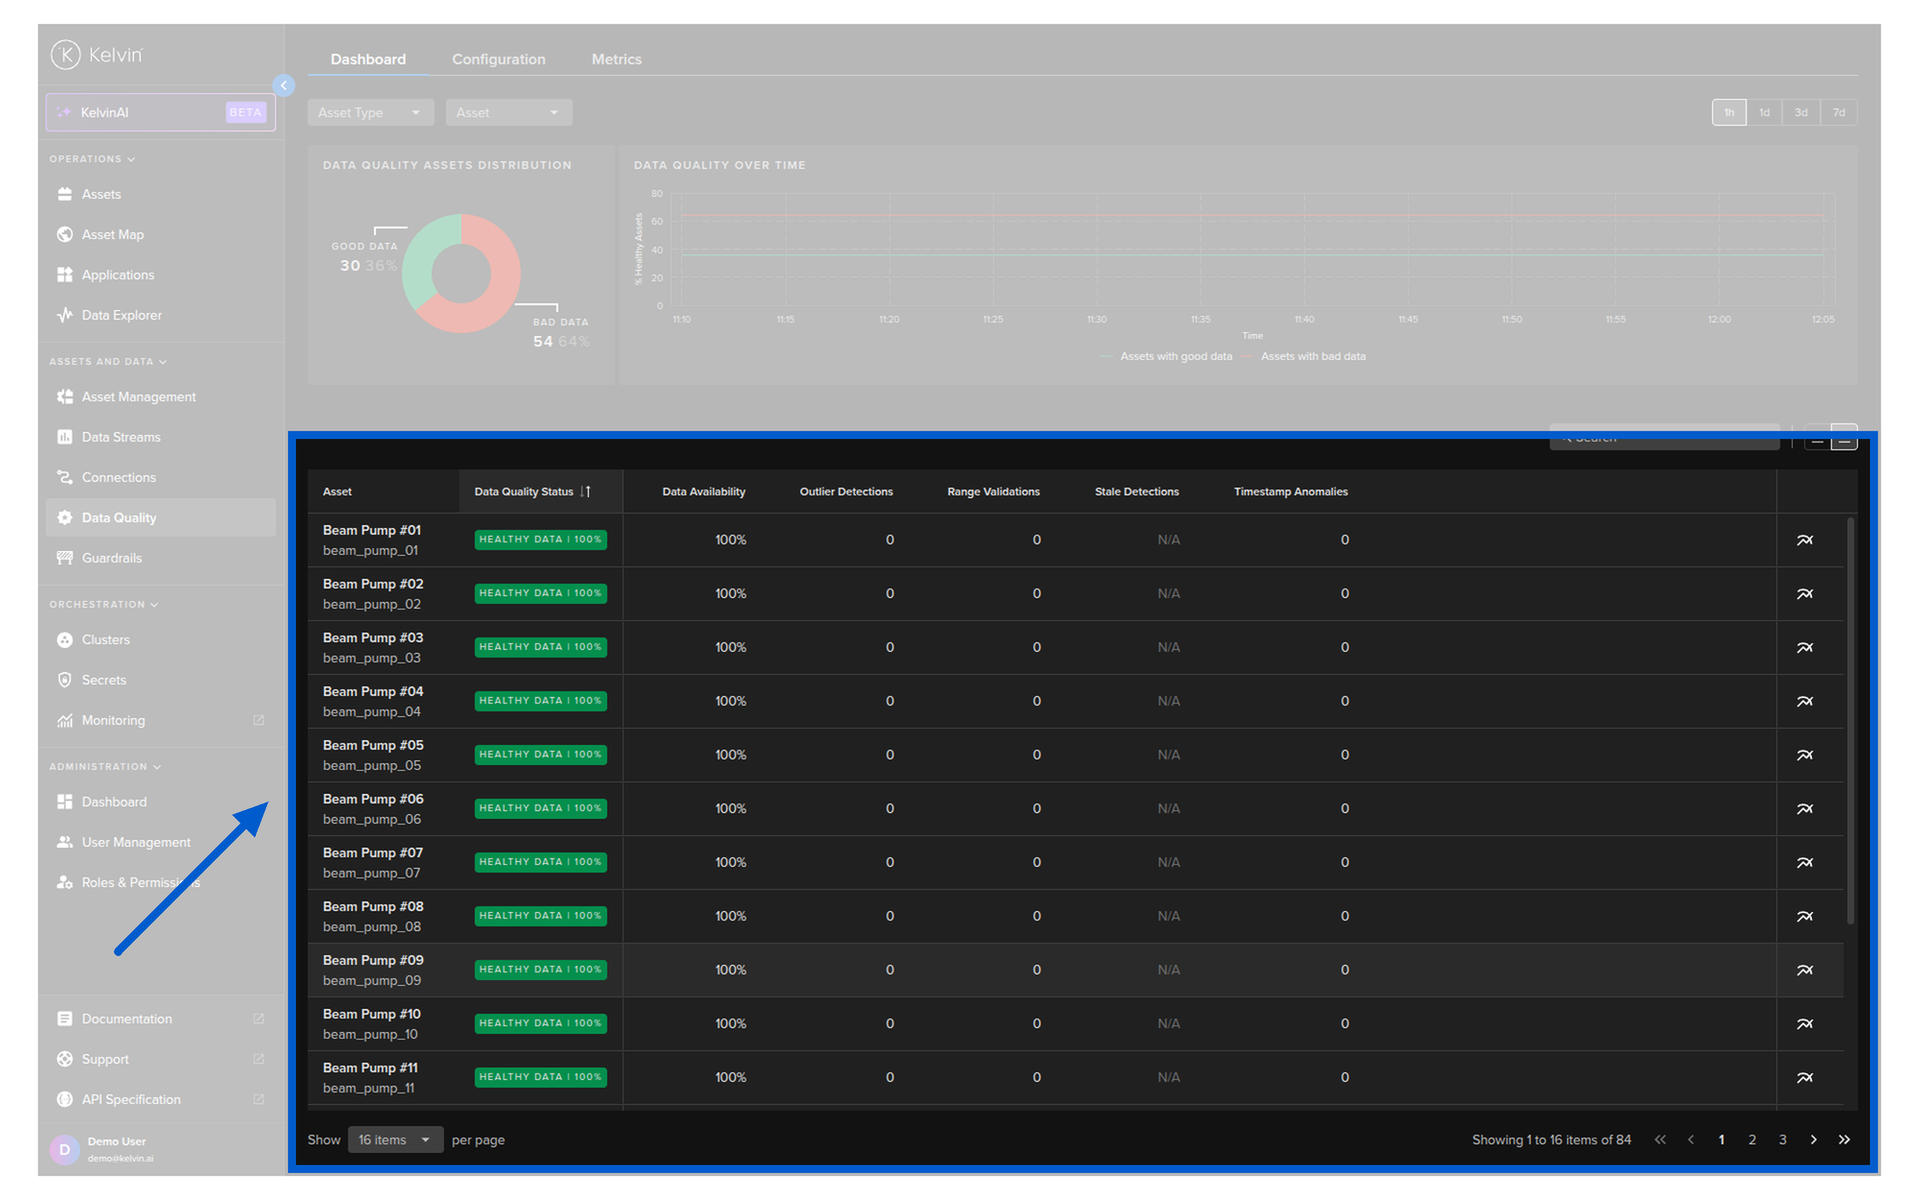
If a metric is not enabled for an Asset / Data Stream pair, you will see N/A in that column.
Pro Tip
Hover your mouse over any column header to see a popup explanation of what that metric checks. This is useful when reviewing the dashboard with your team.
Asset / Data Stream details
To drill into one asset, click the analytics icon on its row.
![]()
Select a Data Stream from the list on the left to see its detailed metric results on a timeseries graph.
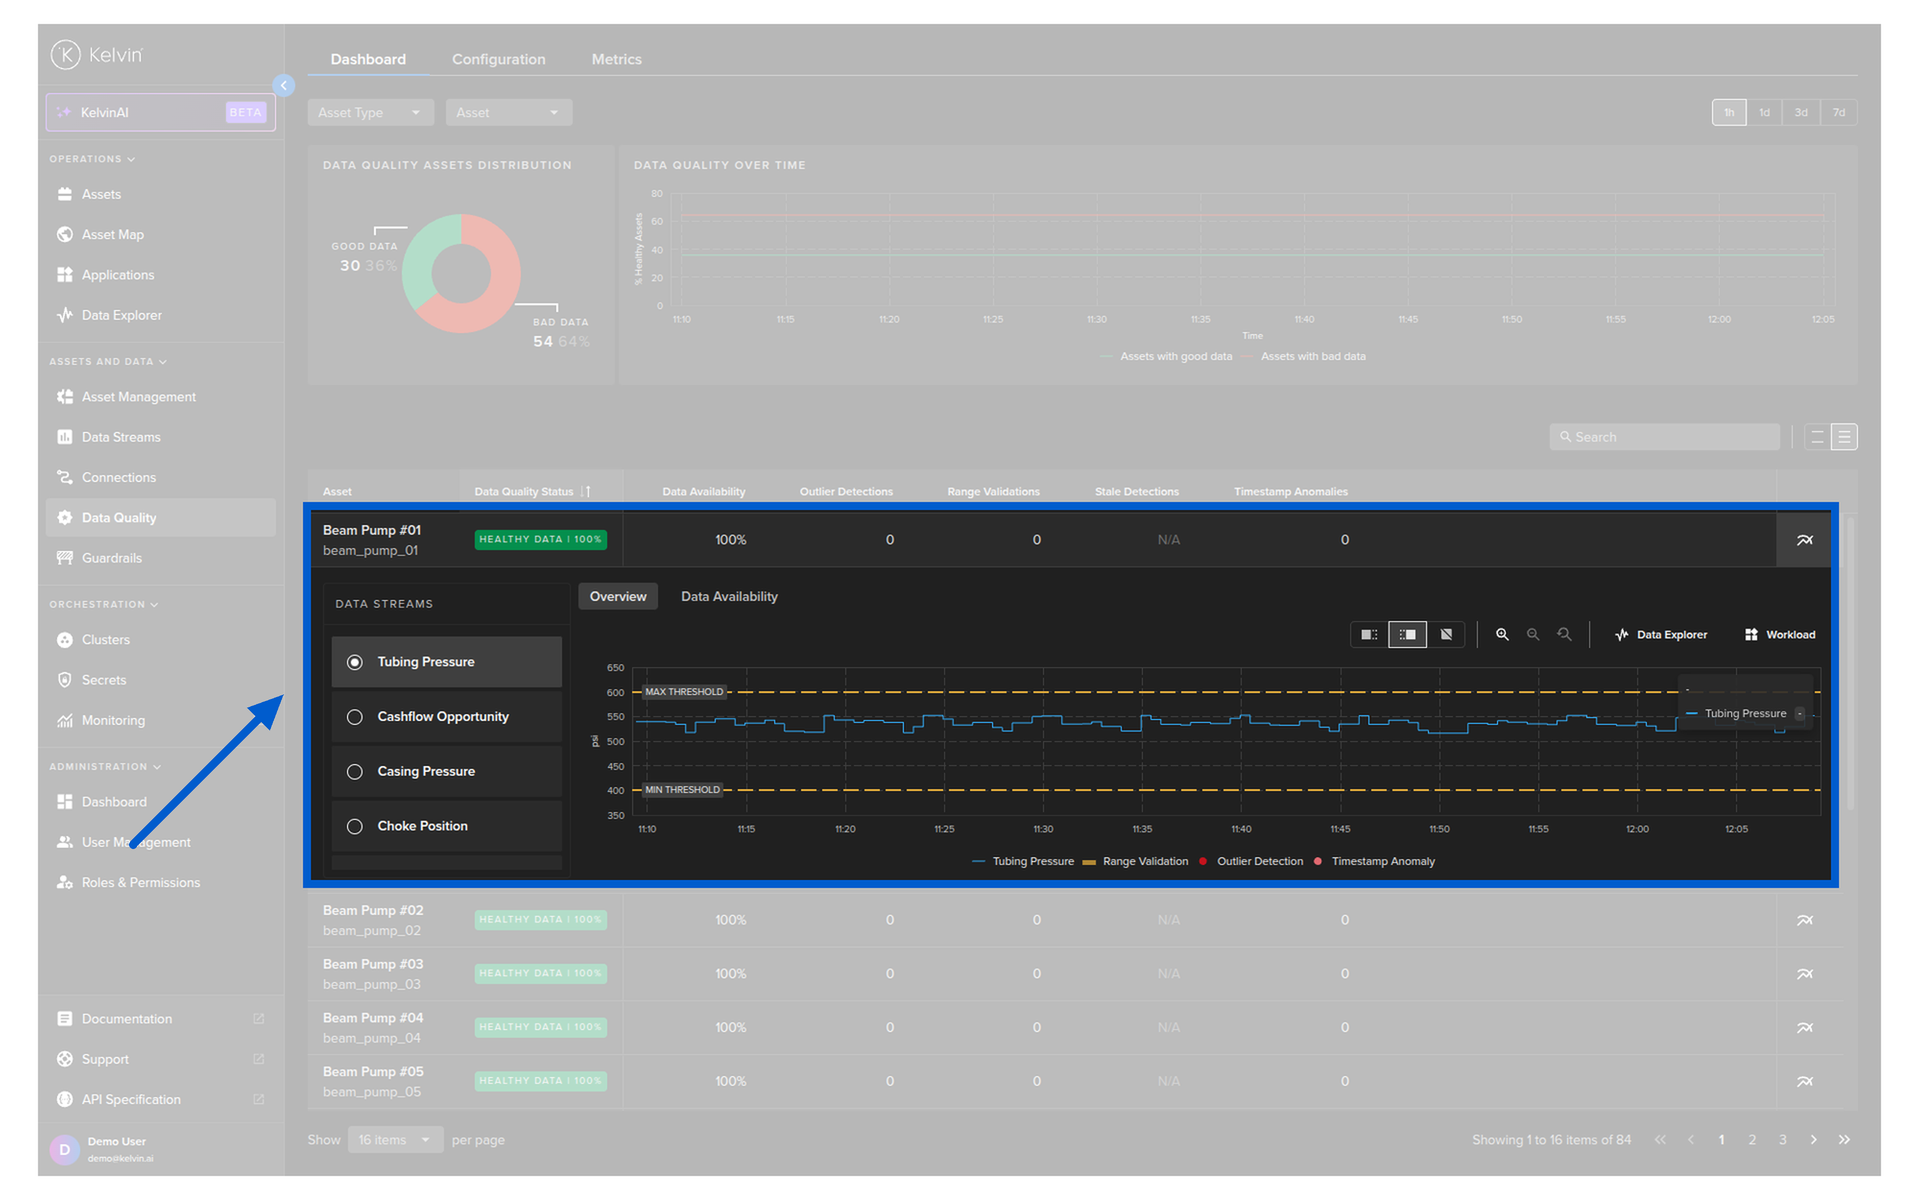
Pro Tip
In the Data Stream list, if you see a bad data tag, that is a summary flag compiled from all Data Quality metrics across all data streams. To find the specific alert, scroll through the data streams on the left until you see the one with the Data Quality event.
If you click the link next to a Data Stream name, it will take you directly to the Clusters section and show you the logs for the specific Connection workload collecting that data from the asset.
Part 2: Guardrails
What are Guardrails?
Guardrails are the final layer of protection before any value is written to a physical asset. They apply to all control changes regardless of source — whether it is an Operations Engineer using the UI, a SmartApp issuing a recommendation, or a direct API call.
If a value breaks a guardrail rule, the control change automatically fails. The original value on the asset remains unchanged. An annotation is added to the control change record so you can see what was rejected and why.
You configure guardrails per Asset / Data Stream pair. You can apply one rule type or combine all three.
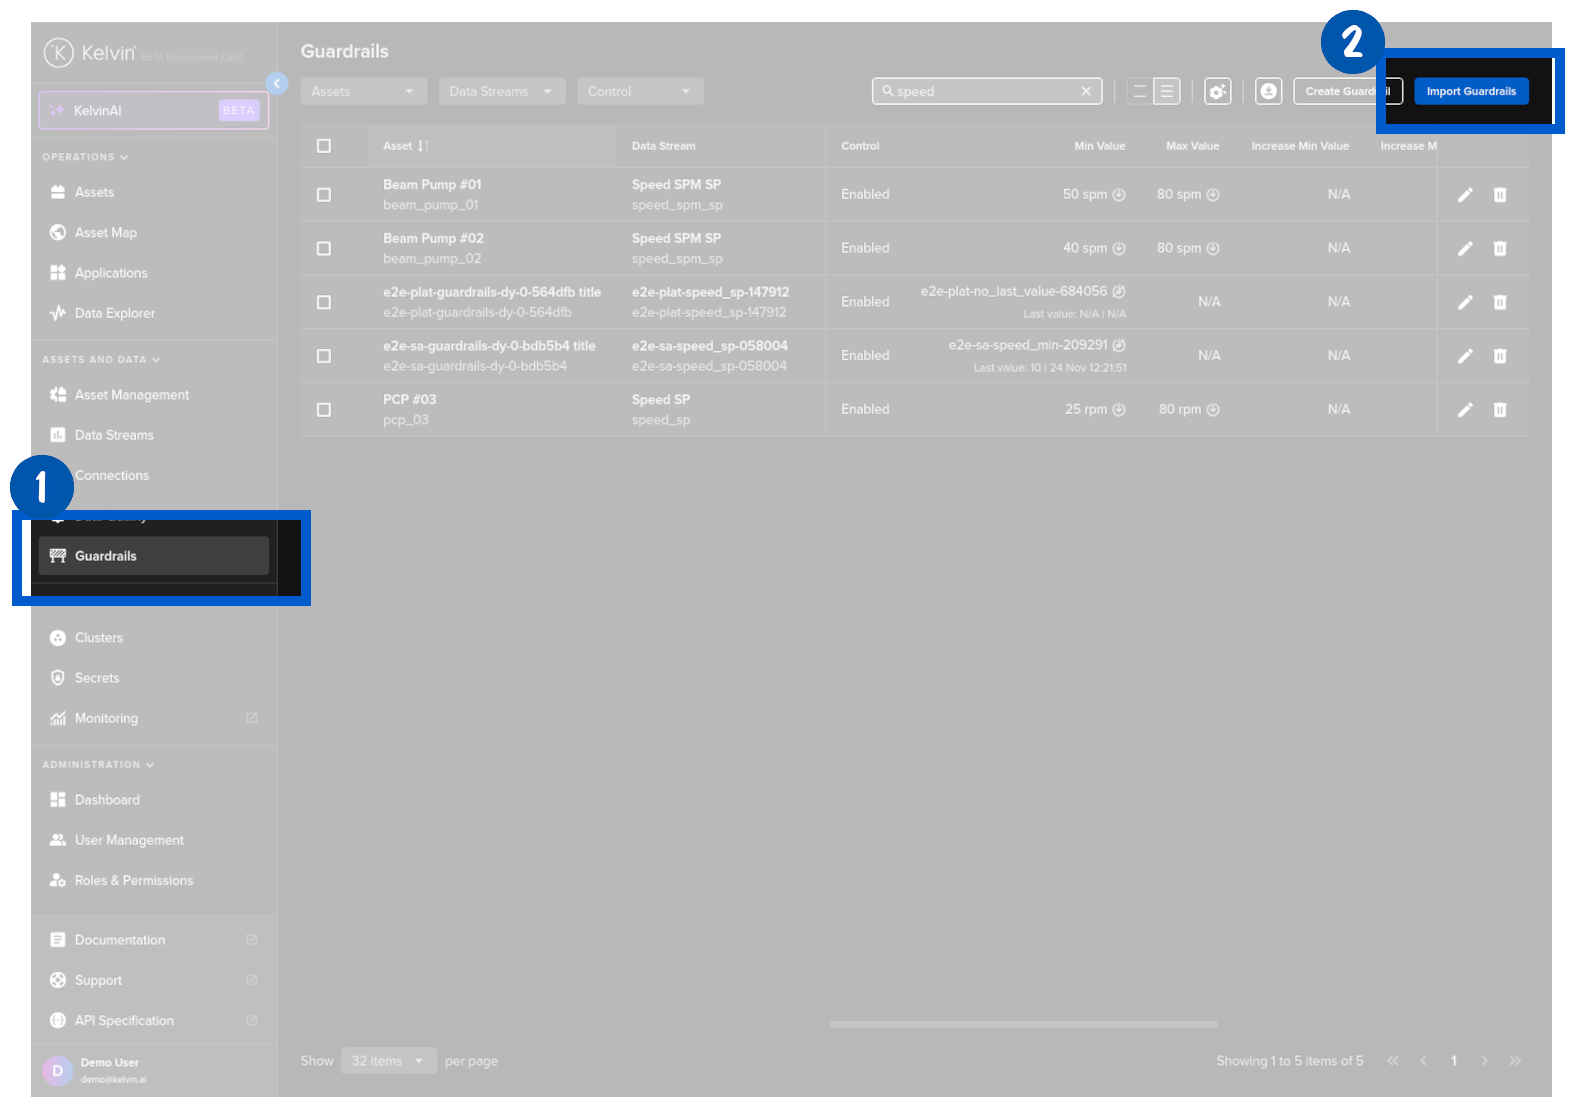
The Guardrails Dashboard
The Guardrails dashboard lists all configured guardrails across your assets.
📸 Screenshot: Guardrails dashboard — from the Guardrails page in the Kelvin UI
Each row shows:
| Column | Description |
|---|---|
| Asset | The asset name and its system identifier |
| Data Stream | The data stream the guardrail applies to |
| Control | Enabled or Disabled |
| Min Value | The minimum absolute value allowed |
| Max Value | The maximum absolute value allowed |
| Increase Min/Max Value | The minimum and maximum allowed increase per change |
| Decrease Min/Max Value | The minimum and maximum allowed decrease per change |
You can filter by Assets, Data Streams, and Control status using the dropdowns at the top. You can also search by name.
To edit a guardrail, click the pencil icon on its row. To delete, click the bin icon.
Creating a Guardrail
Single guardrail
Go to Guardrails in the left sidebar. Click Create Guardrail.
Step 1: Select the Asset / Data Stream pair
Choose the Asset. The Data Stream dropdown will show only the data streams already linked to that asset in Connections.
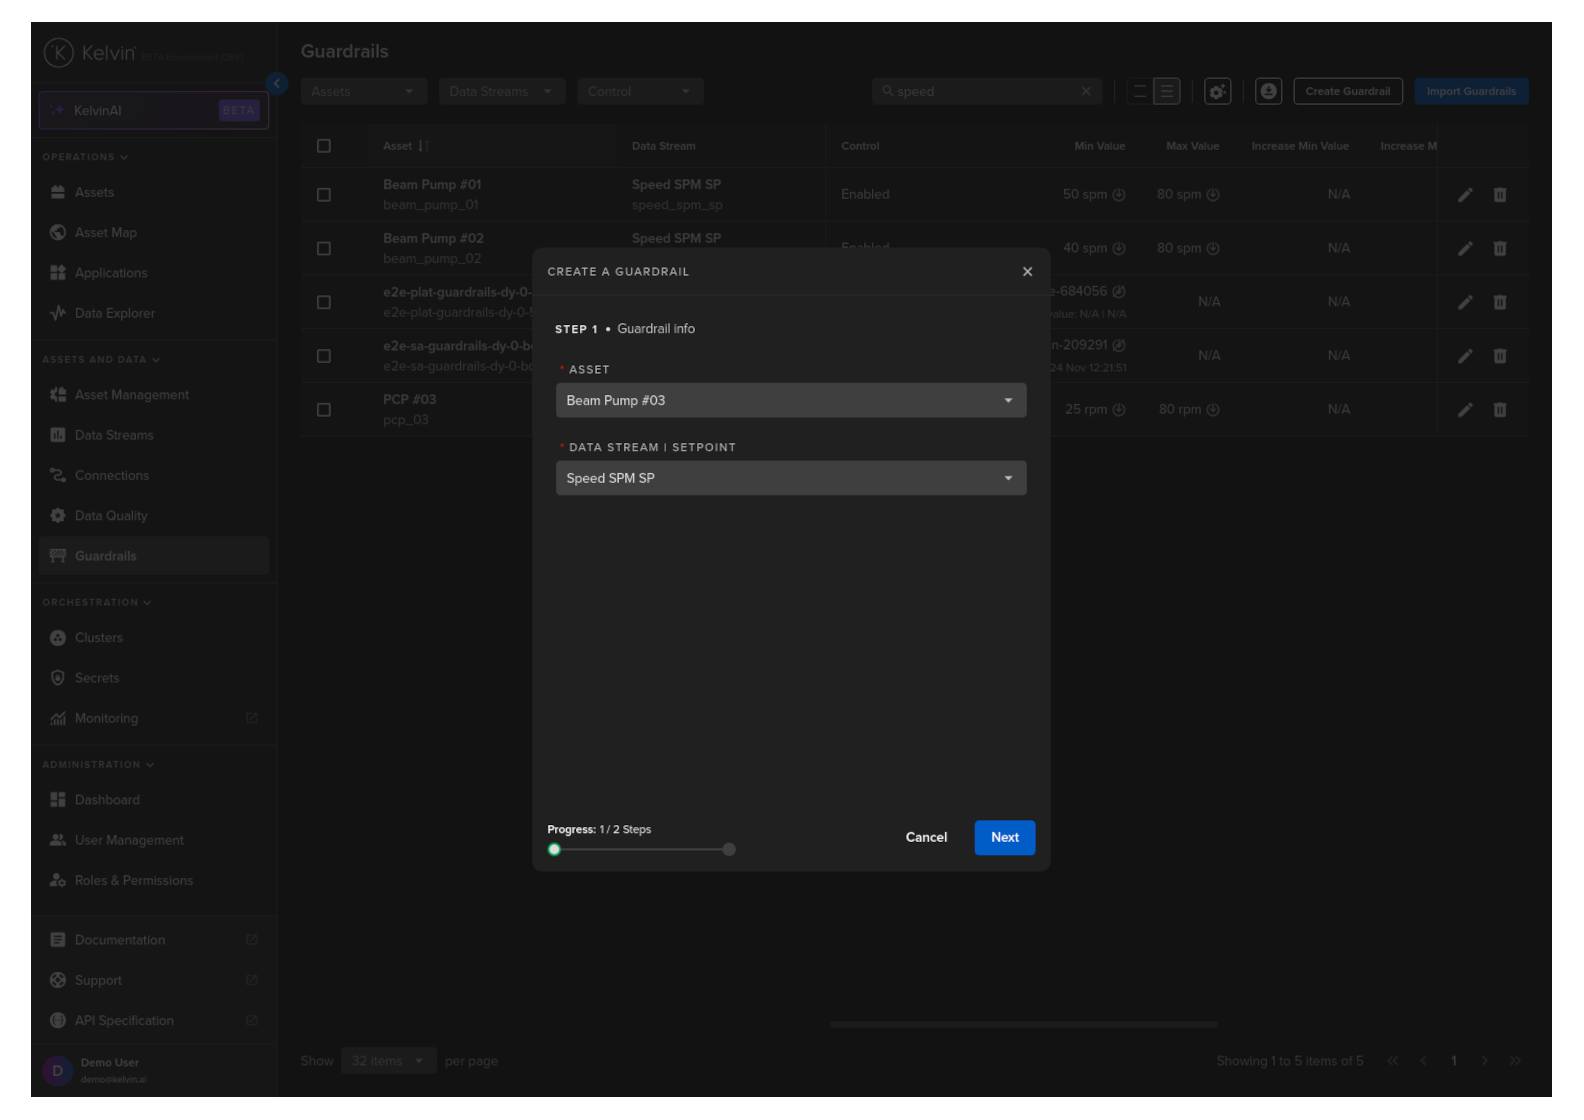
Click Next.
Step 2: Set the rules
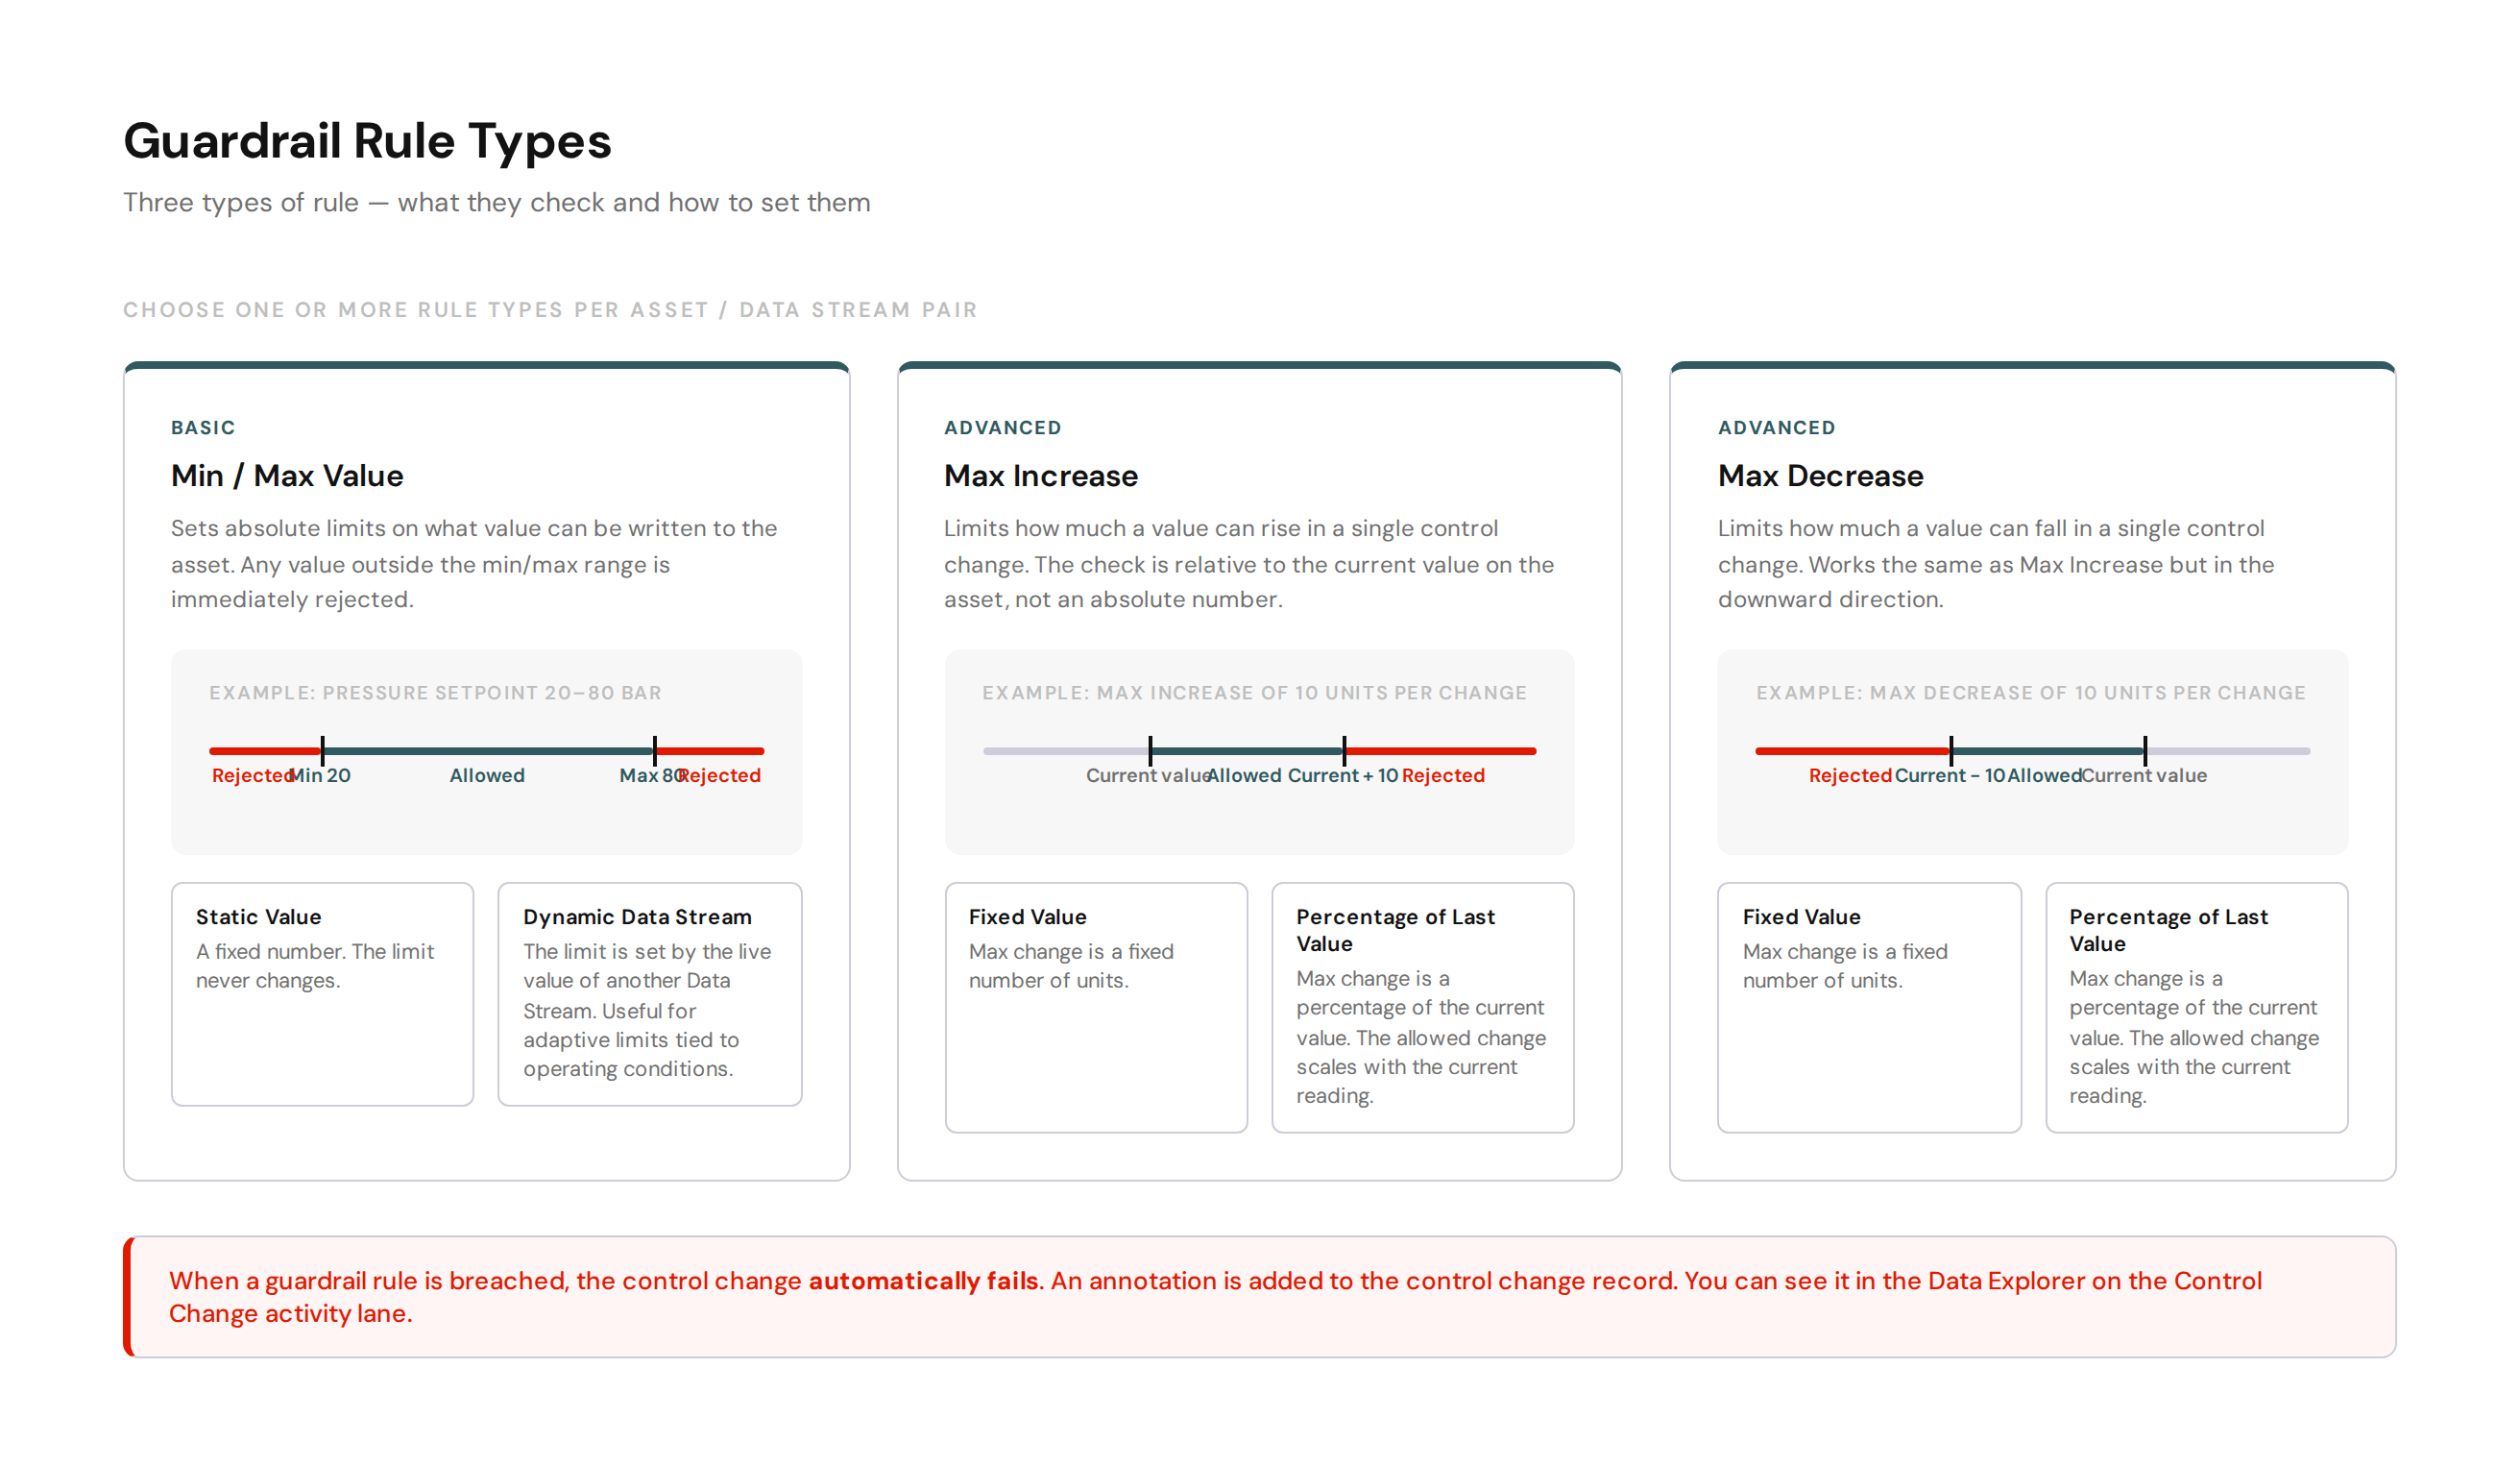
There are three sections in Step 2.
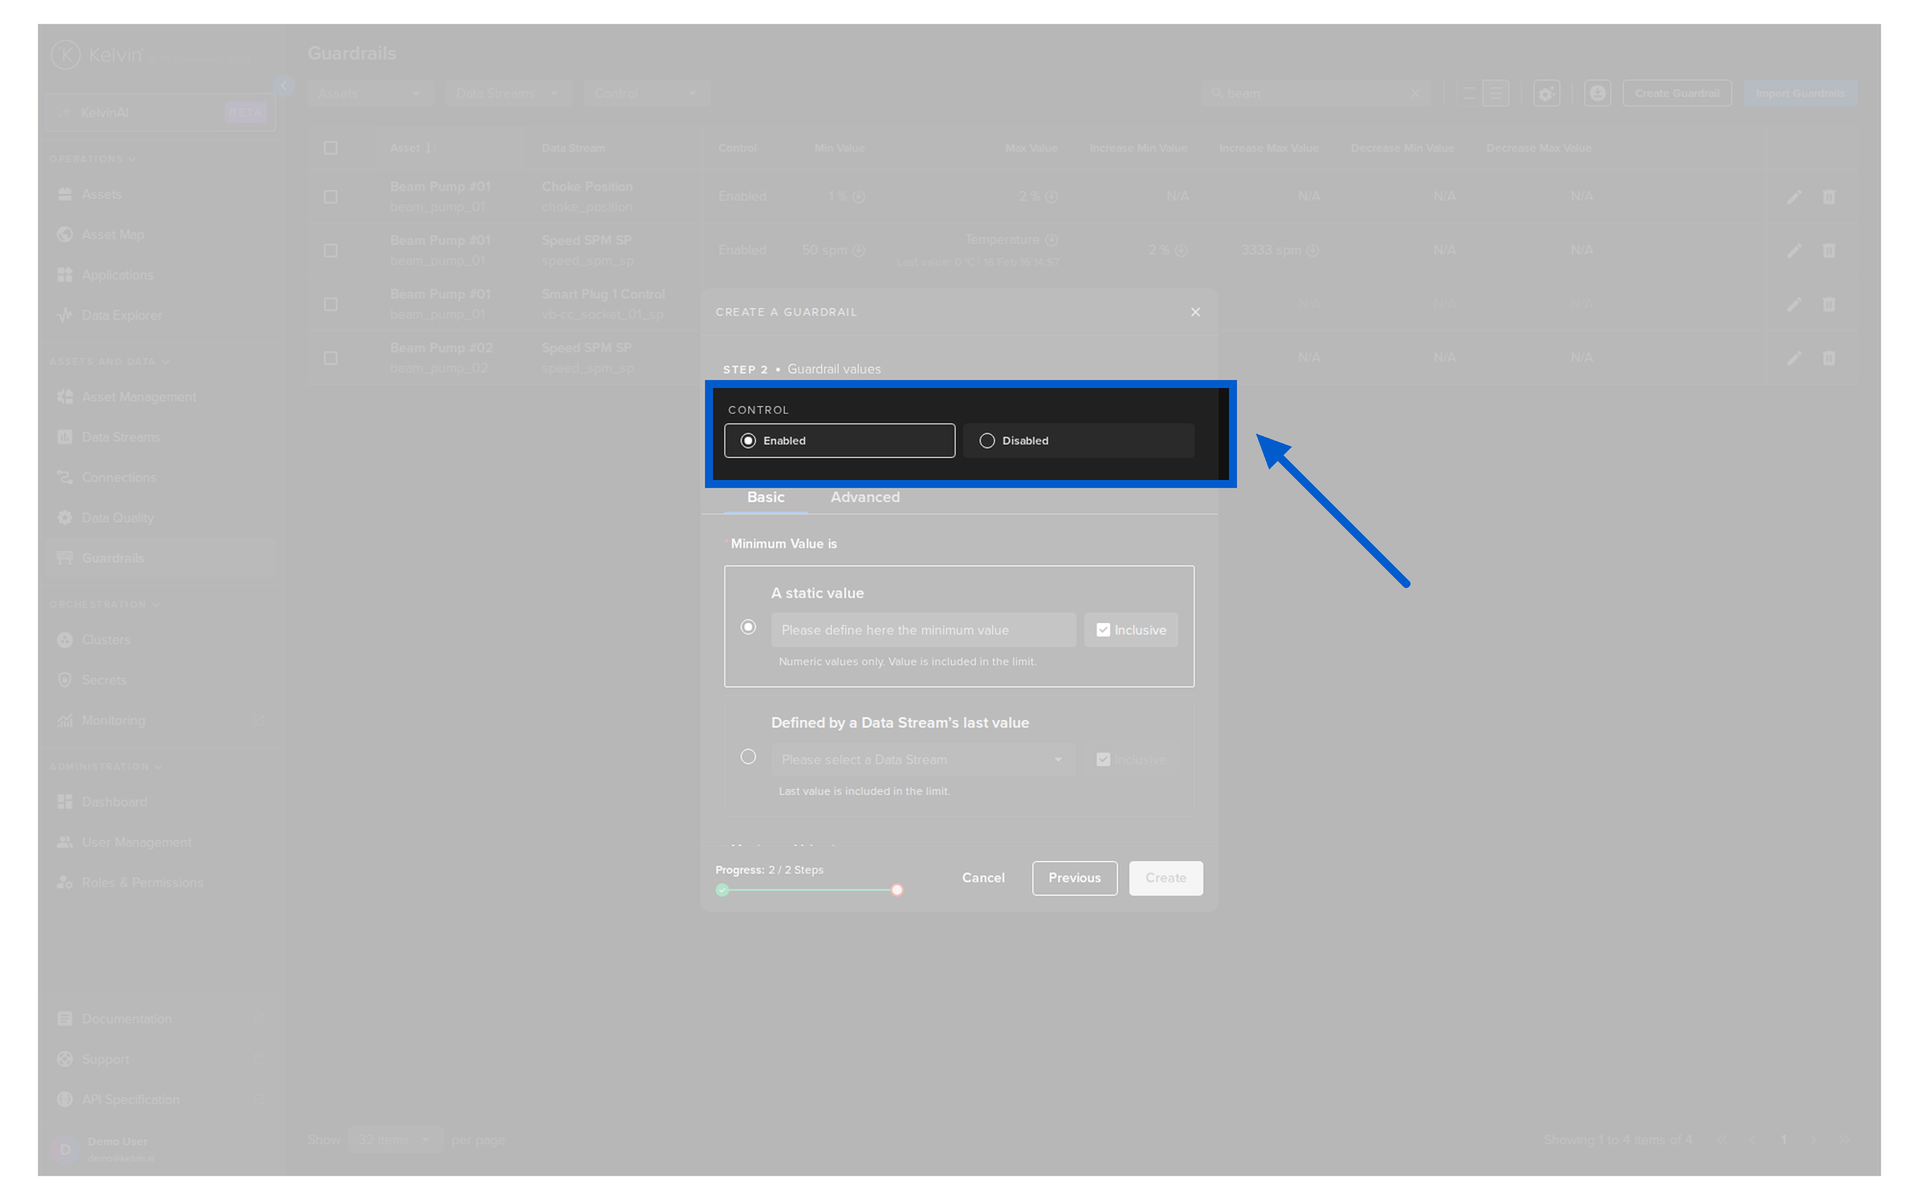
Control
Enable the guardrail immediately, or leave it disabled and enable it later.
Basic — Min / Max Values
Set the absolute minimum and maximum values allowed for this data stream.
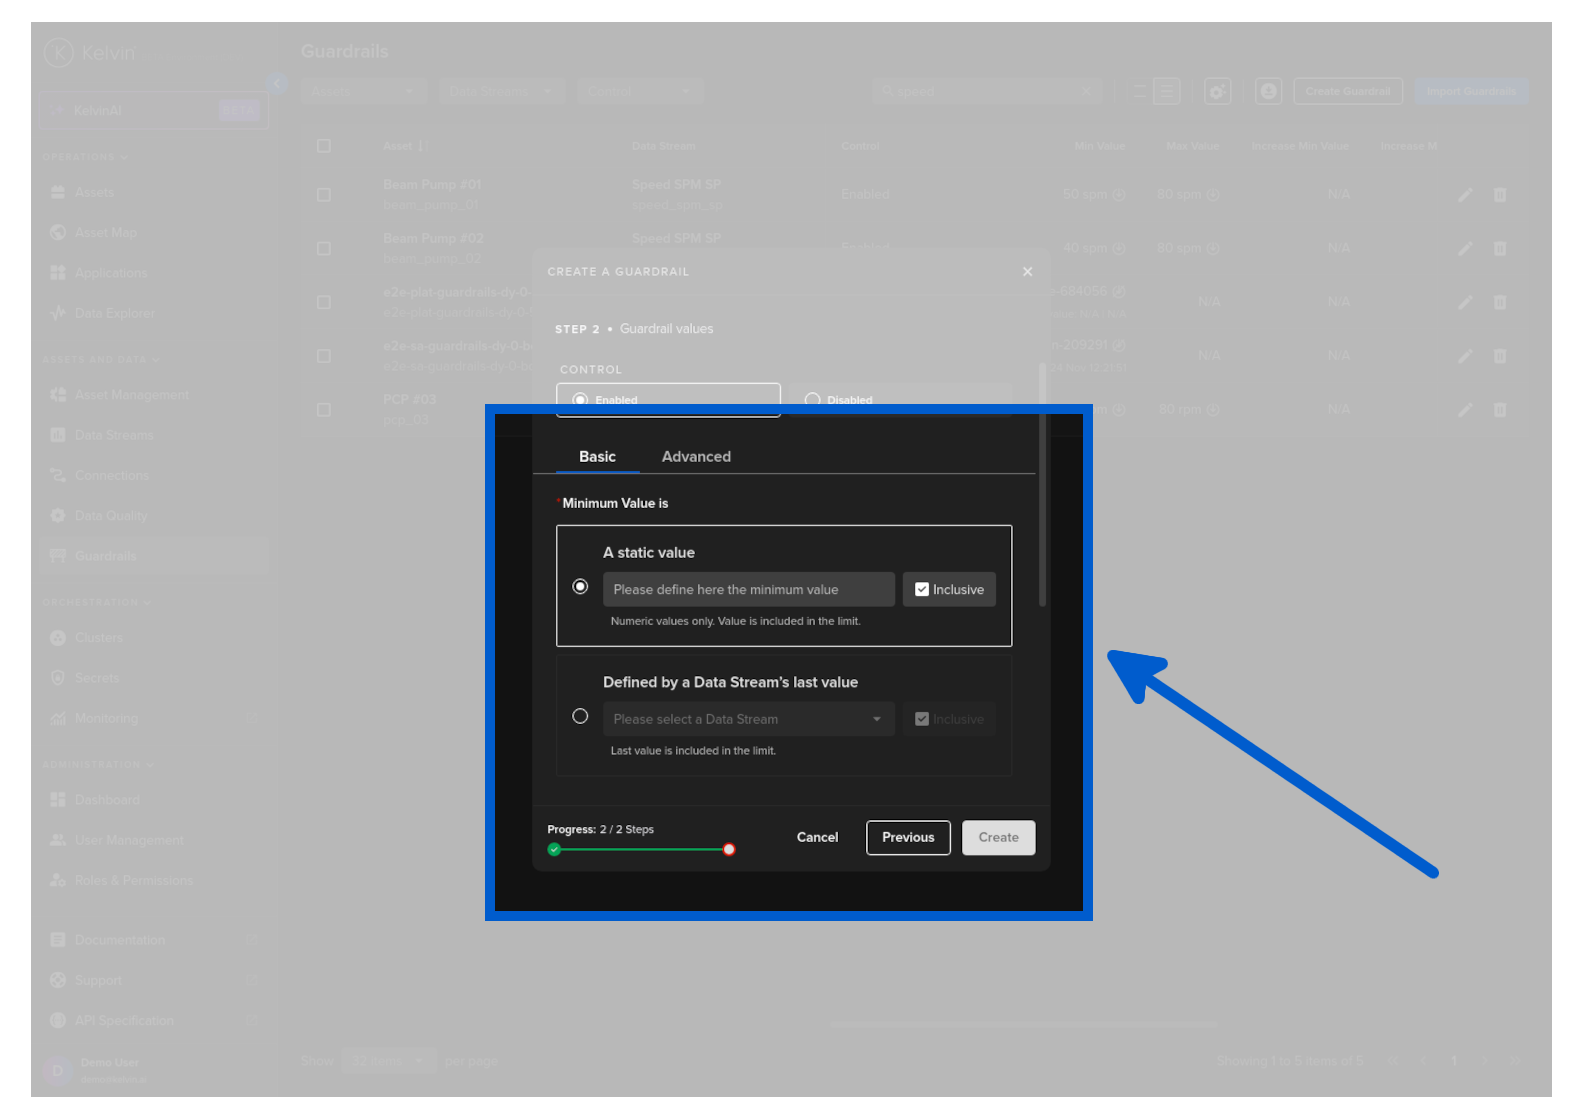
For each limit you can choose:
| Option | Description |
|---|---|
| Static Value | A fixed number that never changes |
| Data Stream | The limit is set by the live value of another Asset / Data Stream pair. The guardrail adjusts dynamically as that value changes. |
Pro Tip
Dynamic Data Stream thresholds are powerful for assets that operate at different conditions. For example, if your maximum safe pressure setpoint depends on the current temperature reading, you can point the guardrail max at the temperature-derived limit stream instead of a fixed number.
Advanced — Increase / Decrease Max Values
Set the maximum allowed change in a single control write, both up and down.
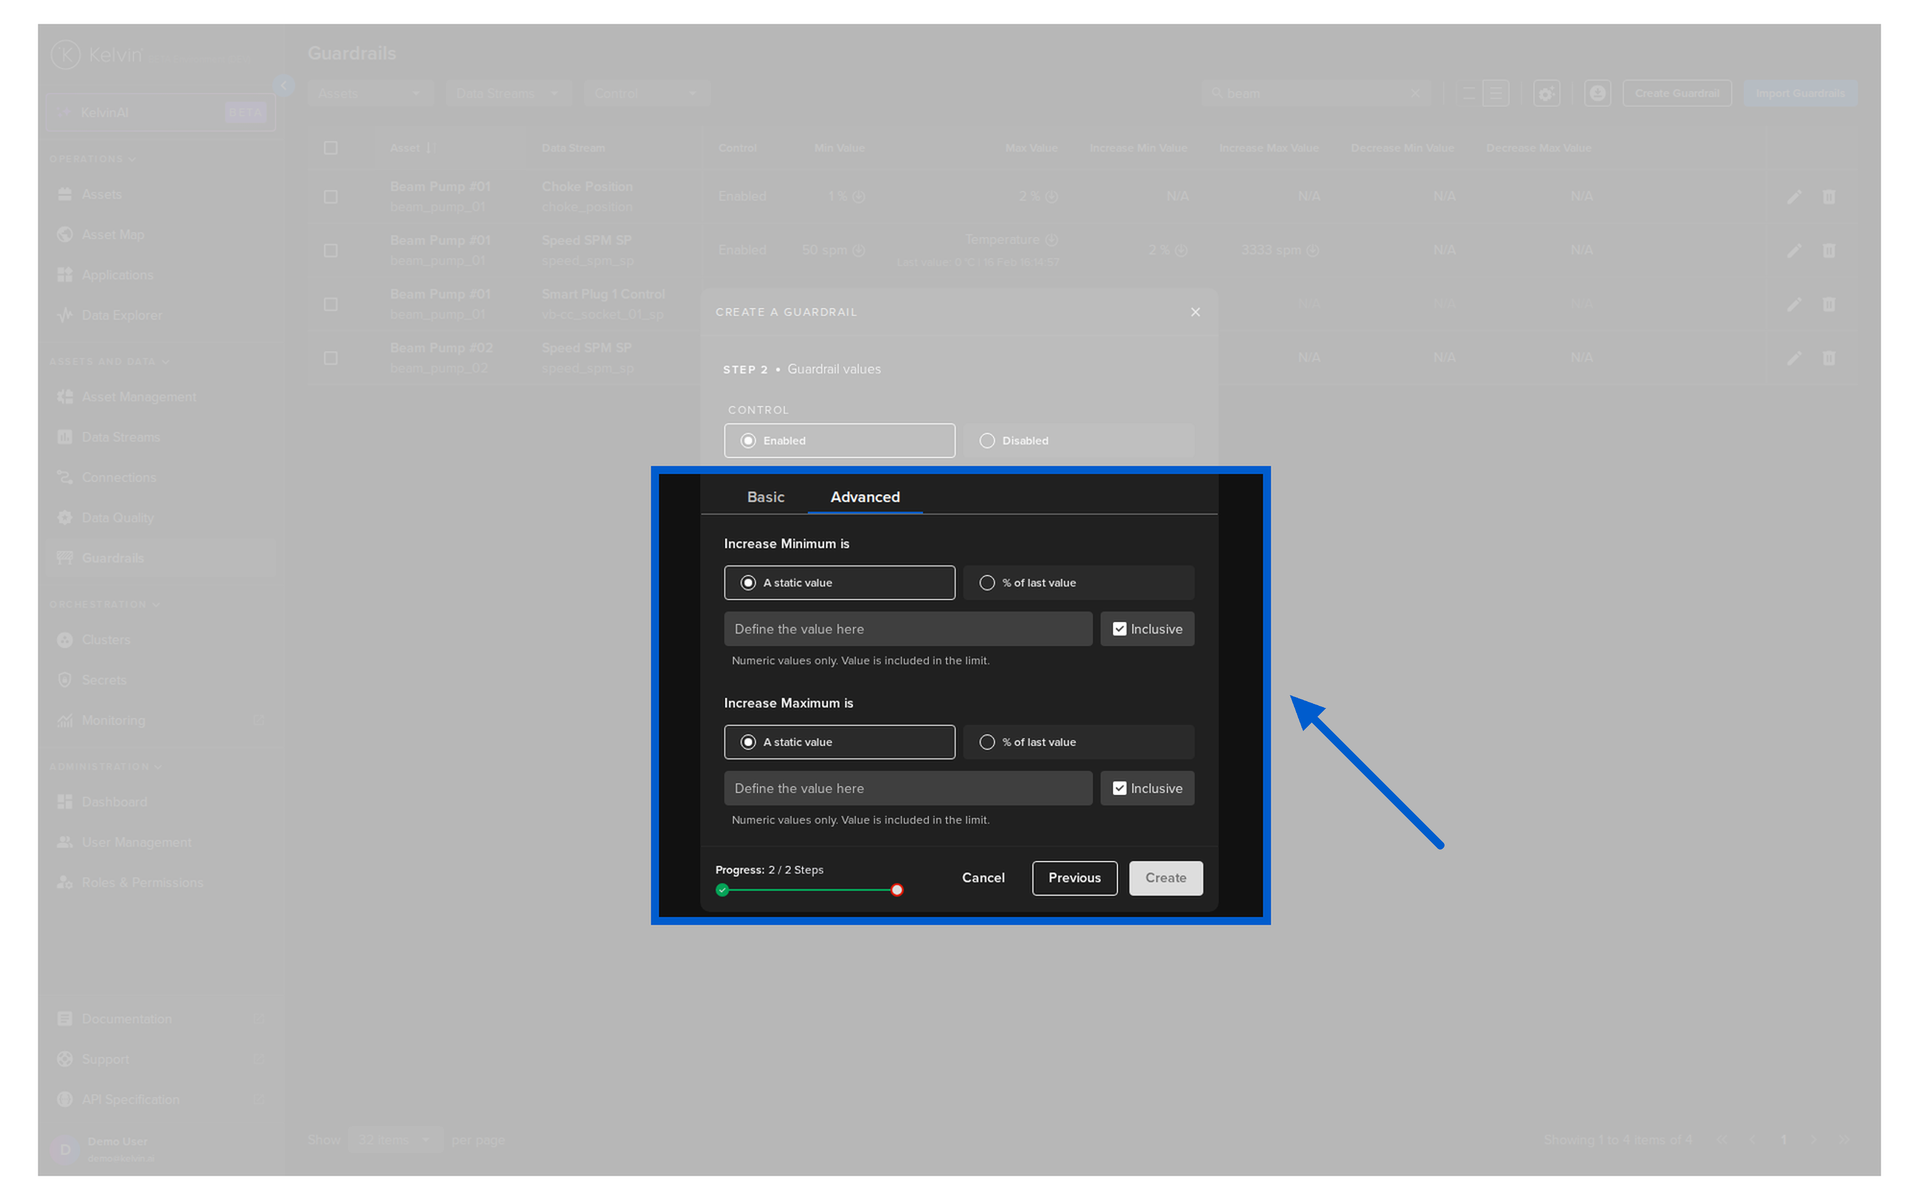
For each limit you can choose:
| Option | Description |
|---|---|
| Static Value | A fixed number of units change allowed per write |
| % of Last Value | The allowed change is a percentage of the current value on the asset |
Warning
You do not need to fill in all three sections. Only configure the rules that apply to this data stream. Unfilled sections will not be enforced.
Click Create when done.
Bulk import
If you have many guardrails to set up, use the CSV import instead.
Go to Guardrails in the left sidebar. Click Import Guardrails.

Step 1: Upload your CSV file
Drag and drop your CSV file onto the upload area. You can download the template directly from this screen to use as a reference.
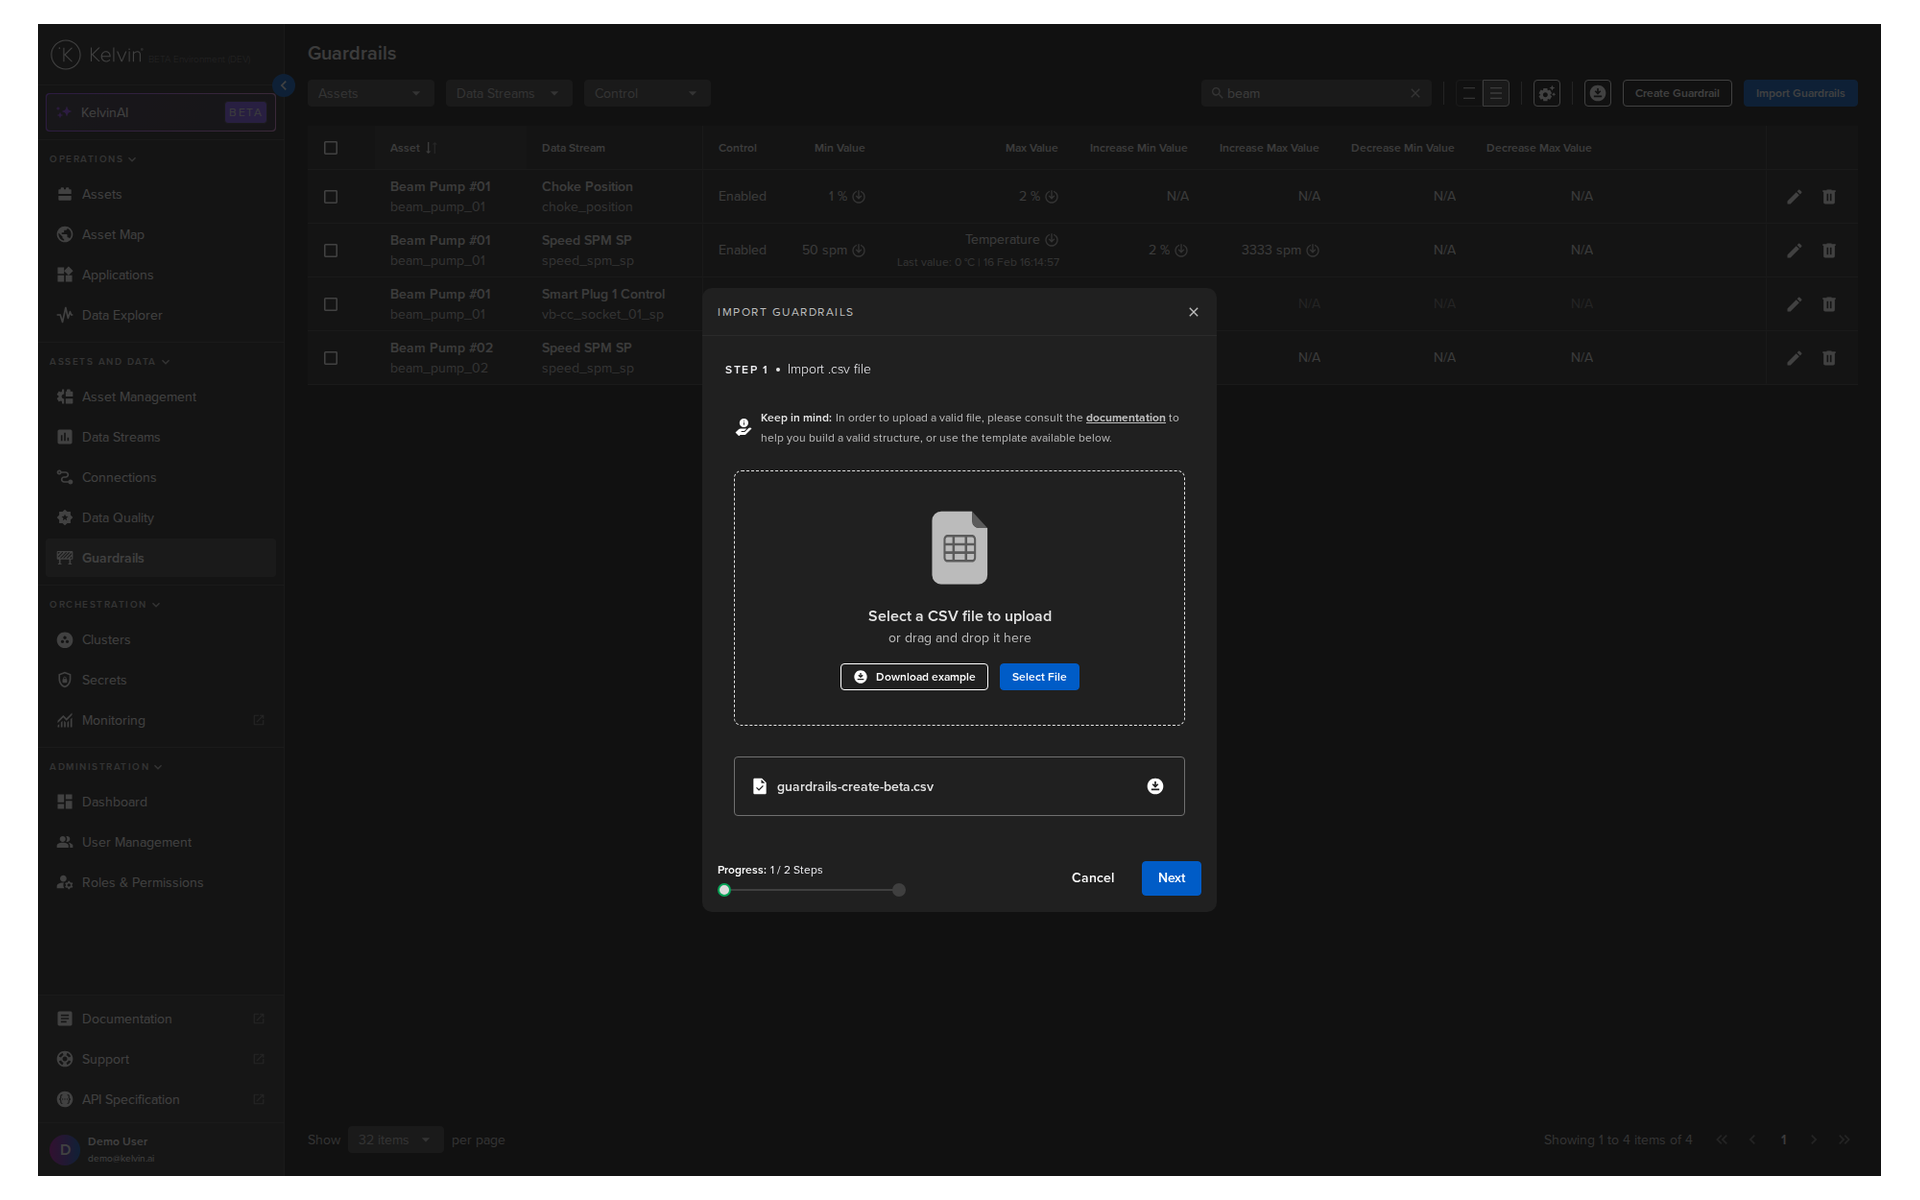
Click Next.
Step 2: Validate and import
The platform validates your file and highlights any errors. Fix any flagged rows before proceeding.
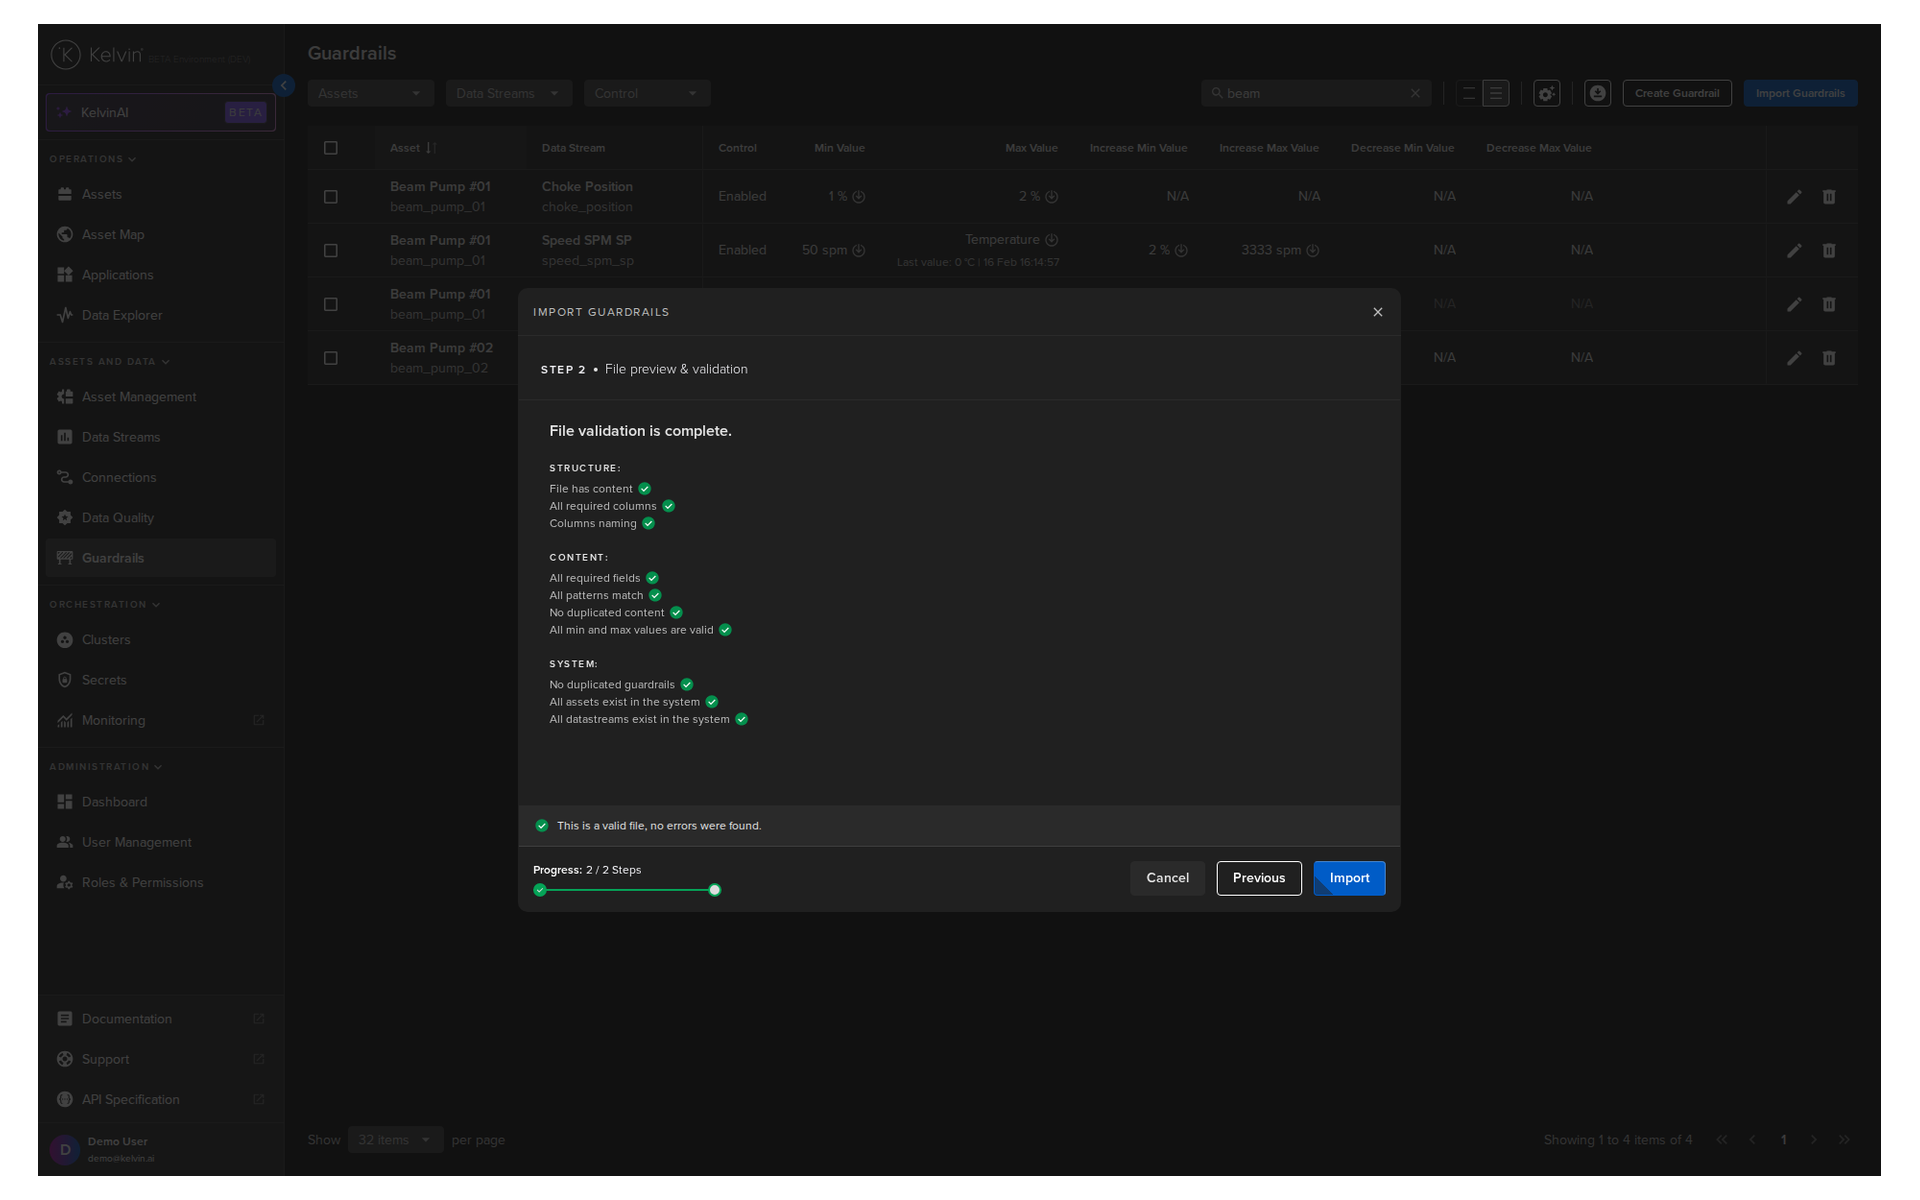
When all rows are valid, click Import. All guardrails in the file are created in one step.
The CSV columns are:
| Column | Example | Description |
|---|---|---|
| Asset | plunger-lift-01 |
Asset name |
| Data Stream | tubing_pressure |
Data stream name |
| Control | true / false |
Whether the guardrail is enabled |
| Minimum Value | 20 or min_sp |
Min absolute value or Data Stream name |
| Minimum Value Type | number / datastream |
Whether the min is a fixed value or a data stream |
| Minimum Value Included | true / false |
Whether the min is inclusive |
| Maximum Value | 80 or max_sp |
Max absolute value or Data Stream name |
| Maximum Value Type | number / datastream |
Whether the max is a fixed value or a data stream |
| Maximum Value Included | true / false |
Whether the max is inclusive |
| Relative Increase Min/Max Value | 5 |
Max allowed increase per change |
| Relative Increase Min/Max Value Type | number / percentage |
Fixed value or percentage |
| Relative Decrease Min/Max Value | 5 |
Max allowed decrease per change |
| Relative Decrease Min/Max Value Type | number / percentage |
Fixed value or percentage |
Pro Tip
Download the sample template from the Import screen — it includes example data in every column. Use it as a starting point and replace the example rows with your real asset and data stream names.
Quick Reference
| I want to... | How |
|---|---|
| Enable Data Quality checks on an asset | Data Quality → Configuration → Configure Data Quality |
| See data health across all assets | Data Quality → Dashboard |
| Drill into one asset's data quality | Dashboard → click analytics icon on the asset row |
| Create a guardrail for one asset | Guardrails → Create Guardrail |
| Create guardrails for many assets at once | Guardrails → Import Guardrails → upload CSV |
| Edit an existing guardrail | Guardrails dashboard → pencil icon on the row |
| Temporarily disable a guardrail | Guardrails dashboard → pencil icon → set Control to Disabled |
| See why a control change was rejected | Data Explorer → Control Change activity lane → hover over the event |
Quick Quiz
Quiz 1: What is the difference between Data Quality and Guardrails?
Answer: Data Quality monitors data coming in from your assets and reports problems — it never blocks anything. Guardrails protect data going out to your assets and actively reject control changes that break configured rules. Data Quality is a monitoring tool. Guardrails is a safety interlock.
Quiz 2: A sensor on one of your assets is sending the same value every reading for several hours. Which Data Quality metric would detect this?
Answer: Duplication Detection (kelvin_duplicate_detection). It checks recent messages within a configurable window and flags repeated identical values, which can indicate a stuck sensor or connection issue.
Quiz 3: You want to prevent a SmartApp from ever setting a pump speed above 1500 RPM. What type of guardrail rule do you create?
Answer: A Min / Max Value guardrail on the pump speed data stream, with Max Value set to 1500. Any control change that tries to write a value above 1500 will be automatically rejected, regardless of whether it comes from a SmartApp, the UI, or the API.
Quiz 4: What happens to a physical asset when a guardrail rule is breached?
Answer: Nothing changes on the asset. The control change automatically fails before the value reaches the asset. The original value remains in place. An annotation is added to the control change record, which you can see in the Data Explorer on the Control Change activity lane.
Quiz 5: You are configuring Data Quality for 300 assets that all have the same data streams. What is the fastest method?
Answer: Use the CSV file option in the Configure Data Quality popup. Download the template, fill in all 300 rows in Excel or Google Sheets, and upload the completed file. The platform validates it and applies all configurations at once. Alternatively, selecting by Asset Type auto-selects all assets of that type and lets you apply the same metric settings to all of them in one step.
Quiz 6: What is the Data Quality Status score and what does it mean?
Answer: The Data Quality Status is a percentage score calculated every 5 minutes for each asset, based on all enabled metrics. A score above 85% means Healthy Data. A score below 85% means Bad Data. The 85% threshold is the default and can be adjusted via the API.
Quiz 7: You want to prevent a setpoint from being raised by more than 10% of its current value in a single change. Which guardrail rule type do you use, and what option do you select for the threshold?
Answer: Use the Advanced — Max Increase rule, and set the threshold type to % of Last Value with a value of 10. This means the guardrail calculates the allowed increase dynamically based on the current value on the asset, rather than using a fixed number.
Summary
Data Quality and Guardrails are two complementary tools for keeping your data trustworthy.
The key things to remember:
- Data Quality monitors incoming data from assets. It runs five built-in checks at the edge in real time: Data Availability, Range Validation, Outlier Detection, Duplication Detection, and Timestamp Anomaly. It reports — it does not block.
- Guardrails protect outgoing control changes. They are the last check before any value is written to a physical asset. If a rule is breached, the control change fails and the asset is unchanged.
- Data Quality must be configured per Asset / Data Stream pair before any metrics run. Use CSV import for large-scale setup.
- The Data Quality Dashboard shows a health score per asset and lets you drill into individual data streams on a timeseries graph.
- Guardrails support three rule types: Min/Max Value (absolute limits), Max Increase, and Max Decrease. Thresholds can be static values or driven dynamically by another Data Stream.
- Use the CSV bulk import in Guardrails for setting up many assets at once.
- A breached guardrail adds an annotation to the control change record — visible in the Data Explorer.
For full documentation, visit:
- Data Quality Concept
- Guardrail Concept
- Data Quality Configuration
- Data Quality Dashboard
- Guardrails Overview
- Create a Guardrail
- Bulk Create Guardrails
Good luck and Happy Learning !