Cluster Logs & Telemetry
Logs
Viewing Cluster Logs
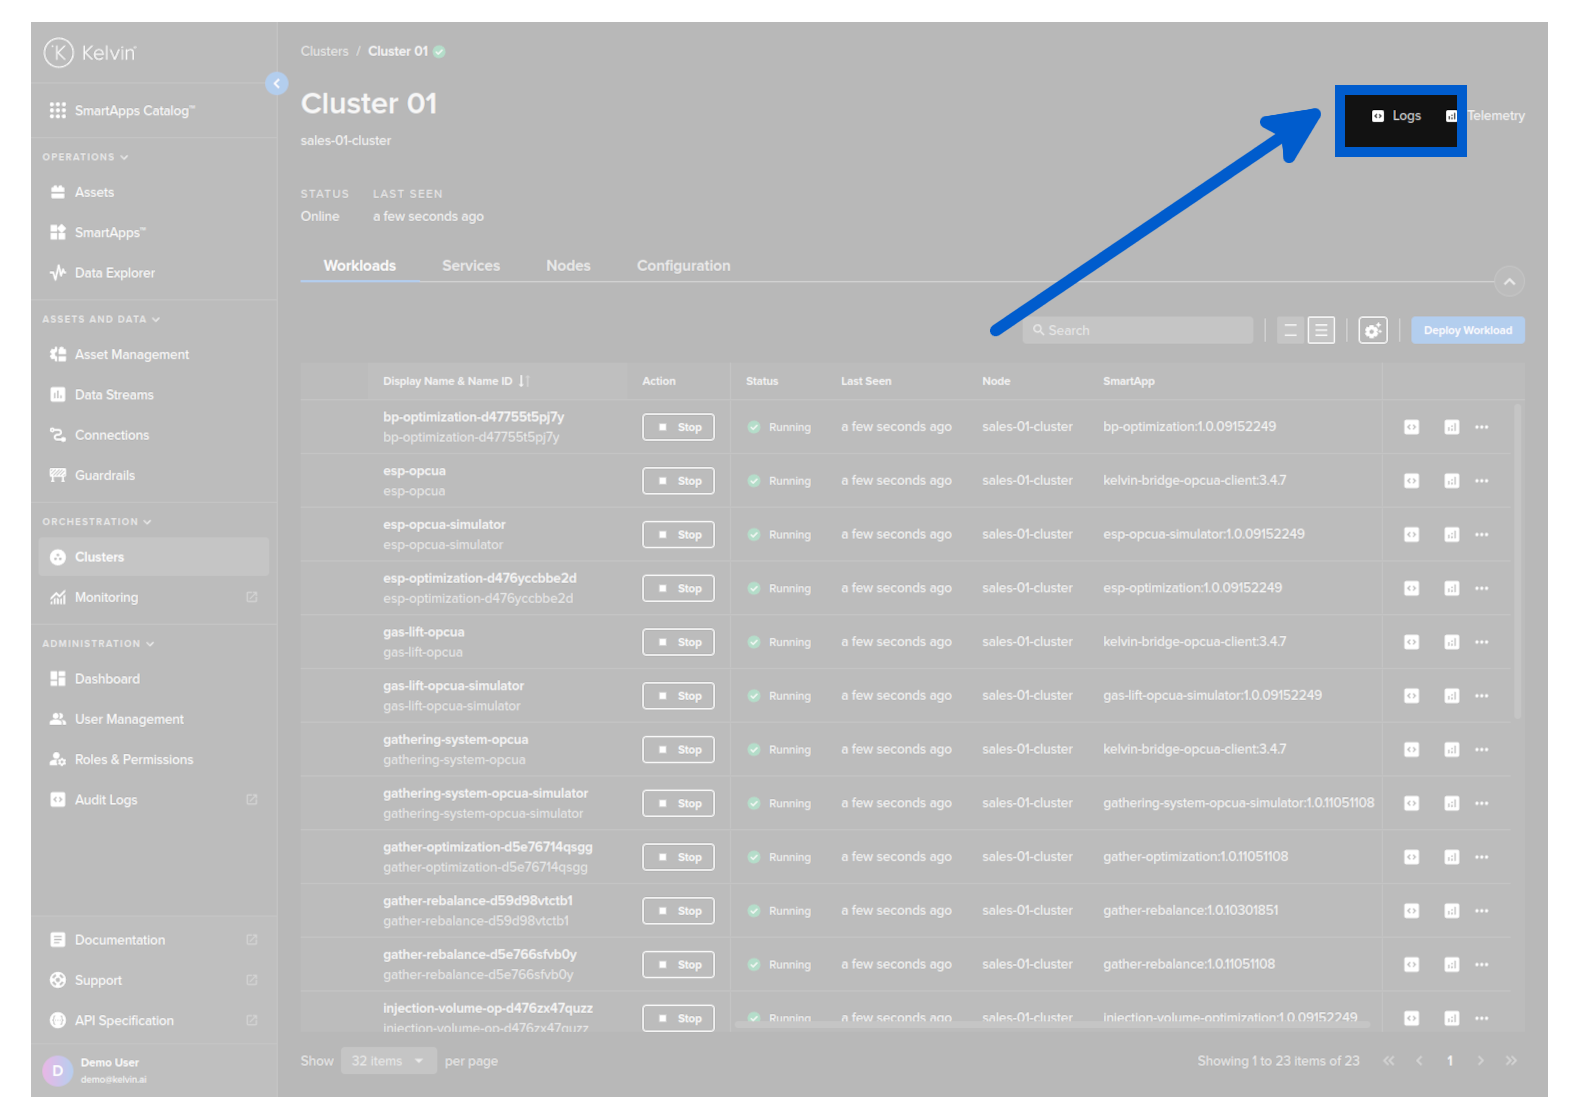
In the Kelvin UI you can view the logs of a Cluster and all the Workloads running on the Cluster.
From Orchestration menu click on a single Cluster, then click on the Logs button in the top right hand corner.
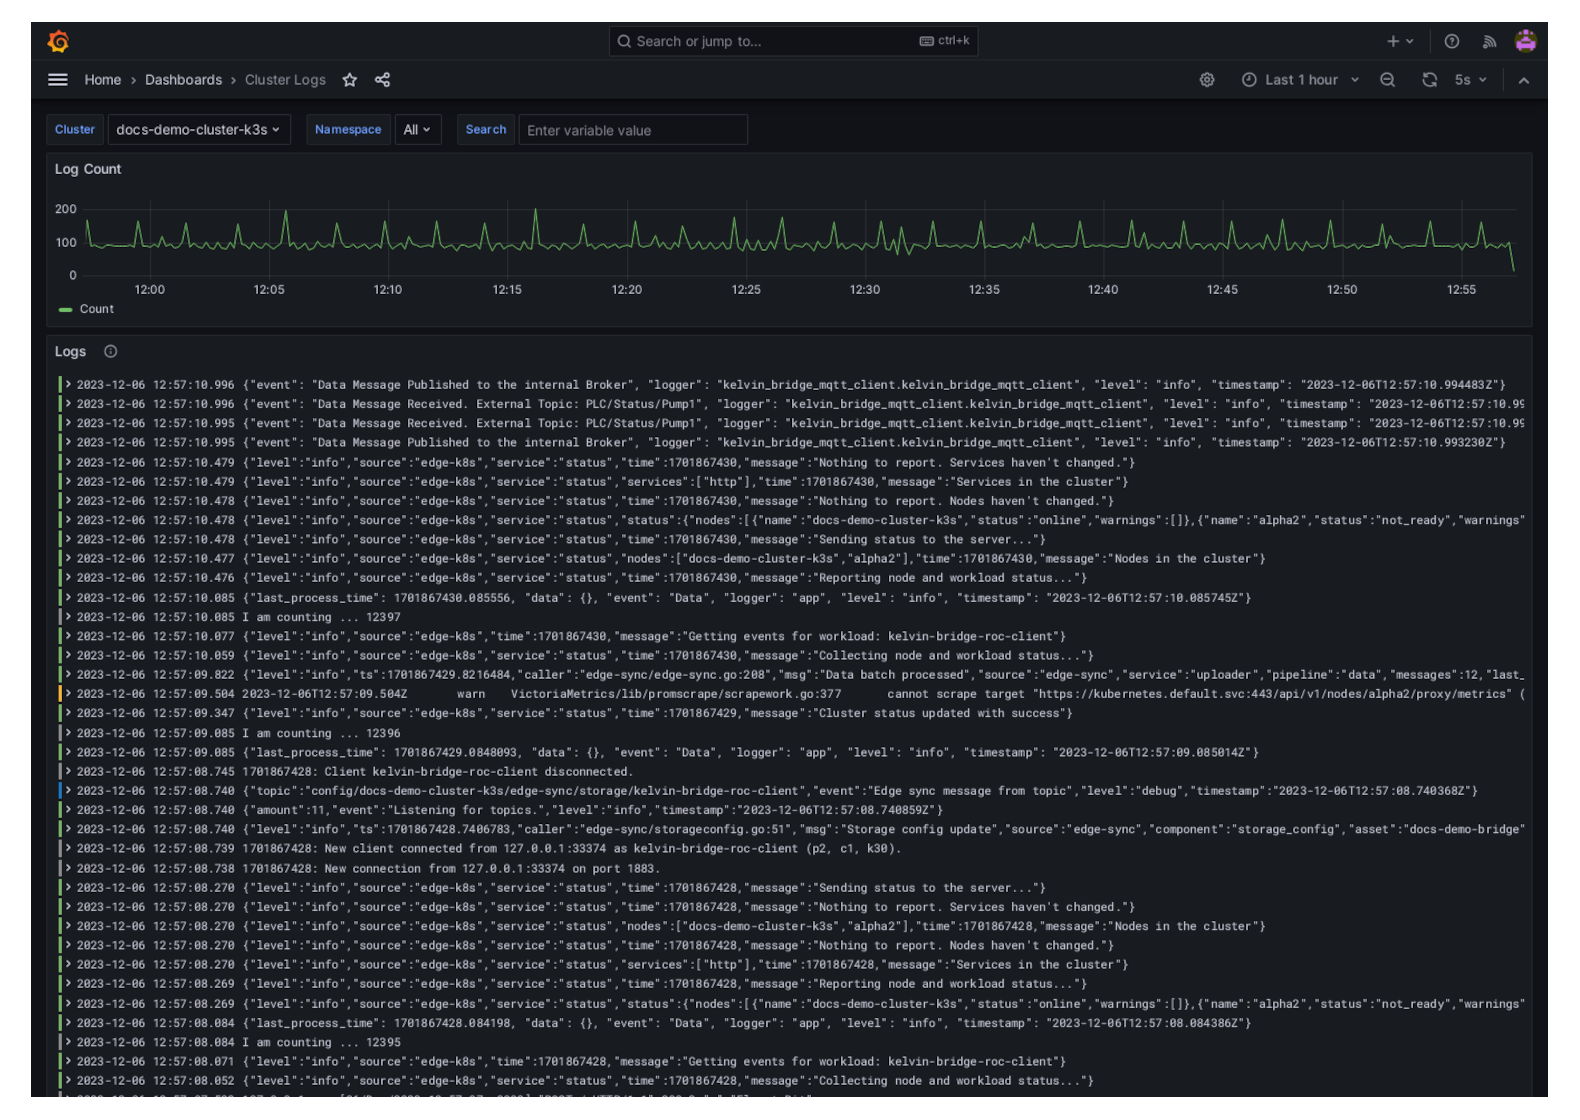
And then you will see the logs being displayed in a Grafana environment.
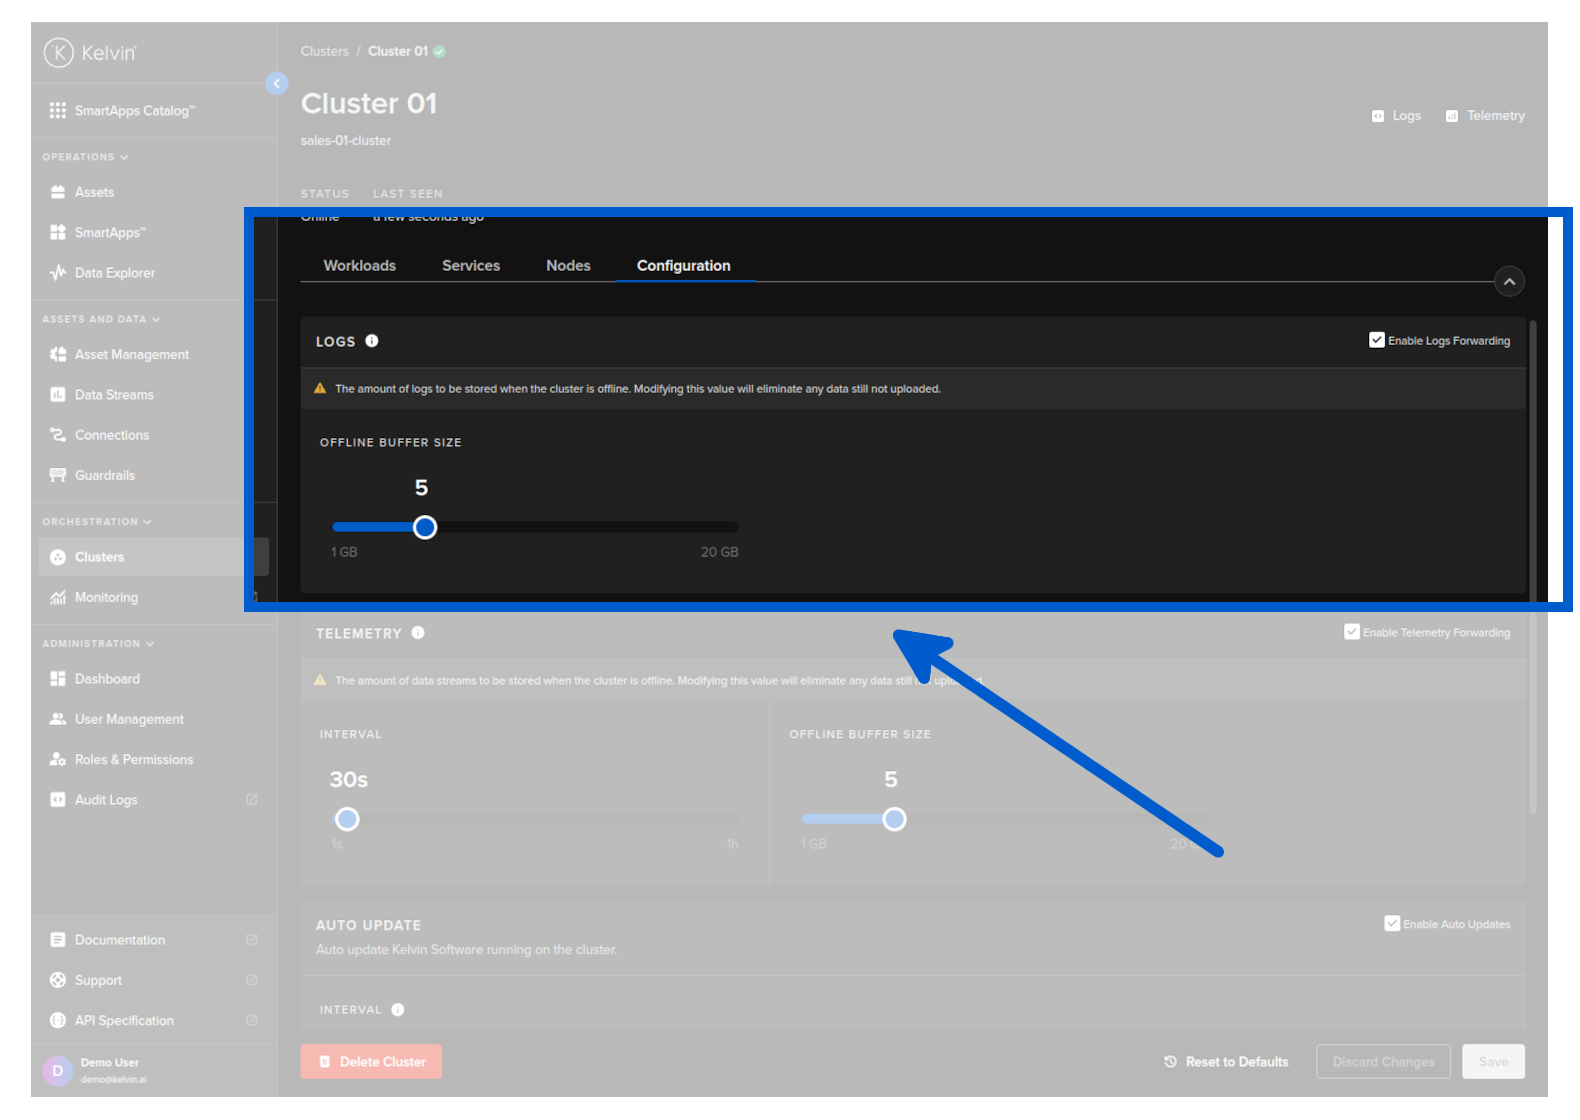
Configuring Cluster Logs
When the cluster is offline, the Clusters will continue to collect and buffer the log data and transmit it to the Kelvin when it reconnects.
From Orchestration menu click on a single Cluster, then under the Configuration tab you can set the size of buffer for recording logs while the cluster is offline or not connected to the Kelvin.
Be careful when changing this setting as this will delete all current logs that are currently in the buffer waiting to be loaded to the Kelvin.
Telemetry
Viewing Cluster Telemetry
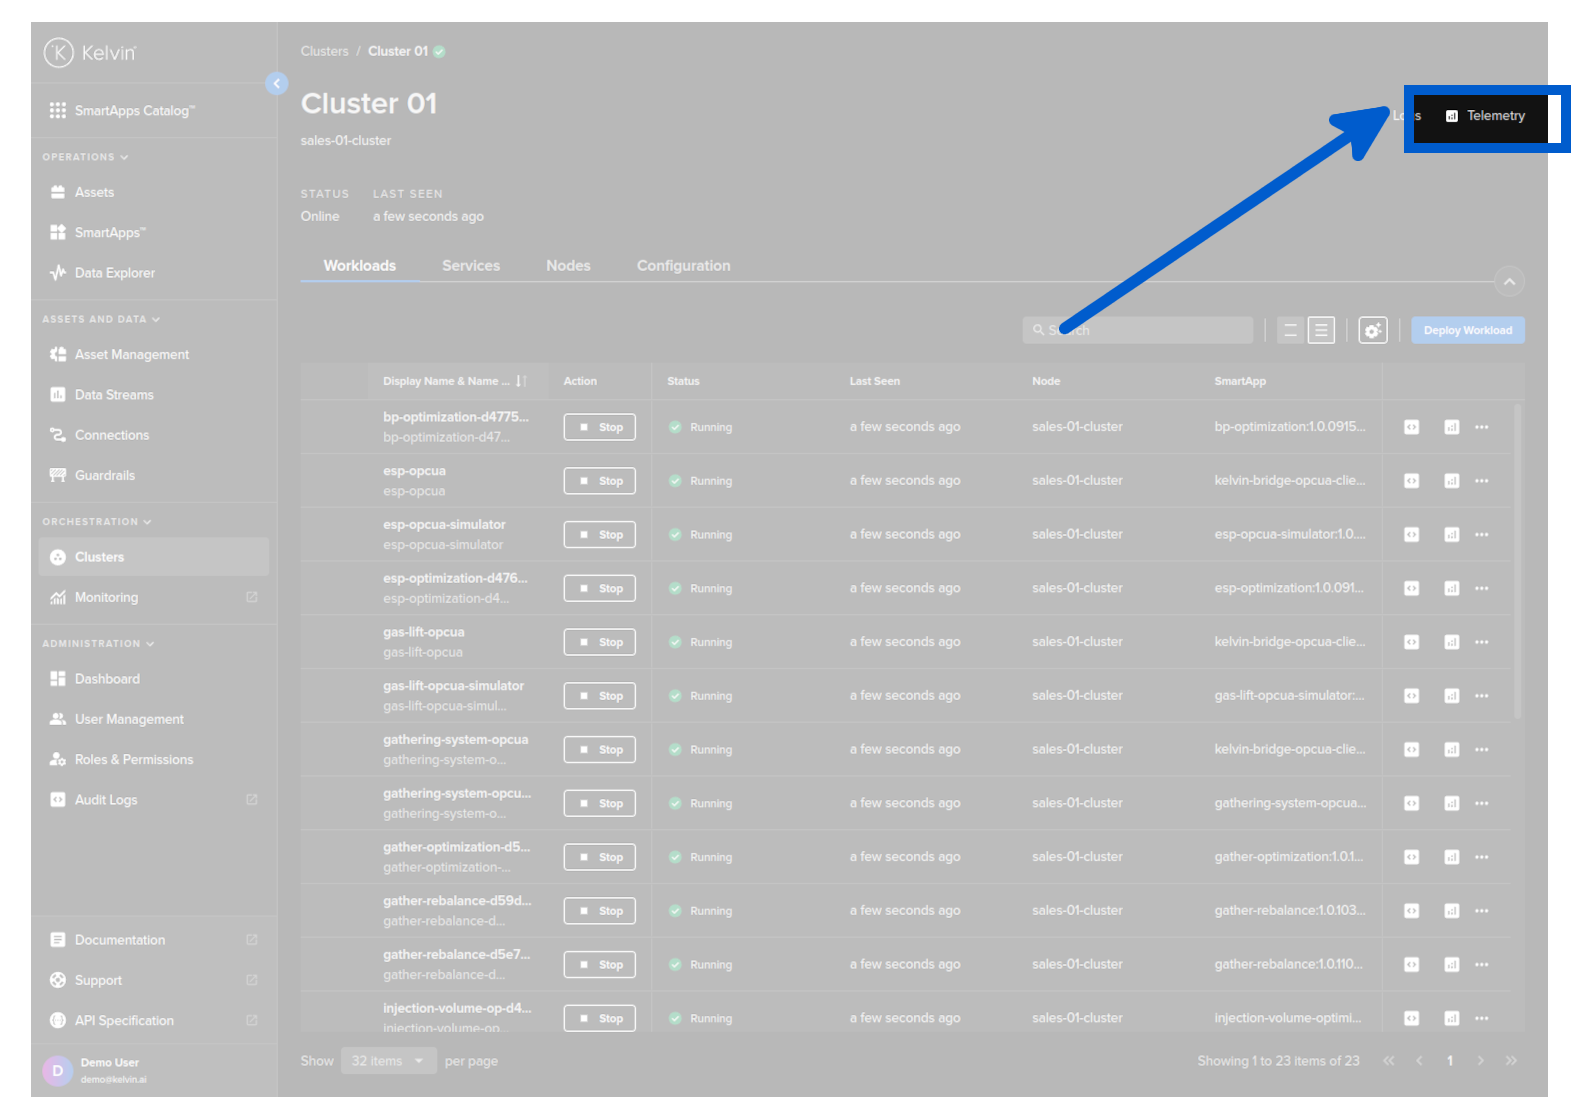
In the Kelvin UI you can view the Telemetry of the Cluster. It will show you the resources used on the hardware or in the case of a Virtual Machine, the resources the VM is using.
From Orchestration menu click on a single Cluster, then click on the Telemetry button in the top right hand corner.
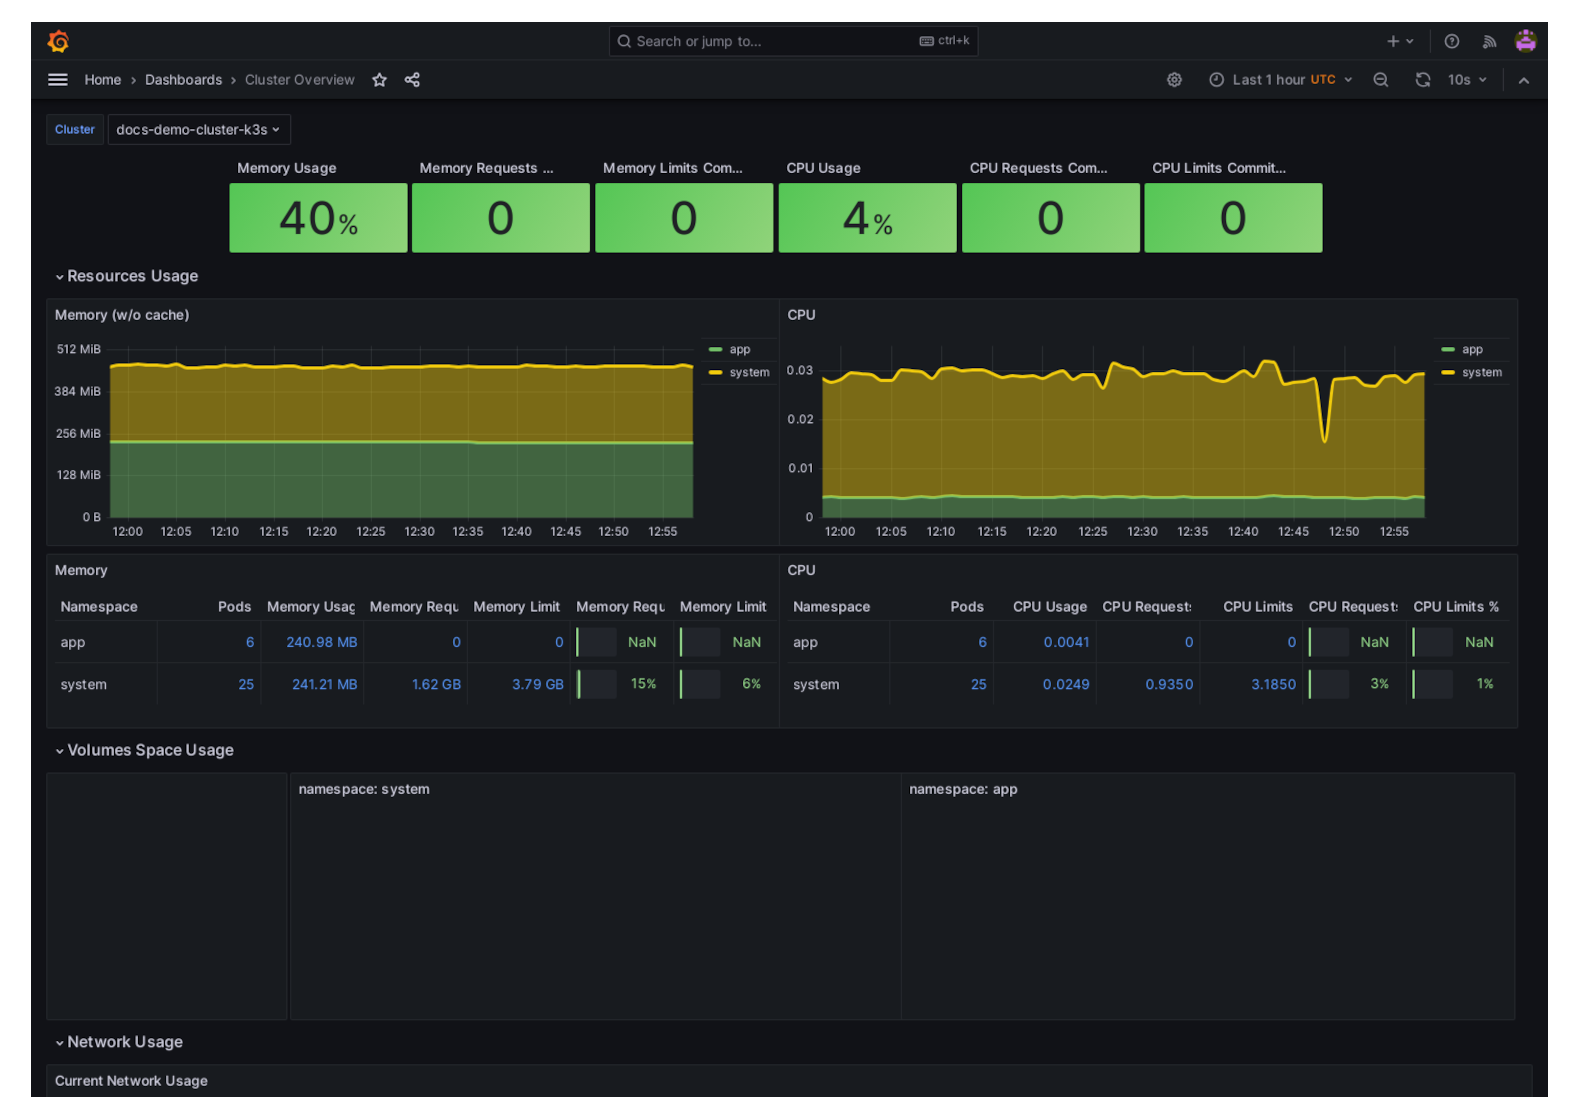
And then you will see the telemetry being displayed in a Grafana environment.
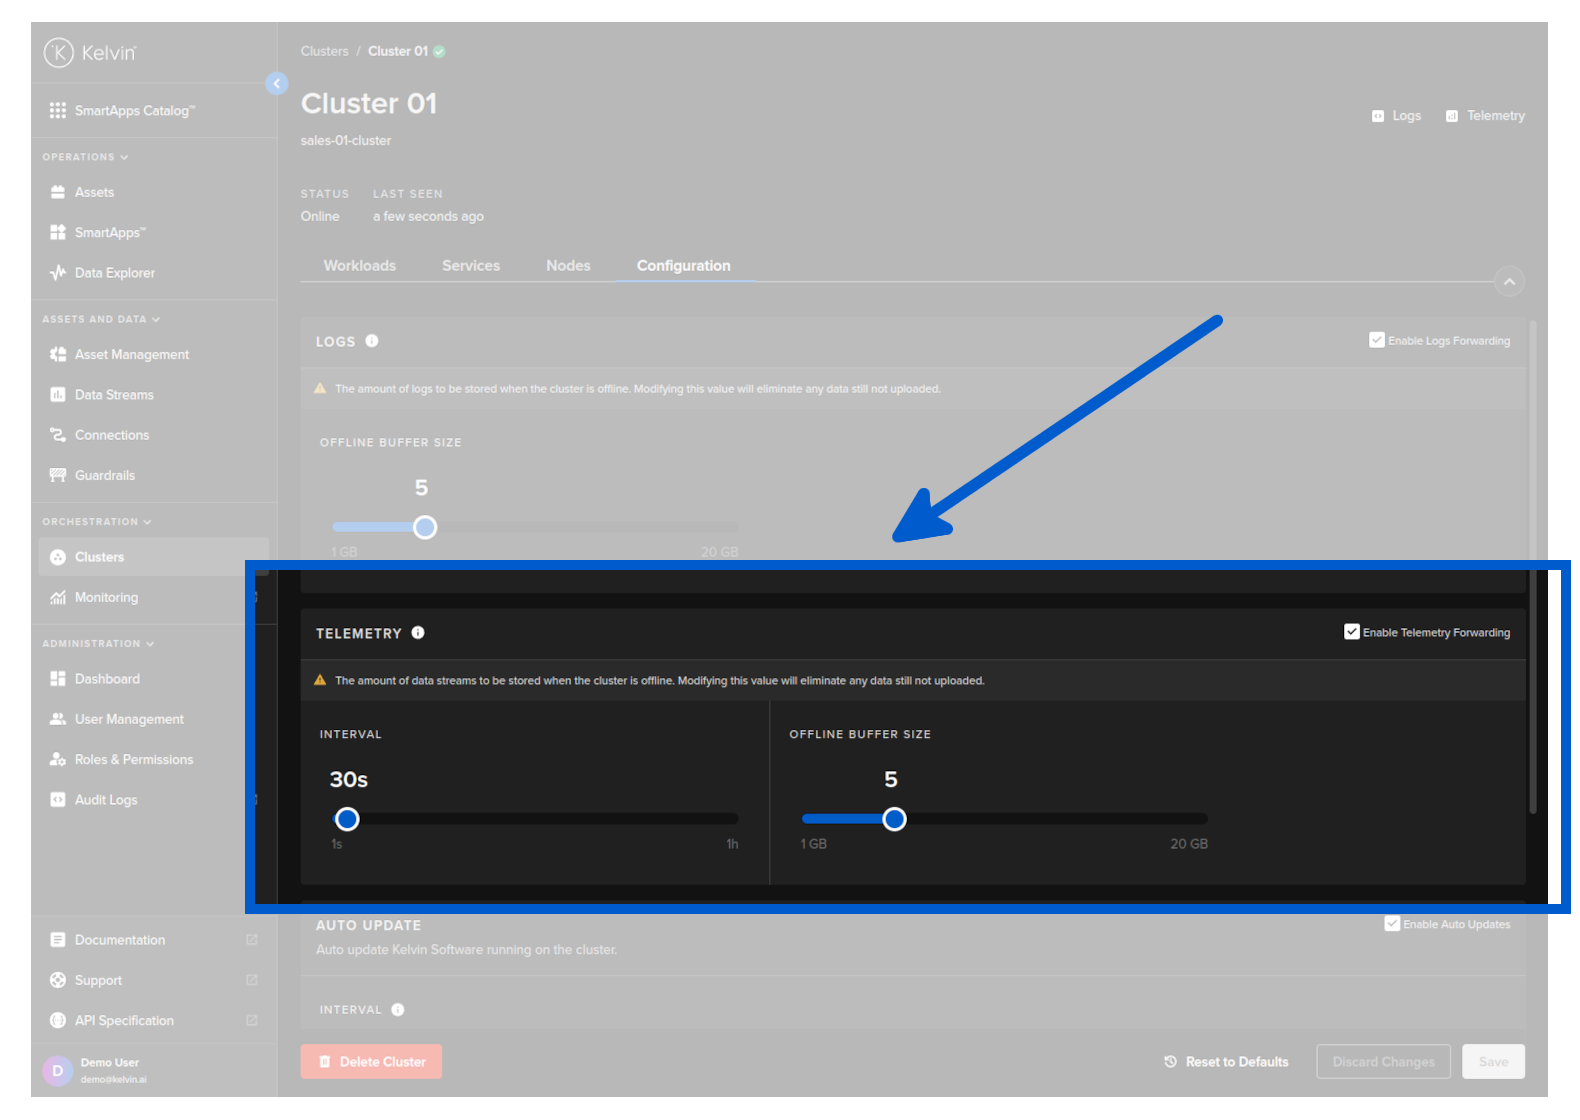
Configuring Cluster Telemetry
When the cluster is offline, the Clusters will continue to collect and buffer the telemetry data and transmit it to the Kelvin when it reconnects.
From Orchestration menu click on a single Cluster, then under the Configuration tab you can adjust the settings for the telemetry buffer size and recording interval while the cluster is not connected to the Kelvin.
Be careful when changing this setting as this will delete all current logs that are currently in the buffer waiting to be loaded to the Kelvin.