Grafana Dashboards
Overview
Kelvin uses Grafana dashboards to view many types of log and telemetry analytics about the Kelvin Infrastructure.
There are four main data sources where you can retrieve information to build dashboards and alerts in Grafana;
To learn more about creating the query for the different data sources, check out their documentation for more details.
| Data Source | Description |
|---|---|
| OpenSearch | Log data for Cluster/Node/Workload |
| Thanos | Telemetry (health) data for Cluster/Node/Workload |
| InfluxDB | Data on Data Streams, Control Changes and Recommendations |
| PostgreSQL | Information on Assets, Apps, Workloads, etc. |
Grafana Alerts
One of the advantages of using Grafana is the ability to create alerts on specific telemetry or log data.
This helps you react faster to emerging situations or to compile records of certain events for analysis at a later stage.
In this document we only show you some commonly used examples of alerts that can help Developers and Platform Administrators keep themselves informed about the operations on Kelvin.
Thanos Alerts
Thanos holds all the telemetry information about the Clusters, Nodes and Workloads on a Kelvin Platform.
Click here to see a full list of data source options
Not all items listed yet. This is still under development. You can see a full list in Grafana itself.
| Data Source Name | Description |
|---|---|
| node_cpu_seconds_total | Total amount of CPU time consumed by a node |
| node_memory_MemAvailable_bytes | Amount of memory that is available for starting new Kelvin SmartApps™, without swapping, on a node |
| node_filesystem_size_bytes | Total size of a filesystem on a node, measured in bytes |
| node_filesystem_avail_bytes | Amount of disk space available on a filesystem on a node, measured in bytes |
| kube_pod_container_status_restarts_total | Counts the total number of restarts for all containers within a specific pod in a Kubernetes cluster |
Here we will go through four different Grafana alert rules that monitor different aspects of workloads and nodes.
This will initiate an alert if any workload restarts.
To create a new alert rule, you can open grafana by clicking on the Monitoring menu item in Administration.
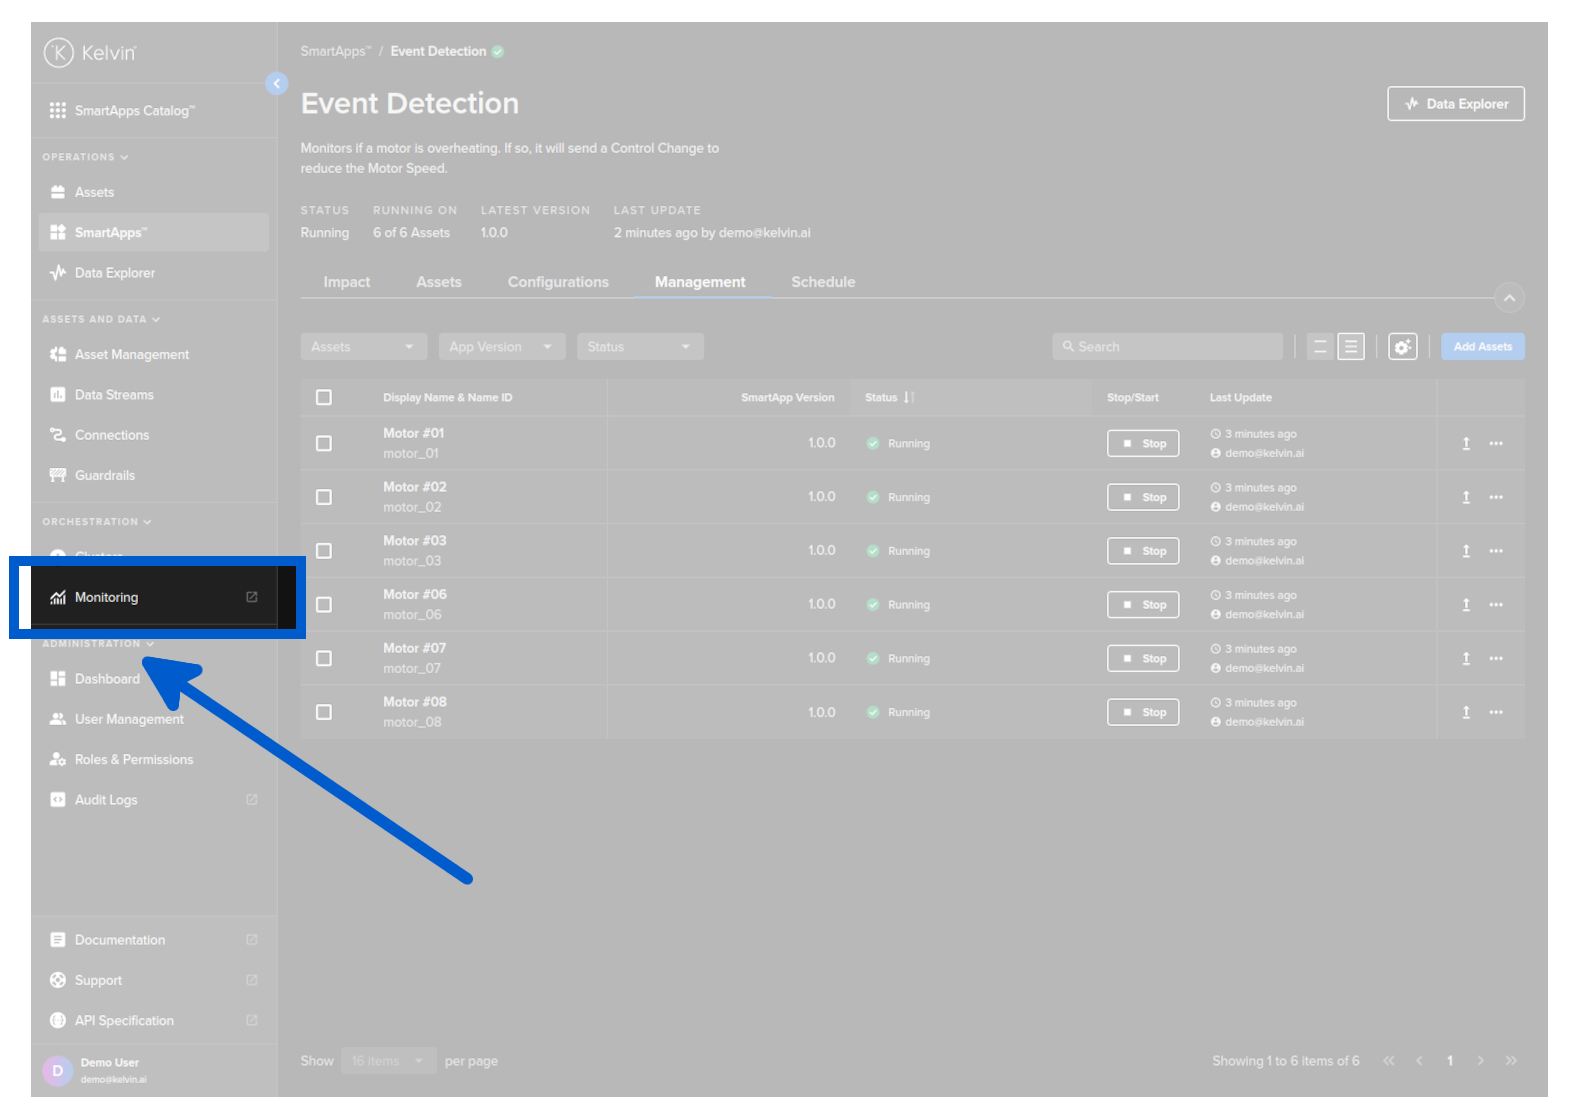
You will then see a list of all the dashboards available in Grafana.
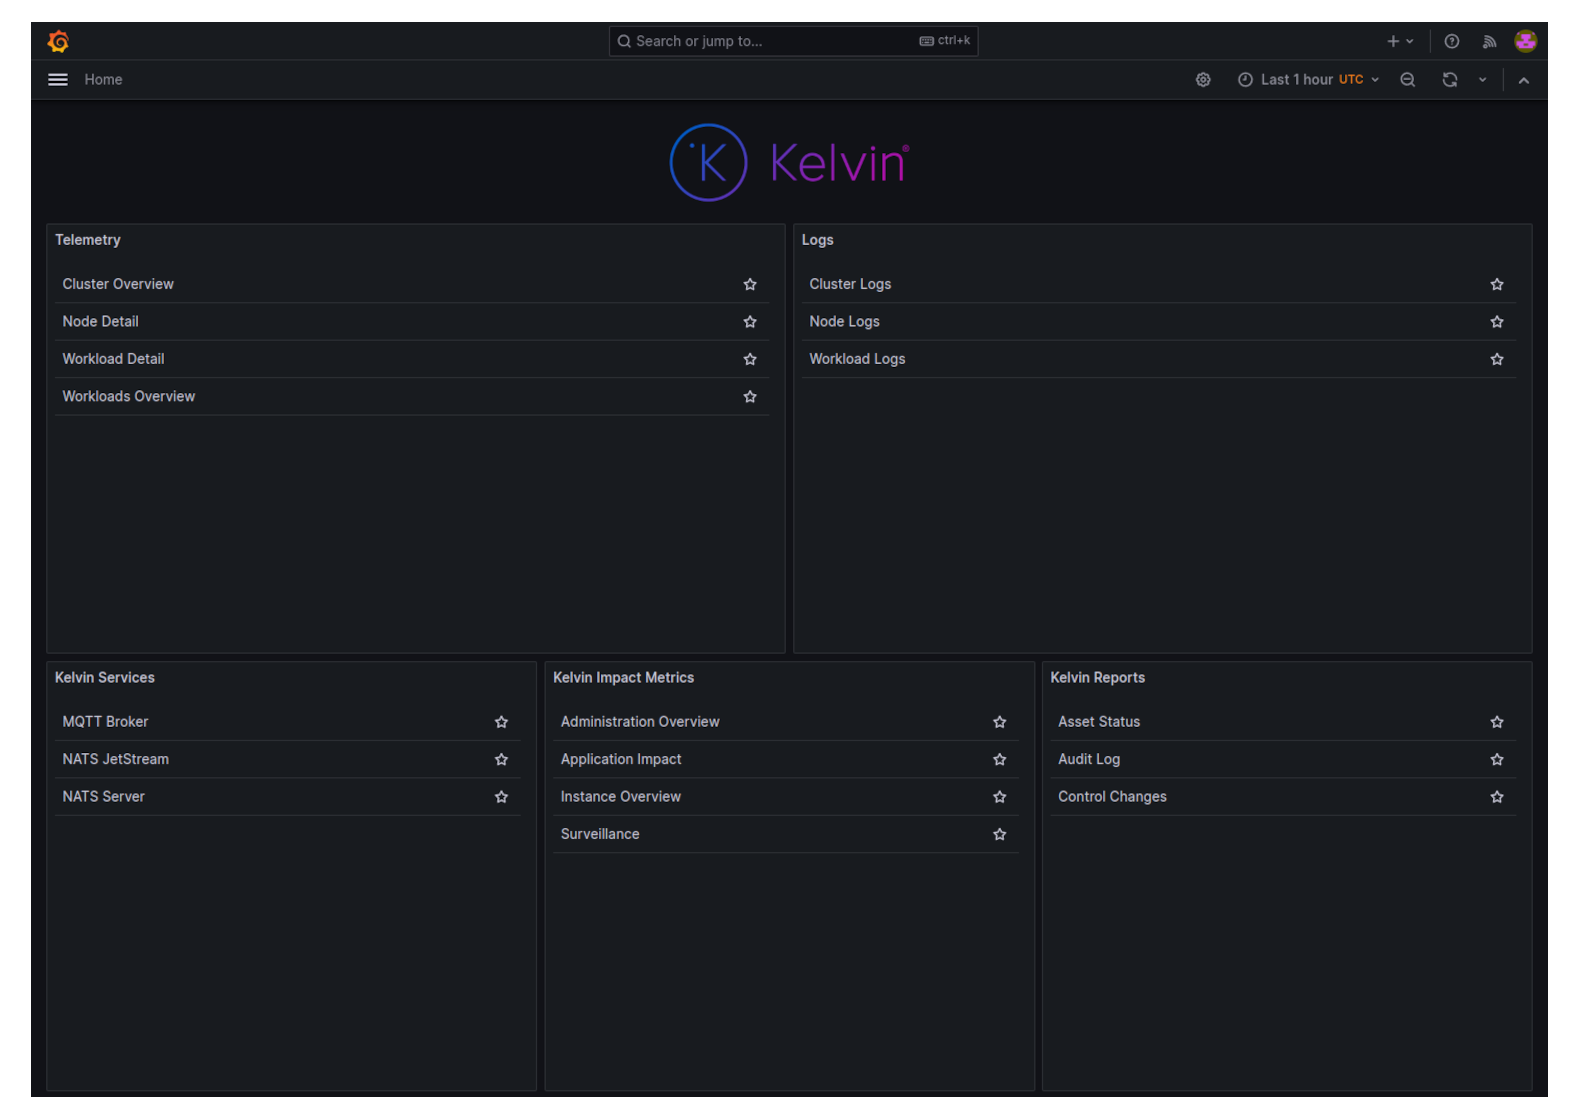
In the top right corner, click on the plus icon in the top right corner and select create alert rule.
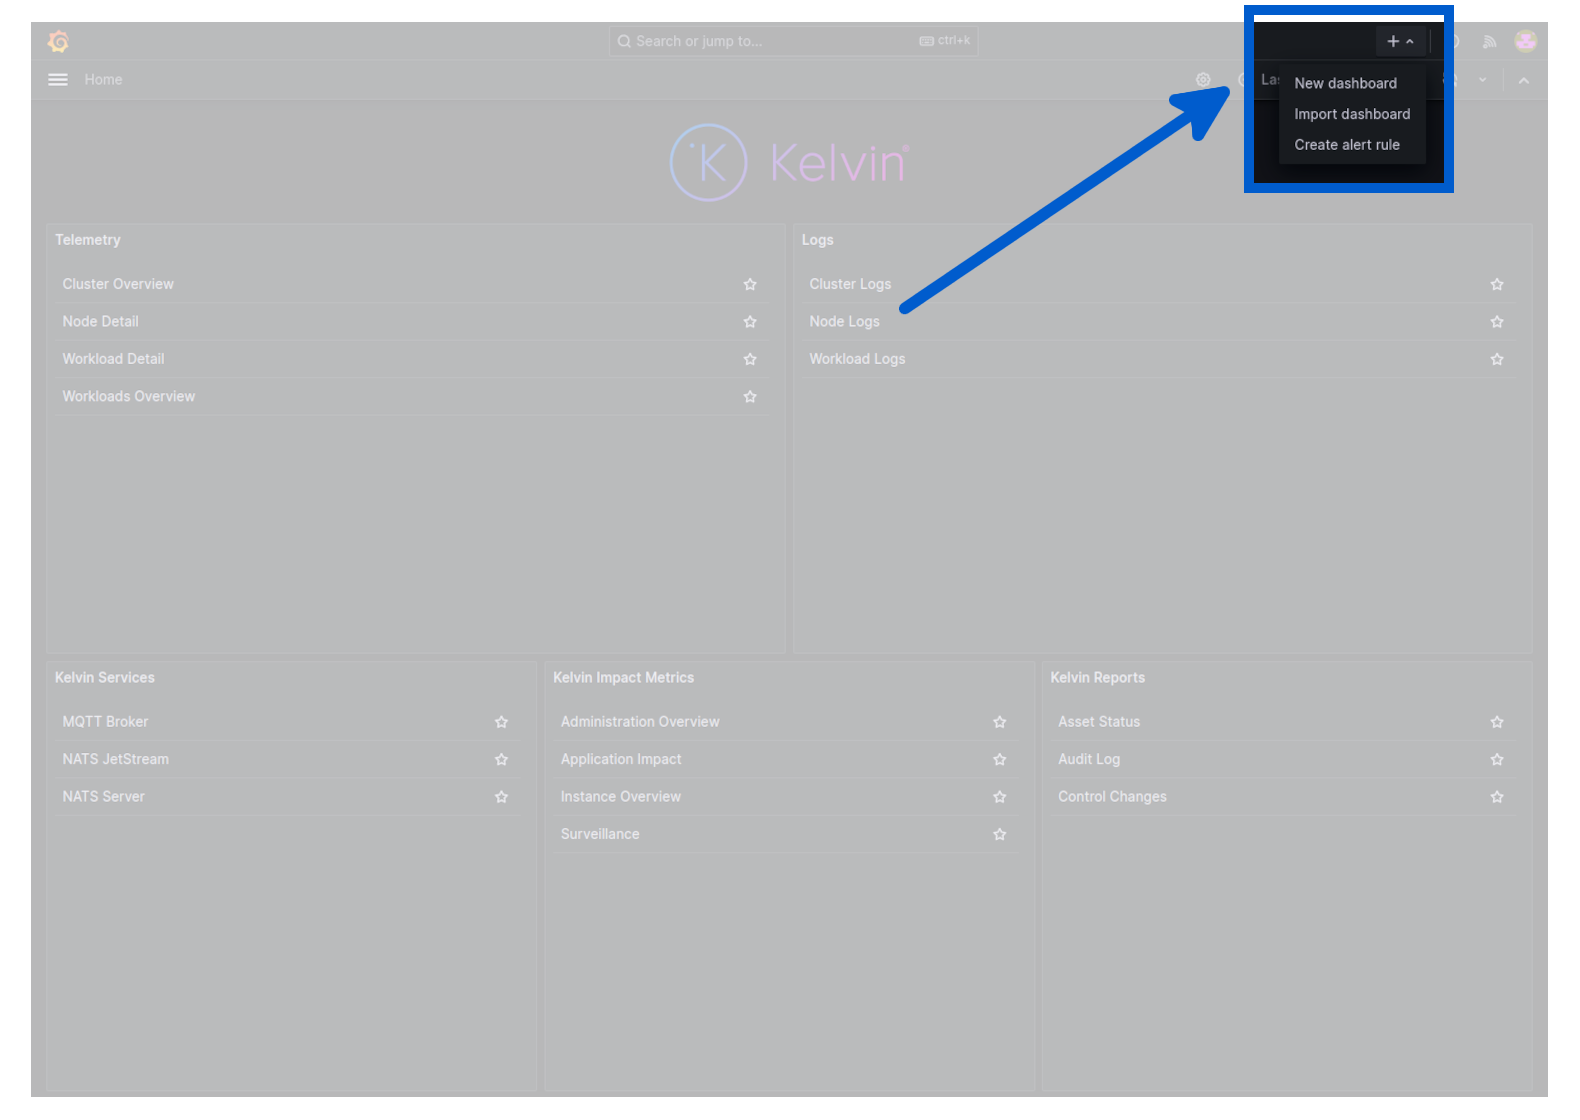
In section 1 add a suitable name.
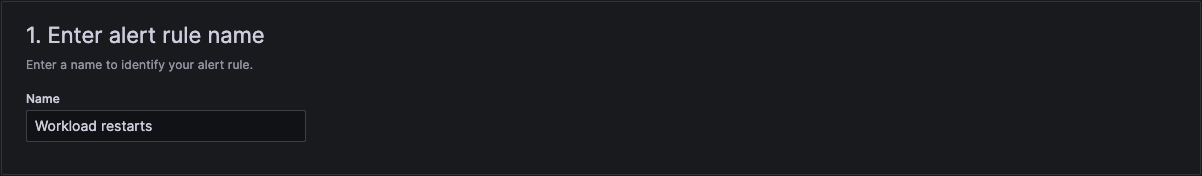
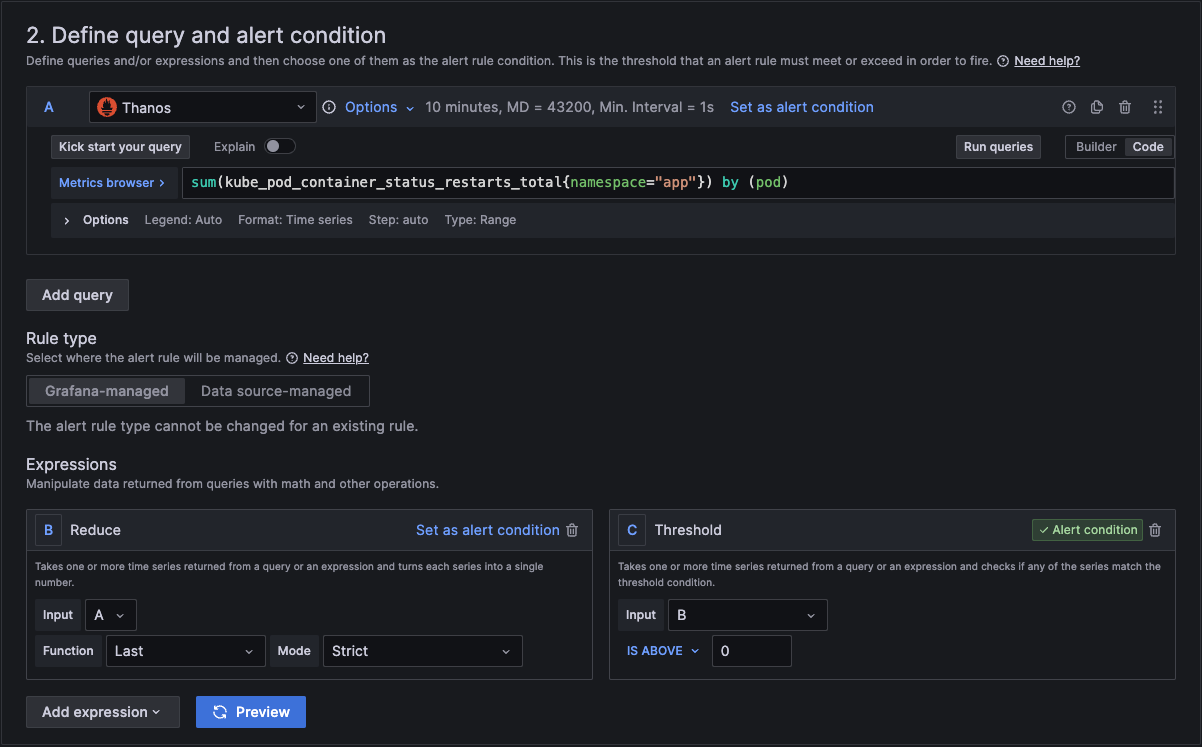
In section 2 we add the actual query and conditions for the alert.
In section A, you can use the builder to create the query or you can change from builder to code and just type in the metrics browser.
You can copy and paste this query code into your query for the alert.
sum(kube_pod_container_status_restarts_total{namespace="app"}) by (pod)
In section 3 we then link it to a folder and an evaluation group. If you don't have one, then you can create a new one here.

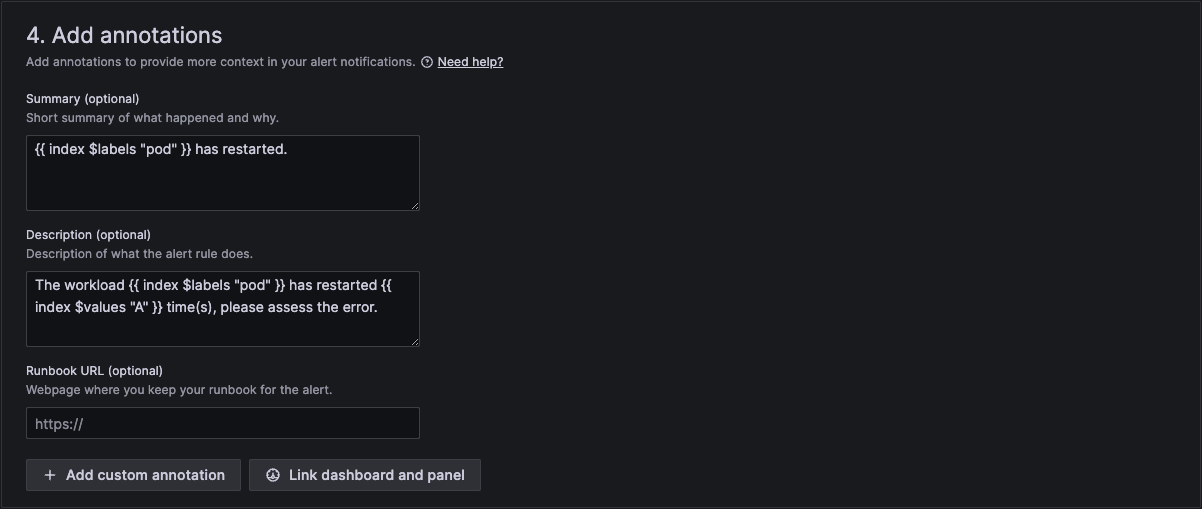
In section 4 we then add a standard summary text that will be sent in the alert. The curly brackets are the variables that will be replaced with the actual text of the workload and number of restarts.
And finally in section 5 we configure notifications.

When finished, click Save rule and exit at the top right hand corner.
Your rule is now active.
This will initiate an alert if any nodes CPU usage exceeds a threshold.
To create a new alert rule, you can open grafana by clicking on the Monitoring menu item in Administration.
You will then see a list of all the dashboards available in Grafana.
In the top right corner, click on the plus icon in the top right corner and select create alert rule.
In section 1 add a suitable name.

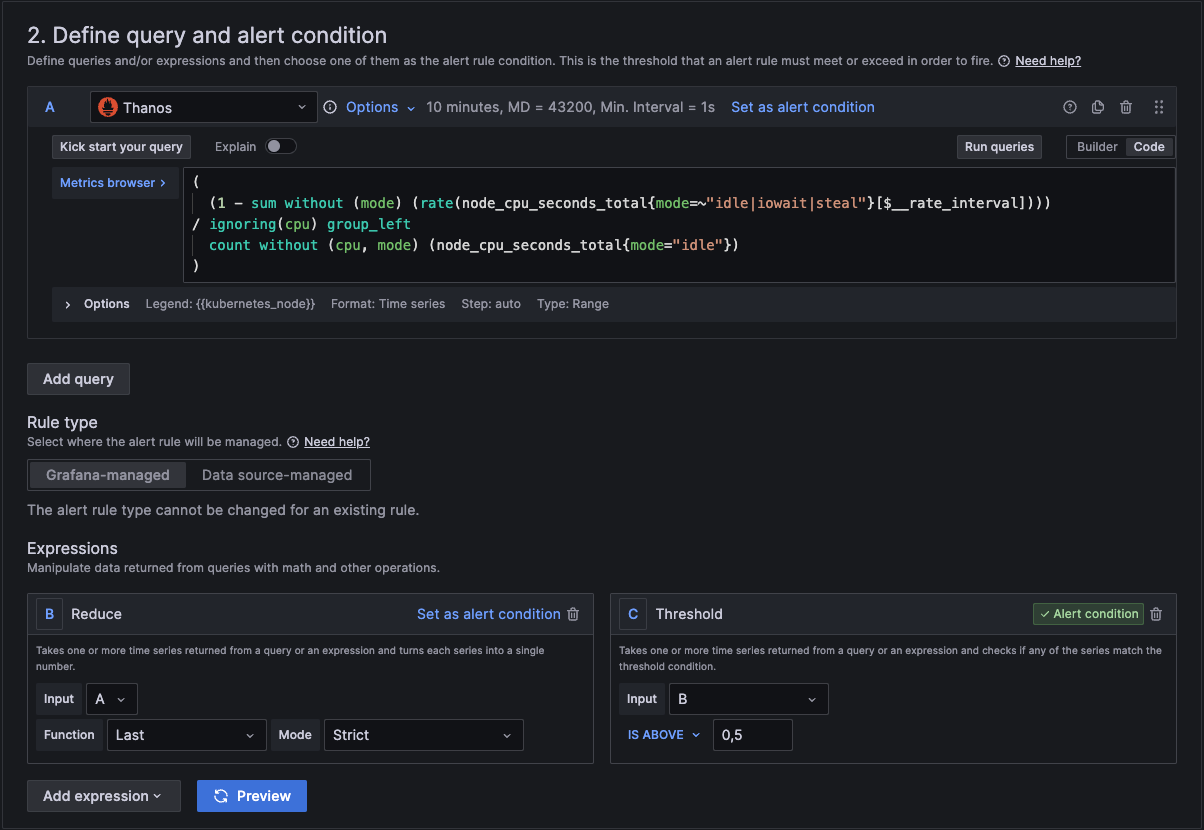
In section 2 we add the actual query and conditions for the alert.
In section A, you can use the builder to create the query or you can change from builder to code and just type in the metrics browser.
You can copy and paste this query code into your query for the alert.
(
    (1 - sum without (mode) (rate(node_cpu_seconds_total{mode=~"idle|iowait|steal"}[$__rate_interval]))) / ignoring(cpu) group_left
    count without (cpu. mode) (node_cpu_seconds_total{mode="idle"})
)
In section 3 we then link it to a folder and an evaluation group. If you don't have one, then you can create a new one here.

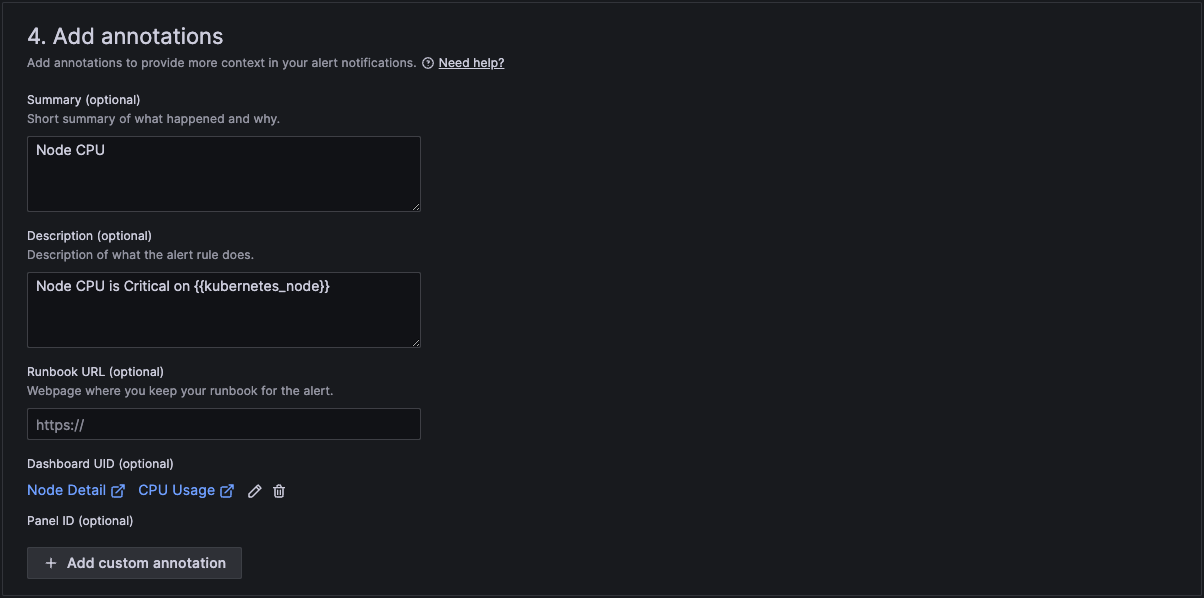
In section 4 we then add a standard summary text that will be sent in the alert. The curly brackets are the variables that will be replaced with the actual text of the workload and number of restarts.
And finally in section 5 we configure notifications.

When finished, click Save rule and exit at the top right hand corner.
Your rule is now active.
This will initiate an alert if any nodes Memory usage exceeds a threshold.
To create a new alert rule, you can open grafana by clicking on the Monitoring menu item in Administration.
You will then see a list of all the dashboards available in Grafana.
In the top right corner, click on the plus icon in the top right corner and select create alert rule.
In section 1 add a suitable name.

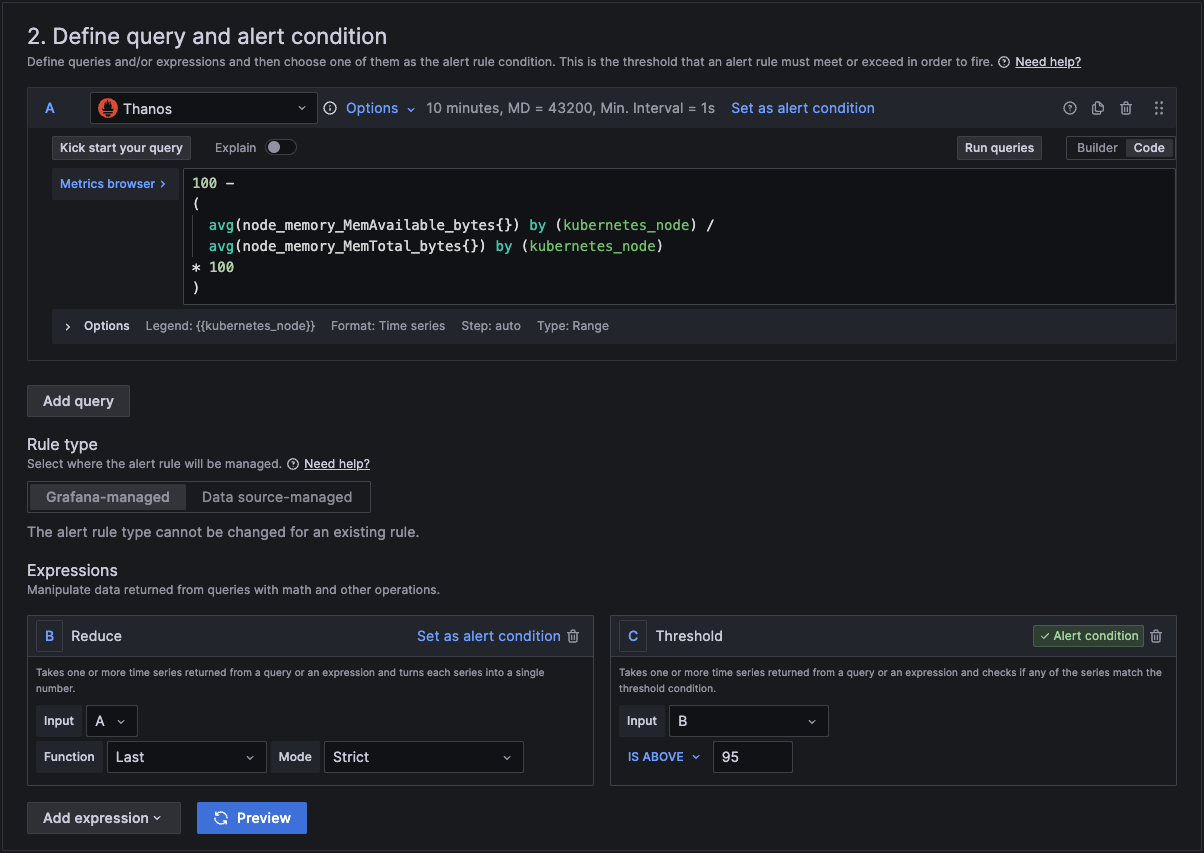
In section 2 we add the actual query and conditions for the alert.
In section A, you can use the builder to create the query or you can change from builder to code and just type in the metrics browser.
You can copy and paste this query code into your query for the alert.
100 -
(
    avg(node_memory_MemAvailable_bytes{}) by (kubernetes_node) / avg(node_memory_MemTotal_bytes{}) by (kubernetes_node)
* 100
)
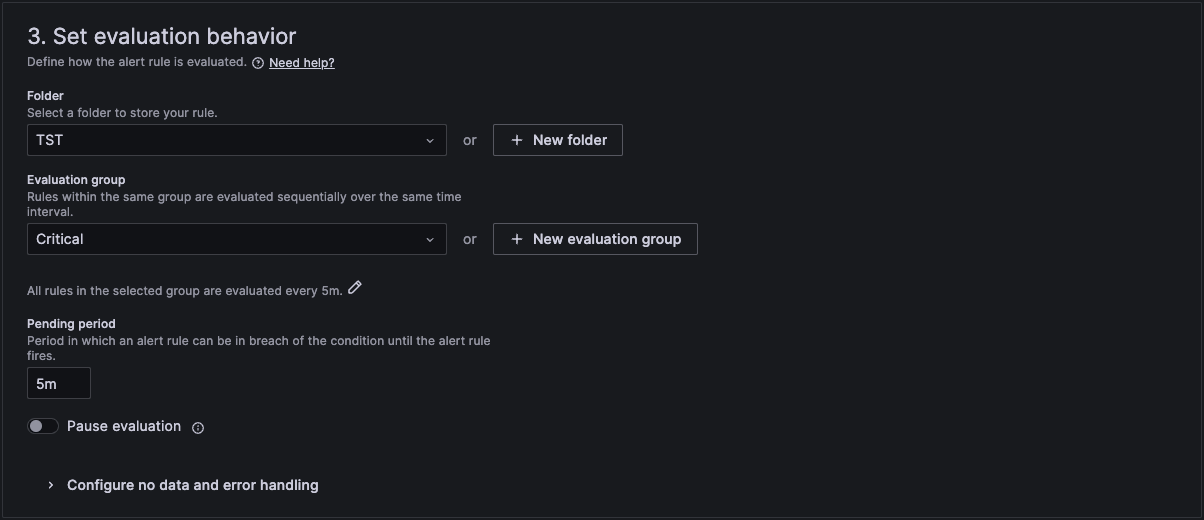
In section 3 we then link it to a folder and an evaluation group. If you don't have one, then you can create a new one here.
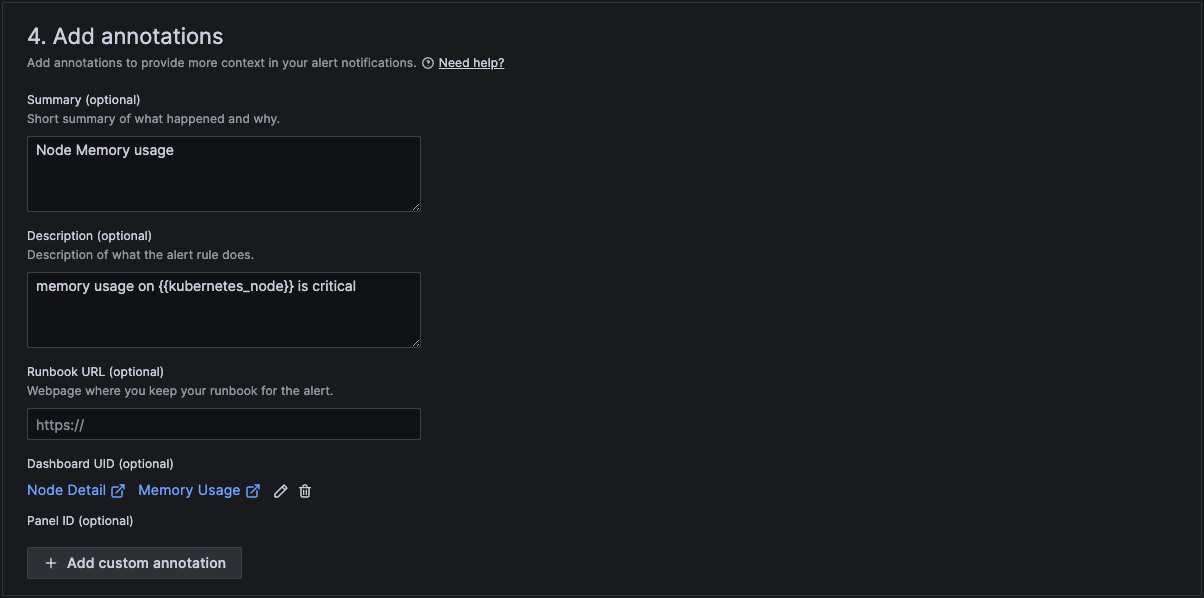
In section 4 we then add a standard summary text that will be sent in the alert. The curly brackets are the variables that will be replaced with the actual text of the workload and number of restarts.
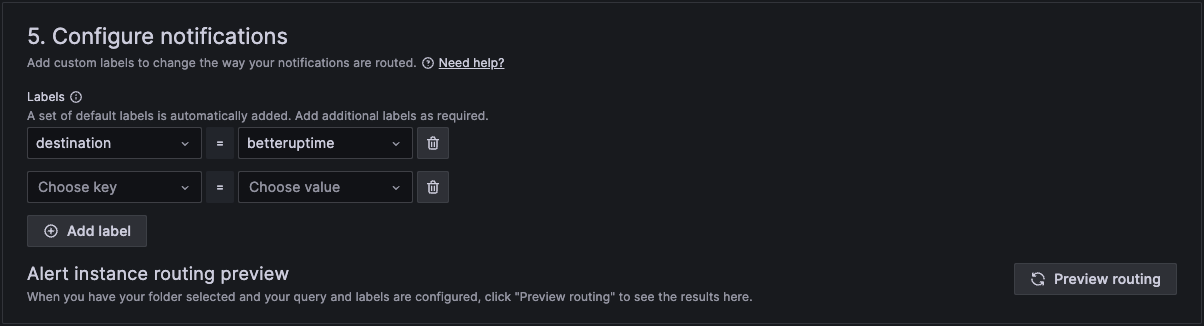
And finally in section 5 we configure notifications.
When finished, click Save rule and exit at the top right hand corner.
Your rule is now active.
This will initiate an alert if any nodes Disk usage exceeds a threshold.
To create a new alert rule, you can open grafana by clicking on the Monitoring menu item in Administration.
You will then see a list of all the dashboards available in Grafana.
In the top right corner, click on the plus icon in the top right corner and select create alert rule.
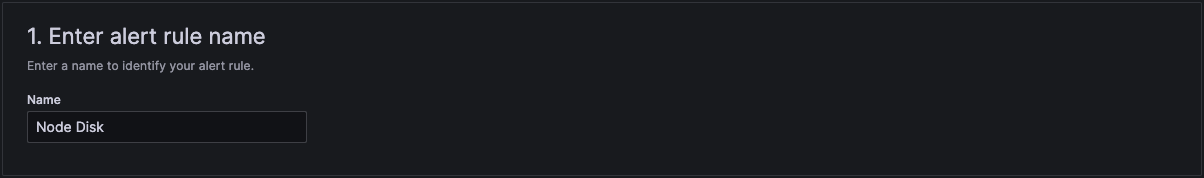
In section 1 add a suitable name.
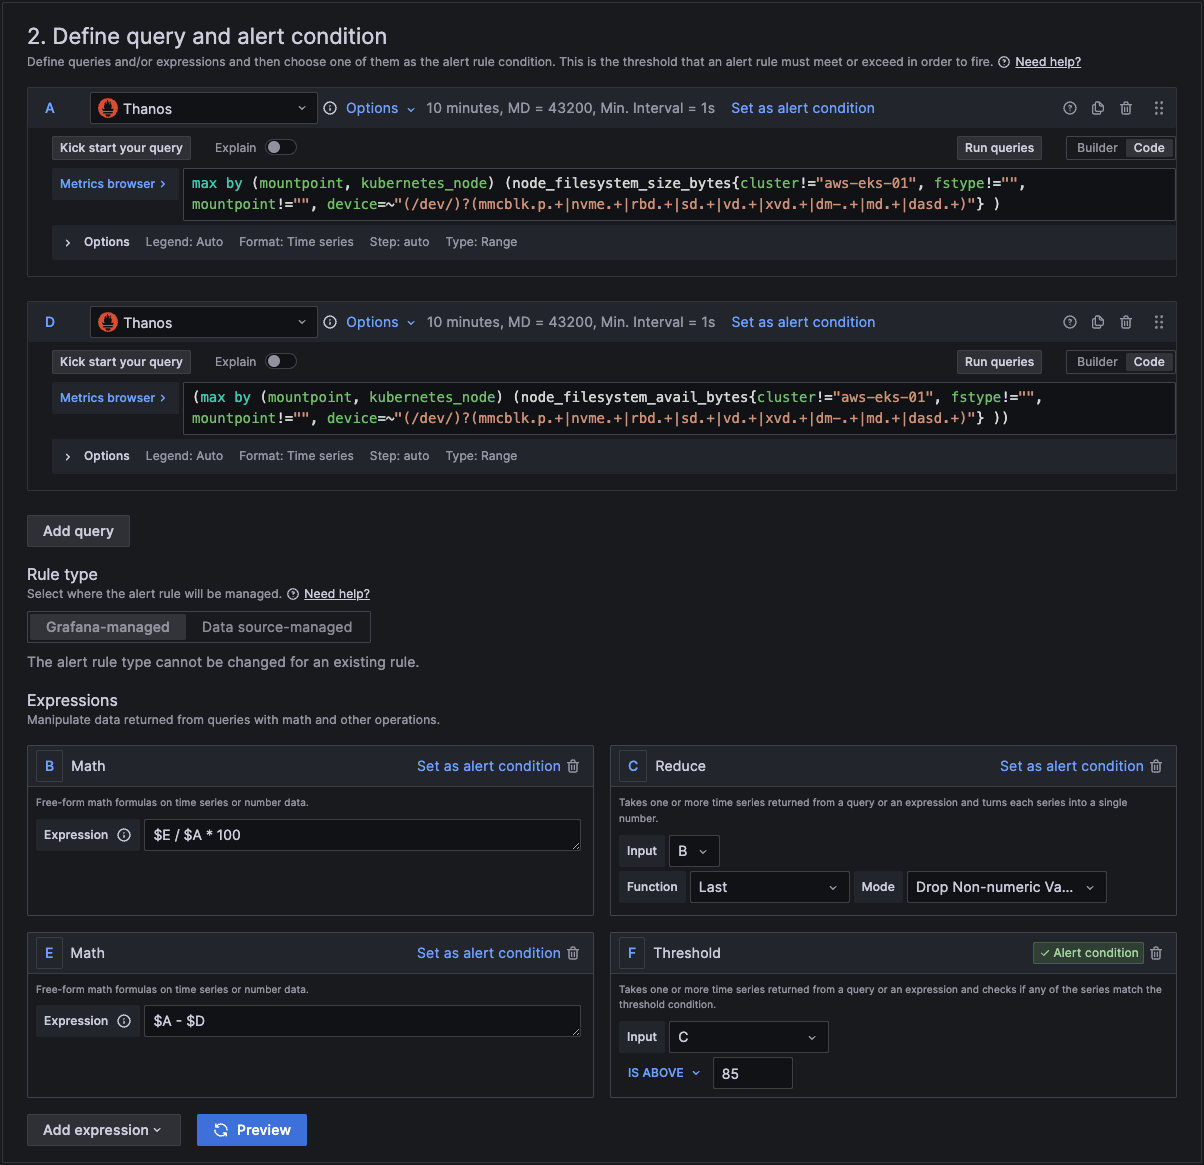
In section 2 we add the actual query and conditions for the alert.
In section A, you can use the builder to create the query or you can change from builder to code and just type in the metrics browser.
You can copy and paste these query codes into your query for the alert.
max by (mountpoint, kubernetes_node) (node_filesystem_size_bytes{cluster!="aws-eks-01", fstype!="", mountpoint !="", device+~(/dev/)?(mmcblk.p.+|nvme.+|ebd.+|sd.+|vd.+|xvd.+|dm-.+|md..+|dasd.+)"} )
and
max by (mountpoint, kubernetes_node) (node_filesystem_avail_bytes{cluster!="aws-eks-01", fstype!="", mountpoint !="", device+~(/dev/)?(mmcblk.p.+|nvme.+|ebd.+|sd.+|vd.+|xvd.+|dm-.+|md..+|dasd.+)"} )
In section 3 we then link it to a folder and an evaluation group. If you don't have one, then you can create a new one here.

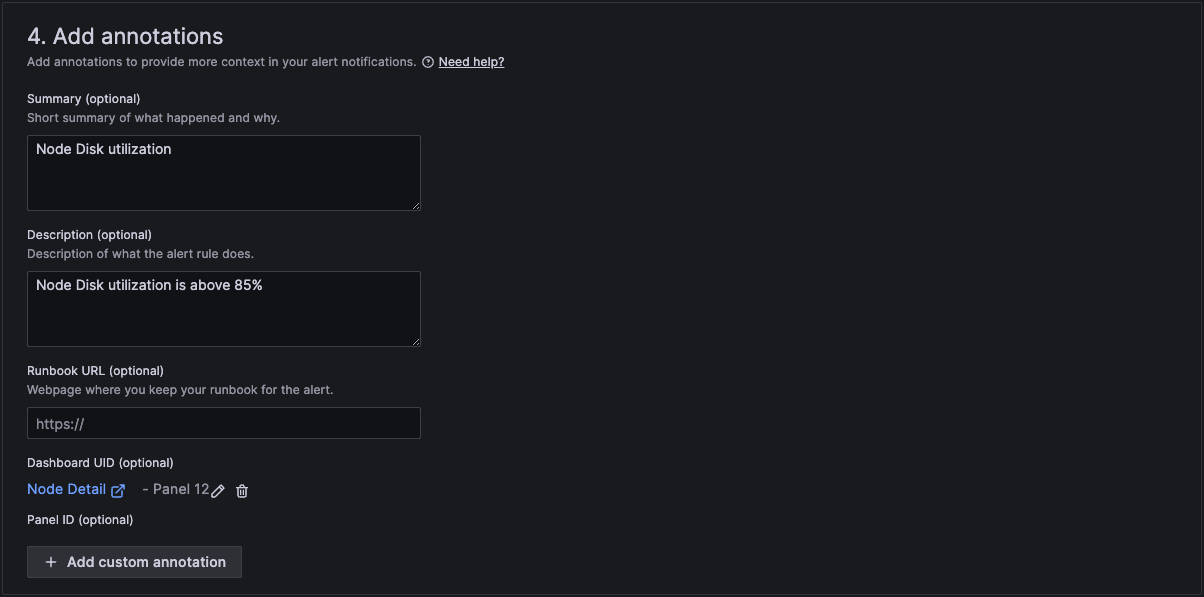
In section 4 we then add a standard summary text that will be sent in the alert. The curly brackets are the variables that will be replaced with the actual text of the workload and number of restarts.
And finally in section 5 we configure notifications.

When finished, click Save rule and exit at the top right hand corner.
Your rule is now active.
OpenSearch Alerts
OpenSearch holds all the log information about the Clusters, Nodes and Workloads on a Kelvin Platform.
Examples coming soon.
InfluxDB Alerts
InfluxDB holds all the data for Data Streams, Control Changes and Recommendations on a Kelvin Platform.
Examples coming soon.
PostgreSQL Alerts
PostgreSQL holds all the information on Assets, Apps, Workloads, etc. on a Kelvin Platform.
Examples coming soon.