Managing Asset Maps
On this page you get an overview of all Assets being managed by Kelvin through a geospatial map interface. You can build custom views for the option asset list overview by using information like Data Streams, Kelvin SmartApps™ configurations, Recommendations, actions like last Control Change and more.
Overview
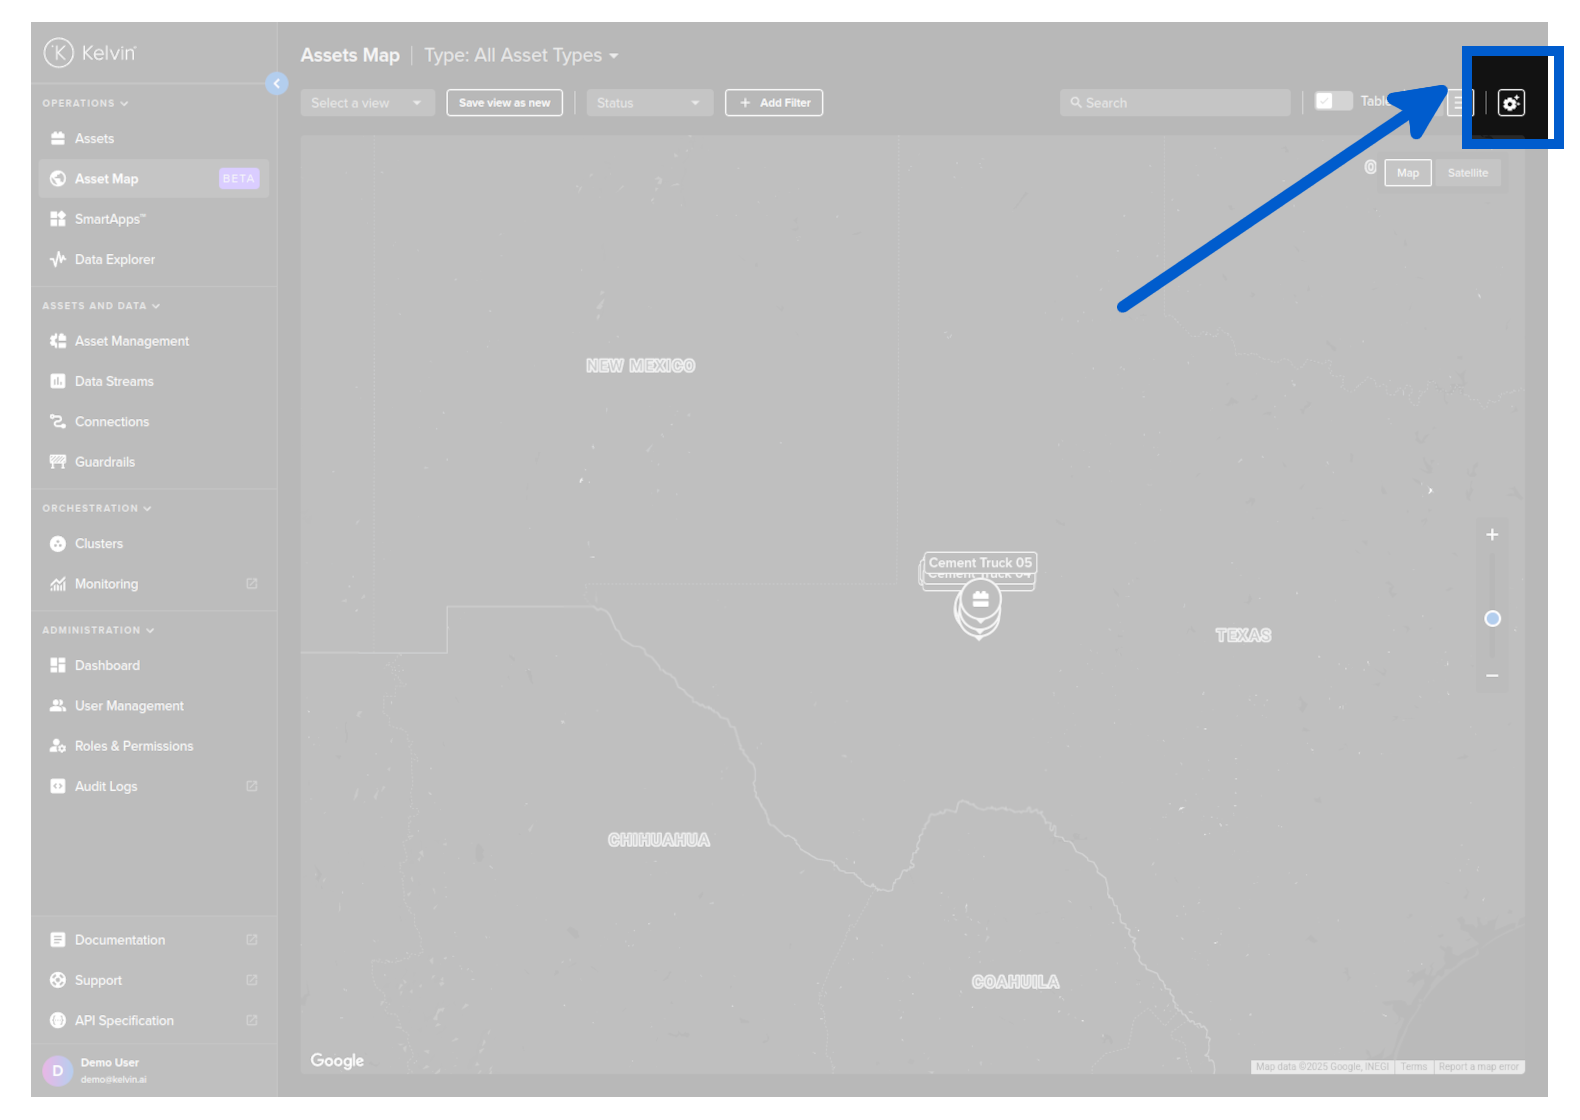
The first time you see this page it will only show the Geospatial Map view.
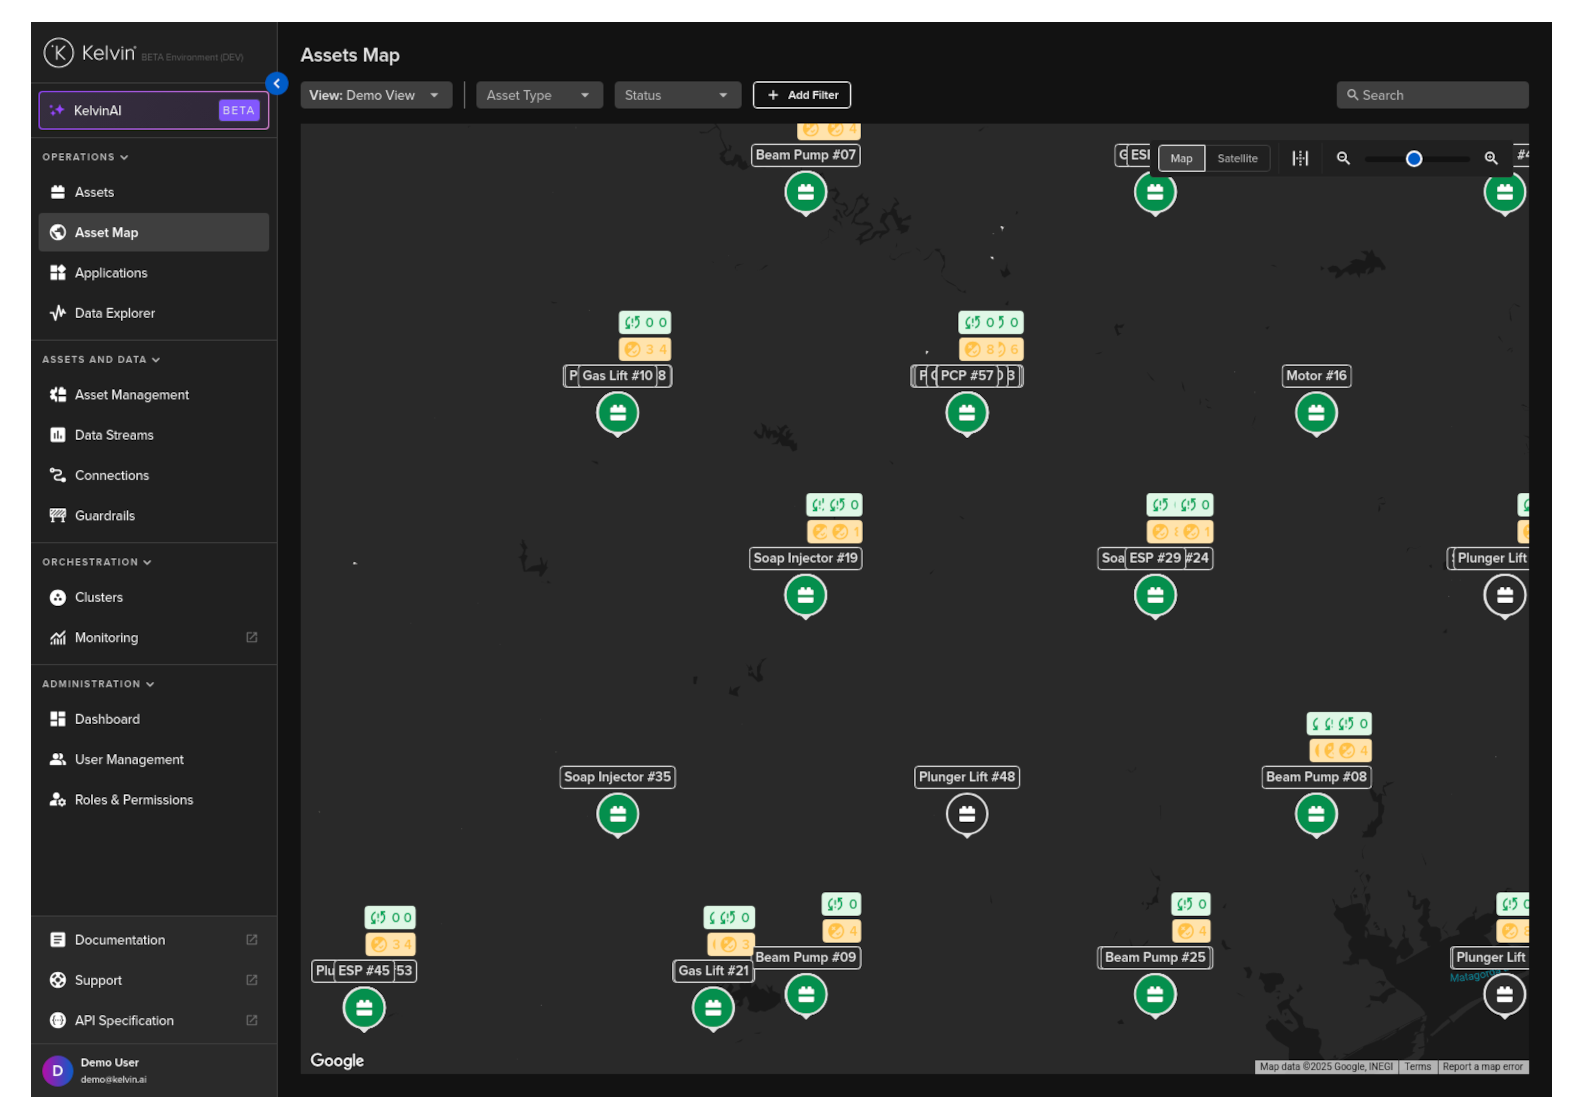
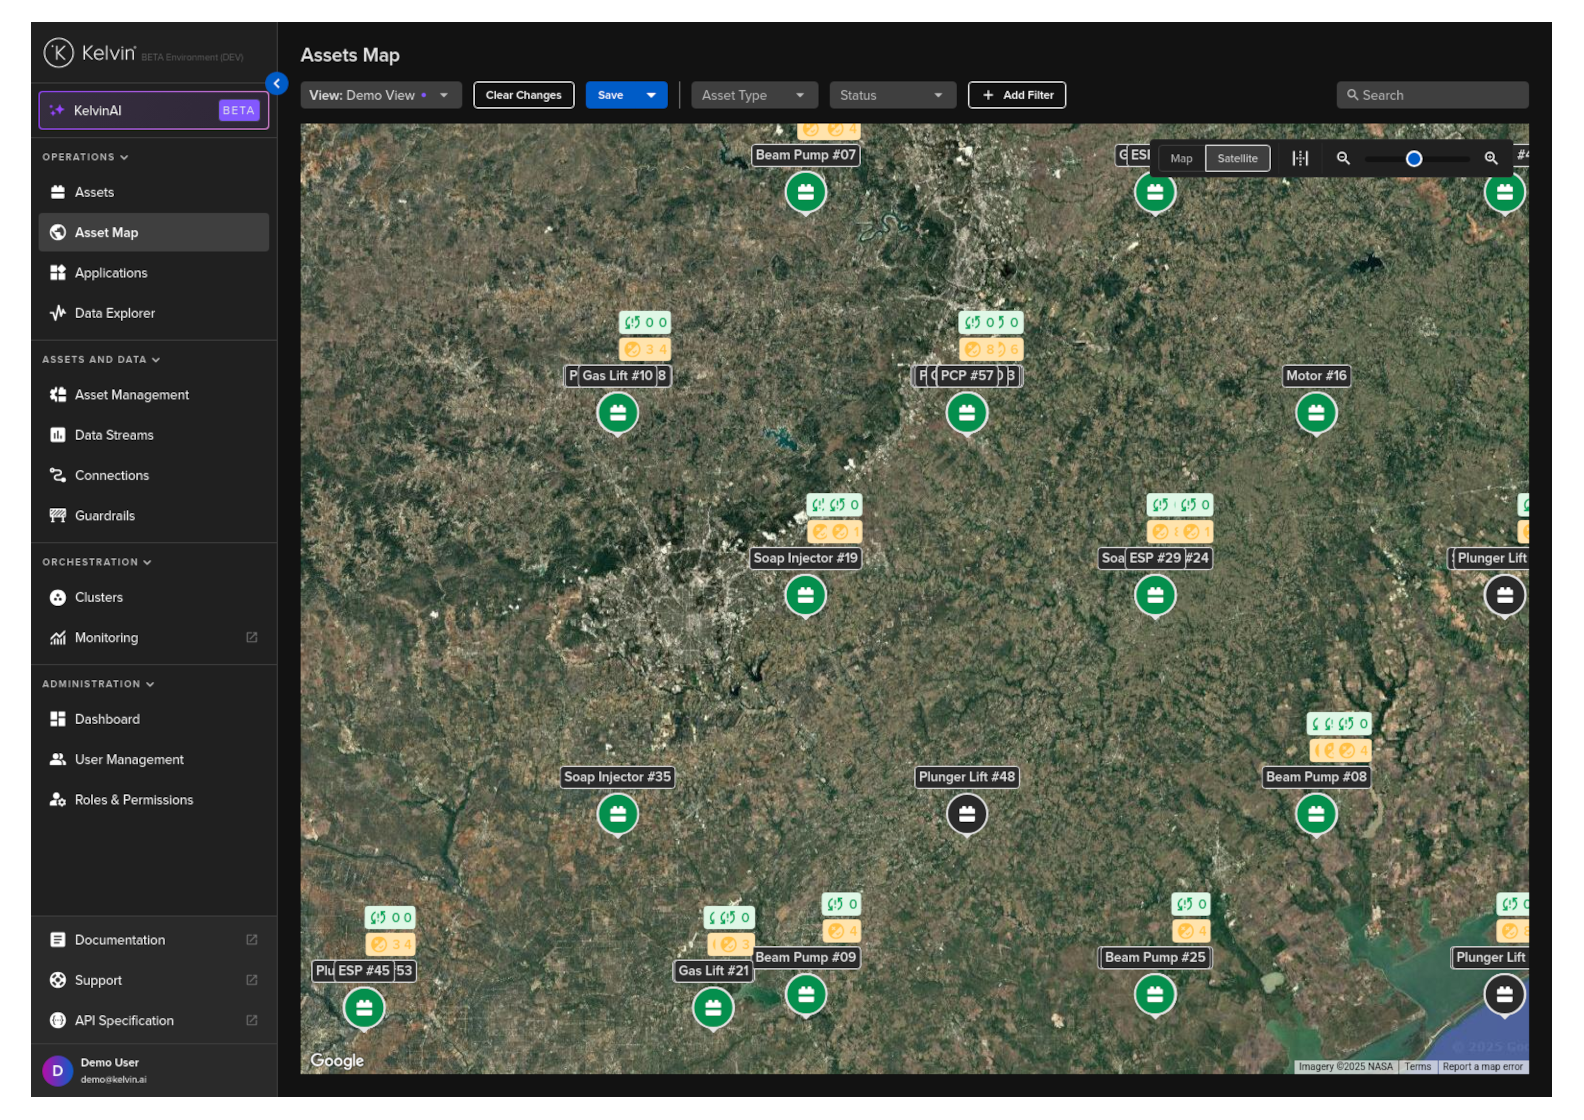
This is a Google Maps view with the common features like Satellite view.
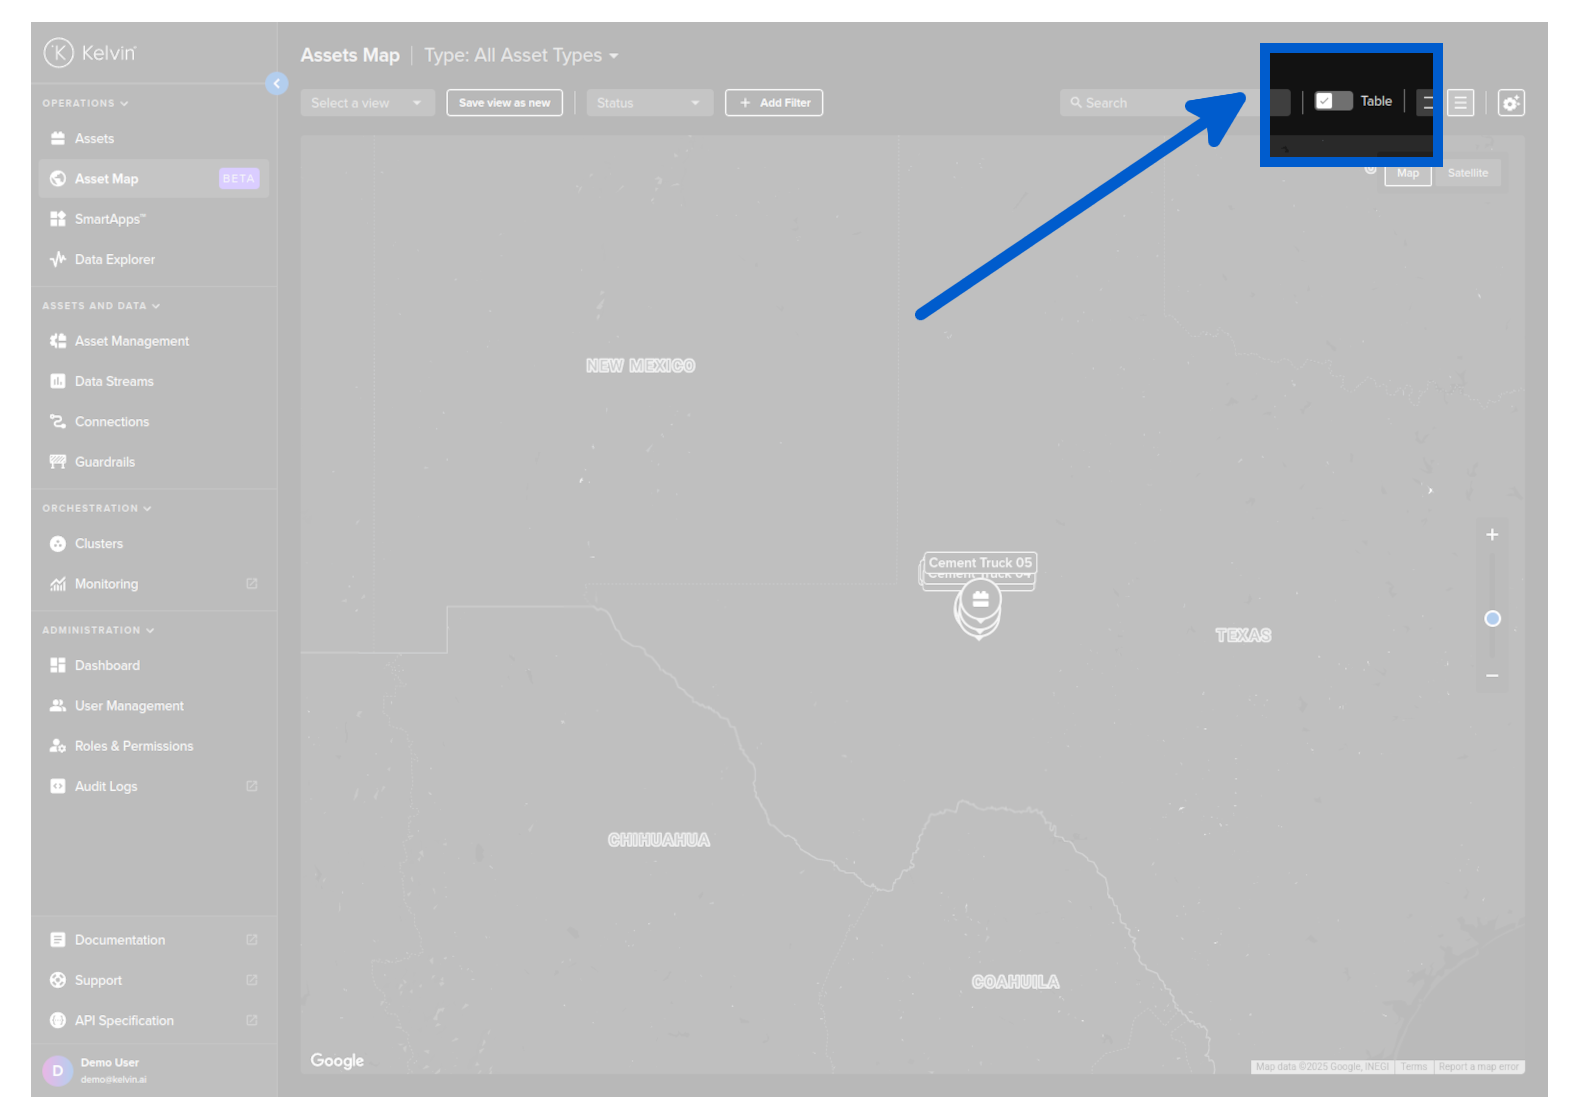
There is also an option to show an asset-centric table.
Note
The views which allow for multiple customized columns on your table are the same that are used in the Asset page.
You can modify or add new views either here or in the Assets page.
Click here to go and read about all the features and options in this Asset-centric table.

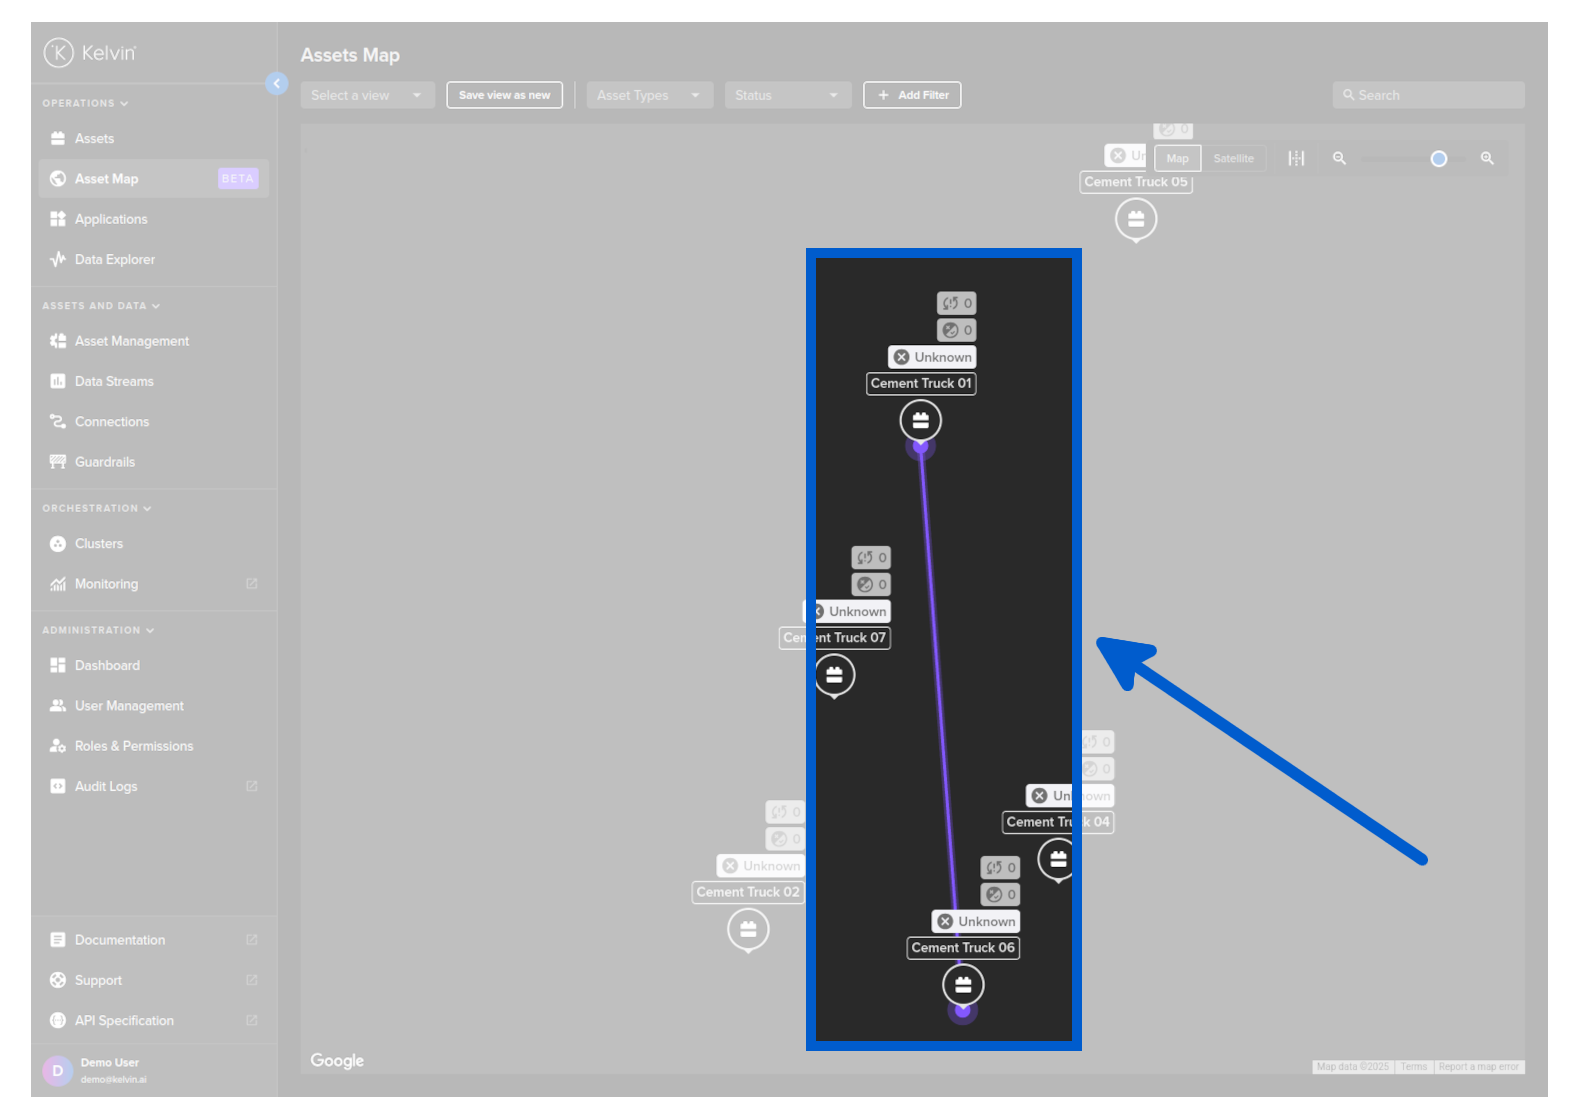
Linked Assets
Assets that are related together are displayed by connecting them with a line.
Basic Features
On the overview page you have a number of common features that help you quickly navigate, find and filter the assets of interest.
Once you have configured and filtered your list, the list as you see it will be utilized as the reference list on the Asset Details page which we discuss in detail in the View Asset Details page, allowing for easier navigation and scrolling.
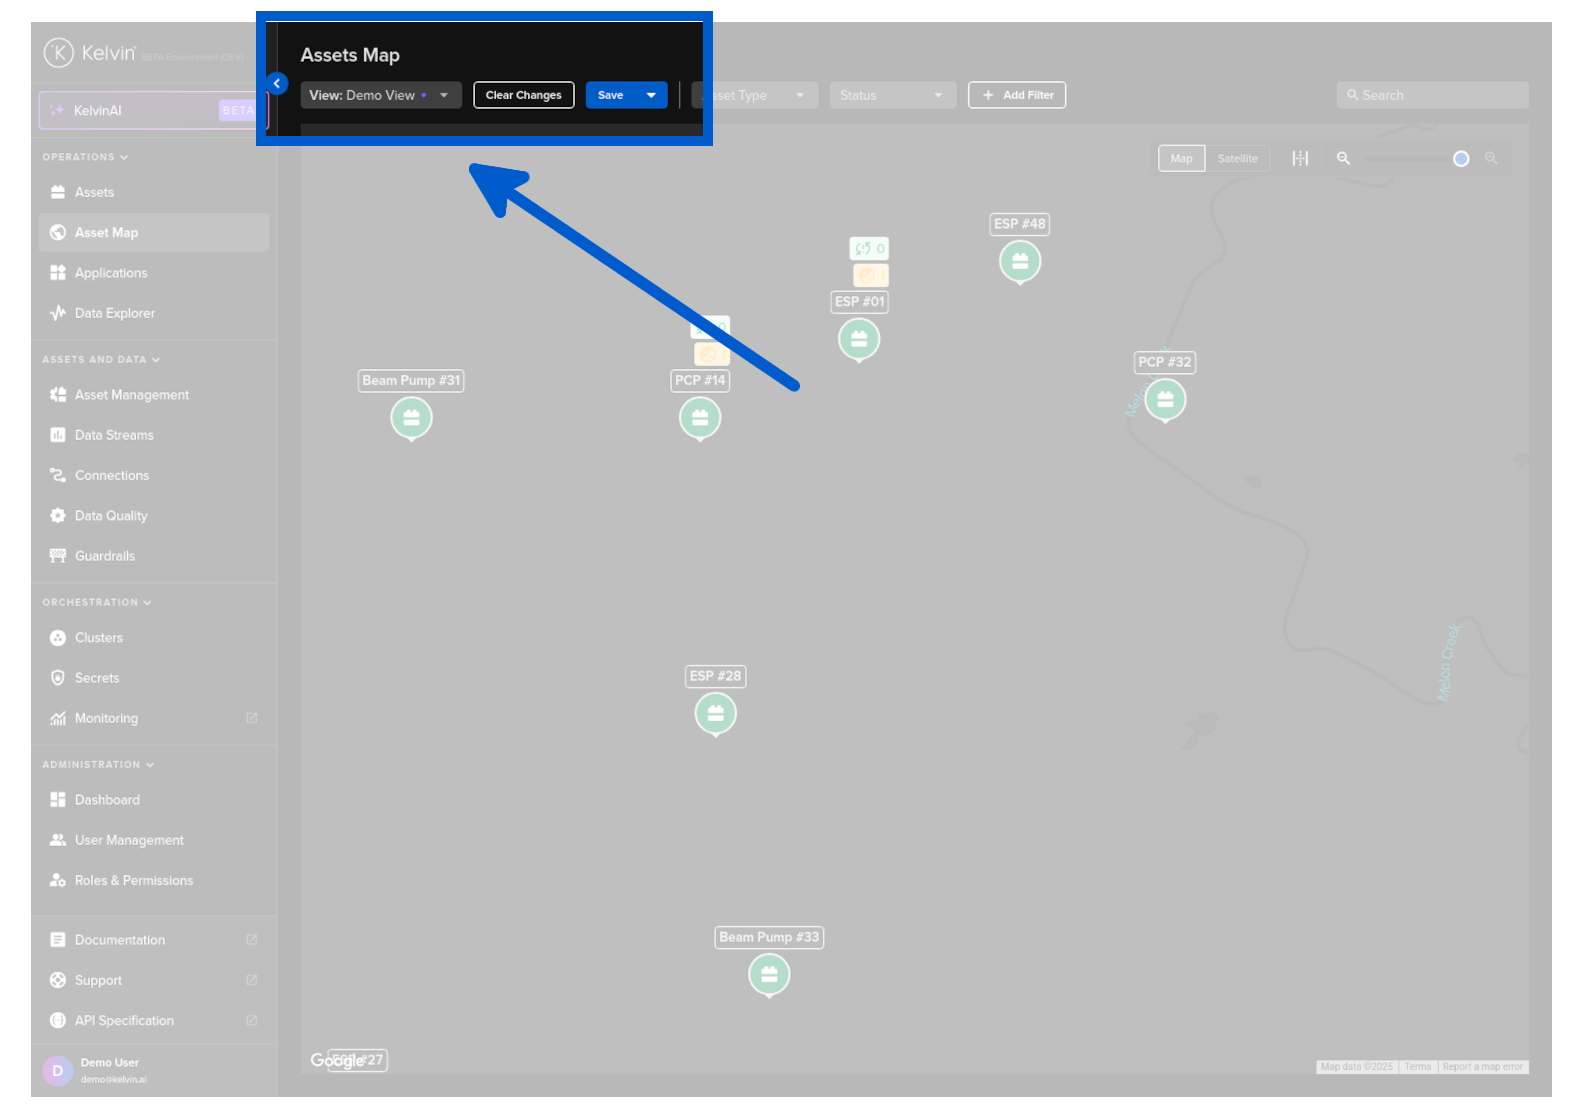
You can customize your column views and save them, allowing you to quickly change views for different operations.
Note
See full details about managing and saving custom views in the Asset page documentation.
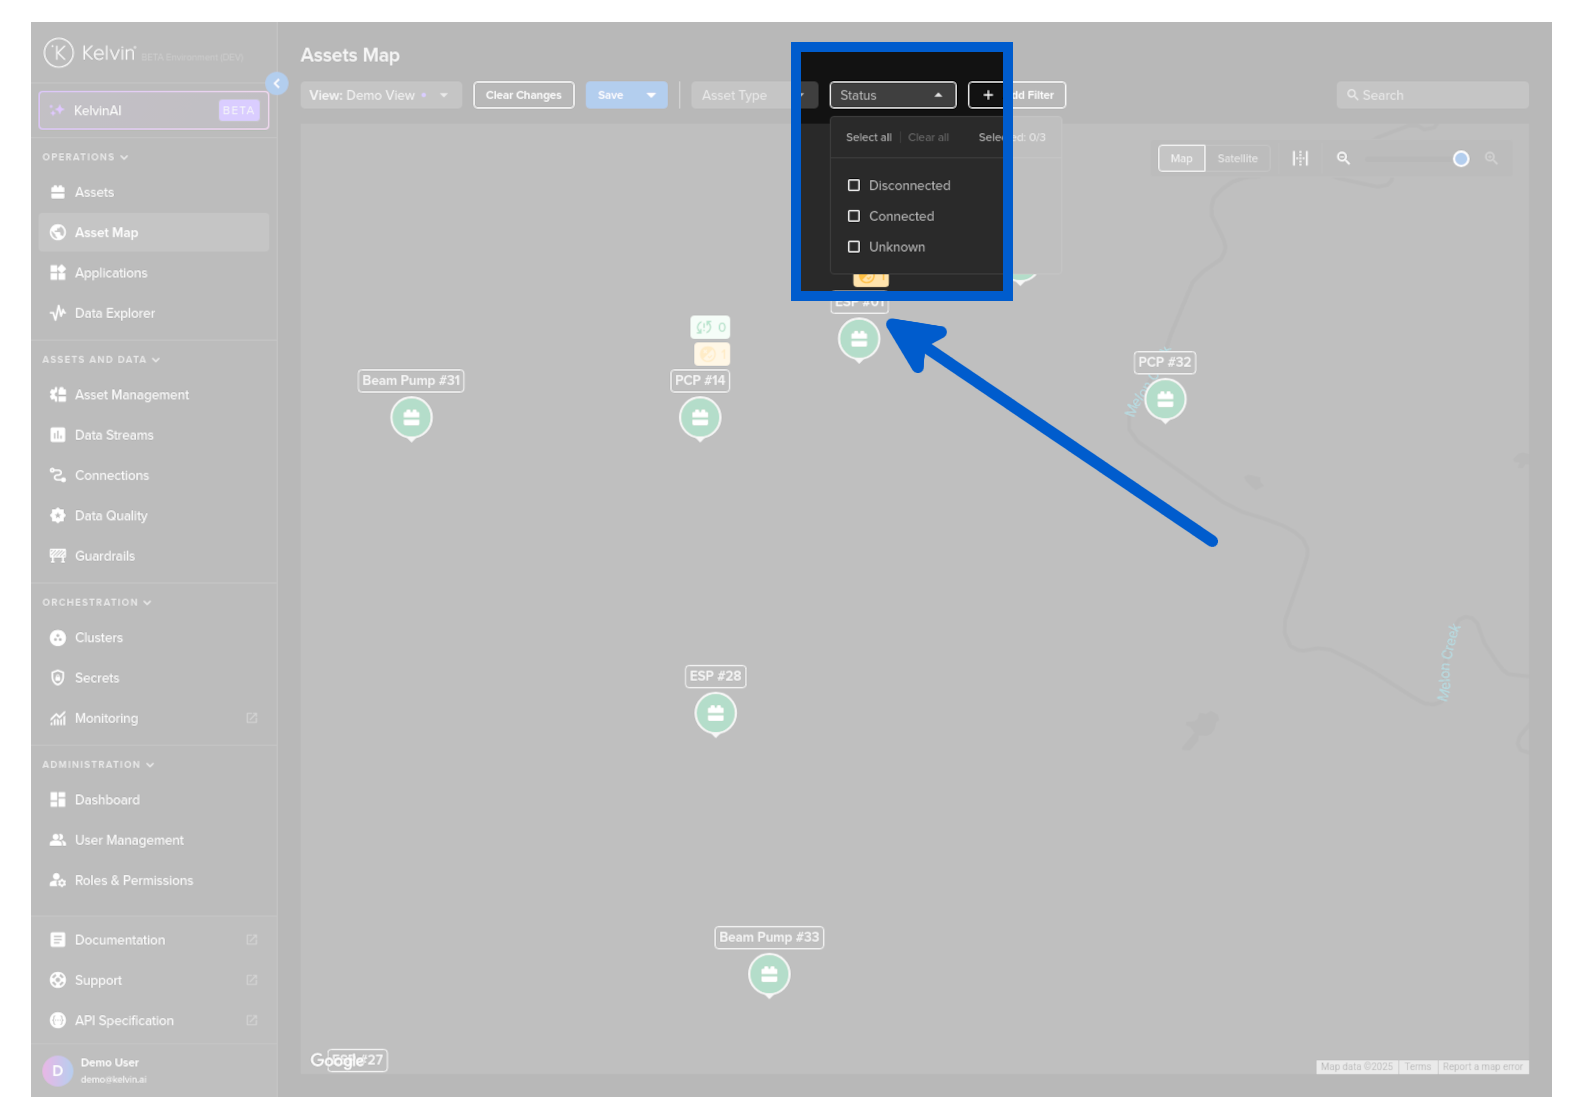
You can do a quick filter on the status of Assets.
Note
See full details on status filters in the Asset page documentation.
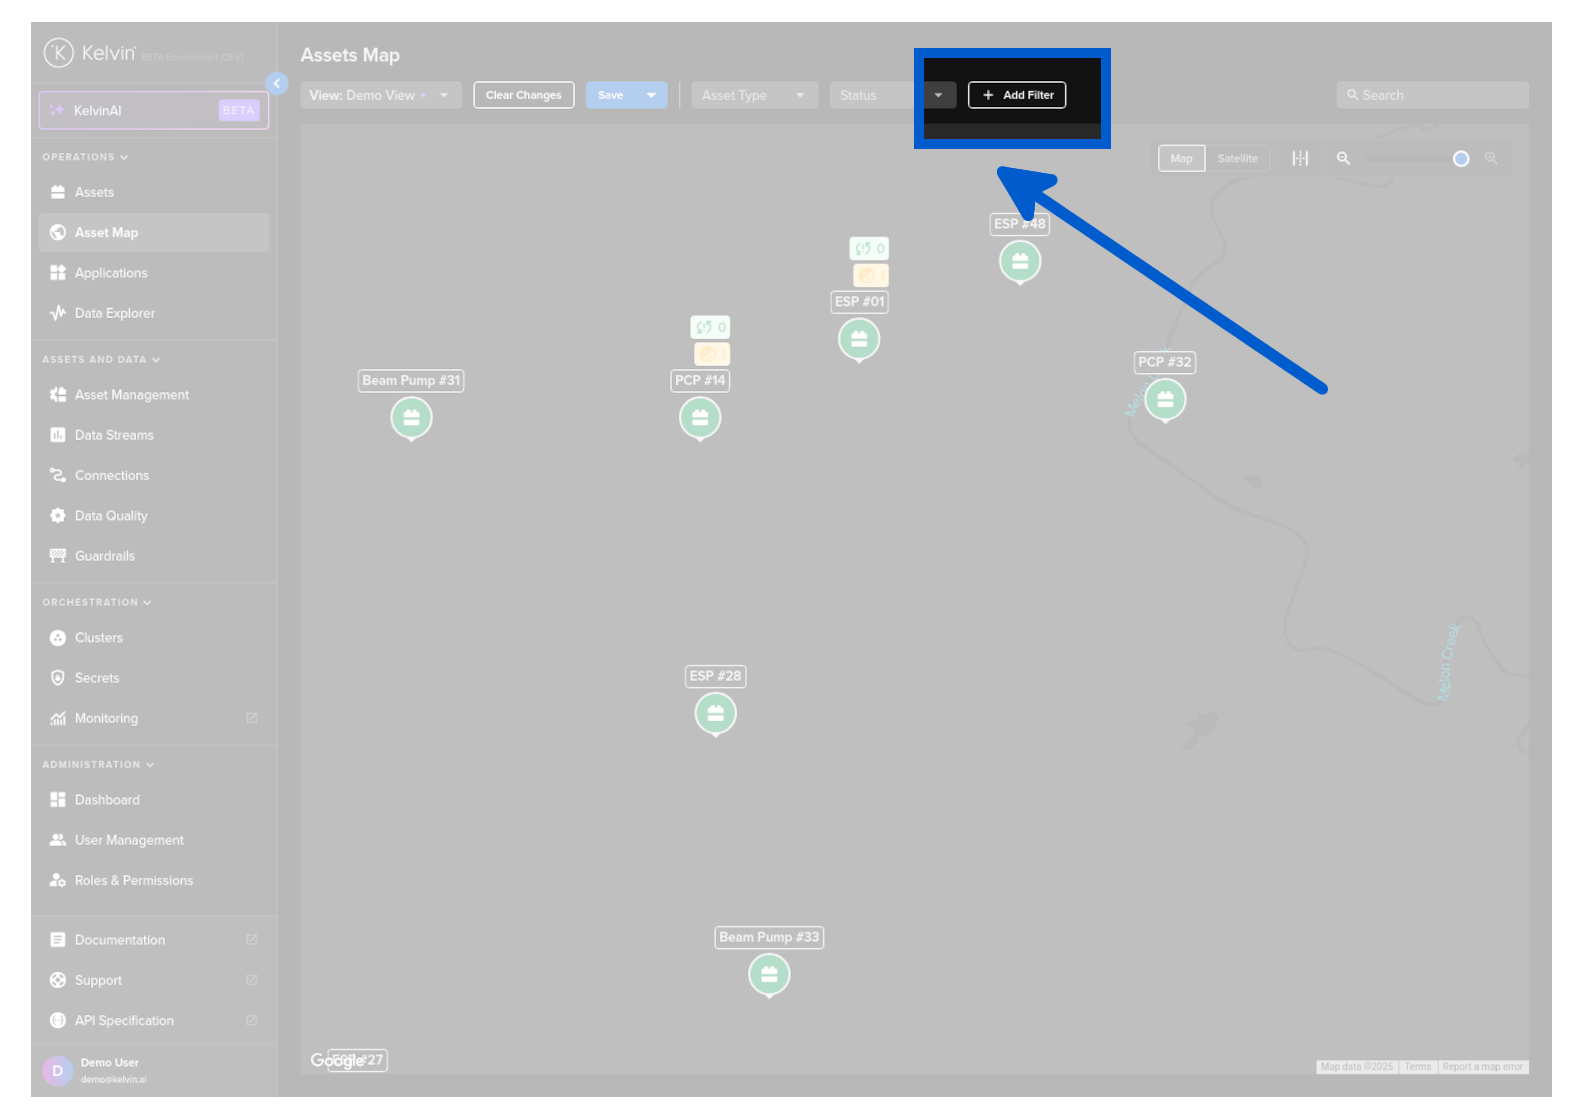
There is a powerful filtering setup that can help configure the information you want to display.
All filters are persistent, so if you go to other pages or log out the filters will still be implemented when you return.
There are three types of filters you can apply;
- On Asset Properties
- On Asset Parameters in Kelvin SmartApps™
- On Asset / Data Stream pairs aggregation of data
Note
See full details on advanced filters in the Asset page documentation.
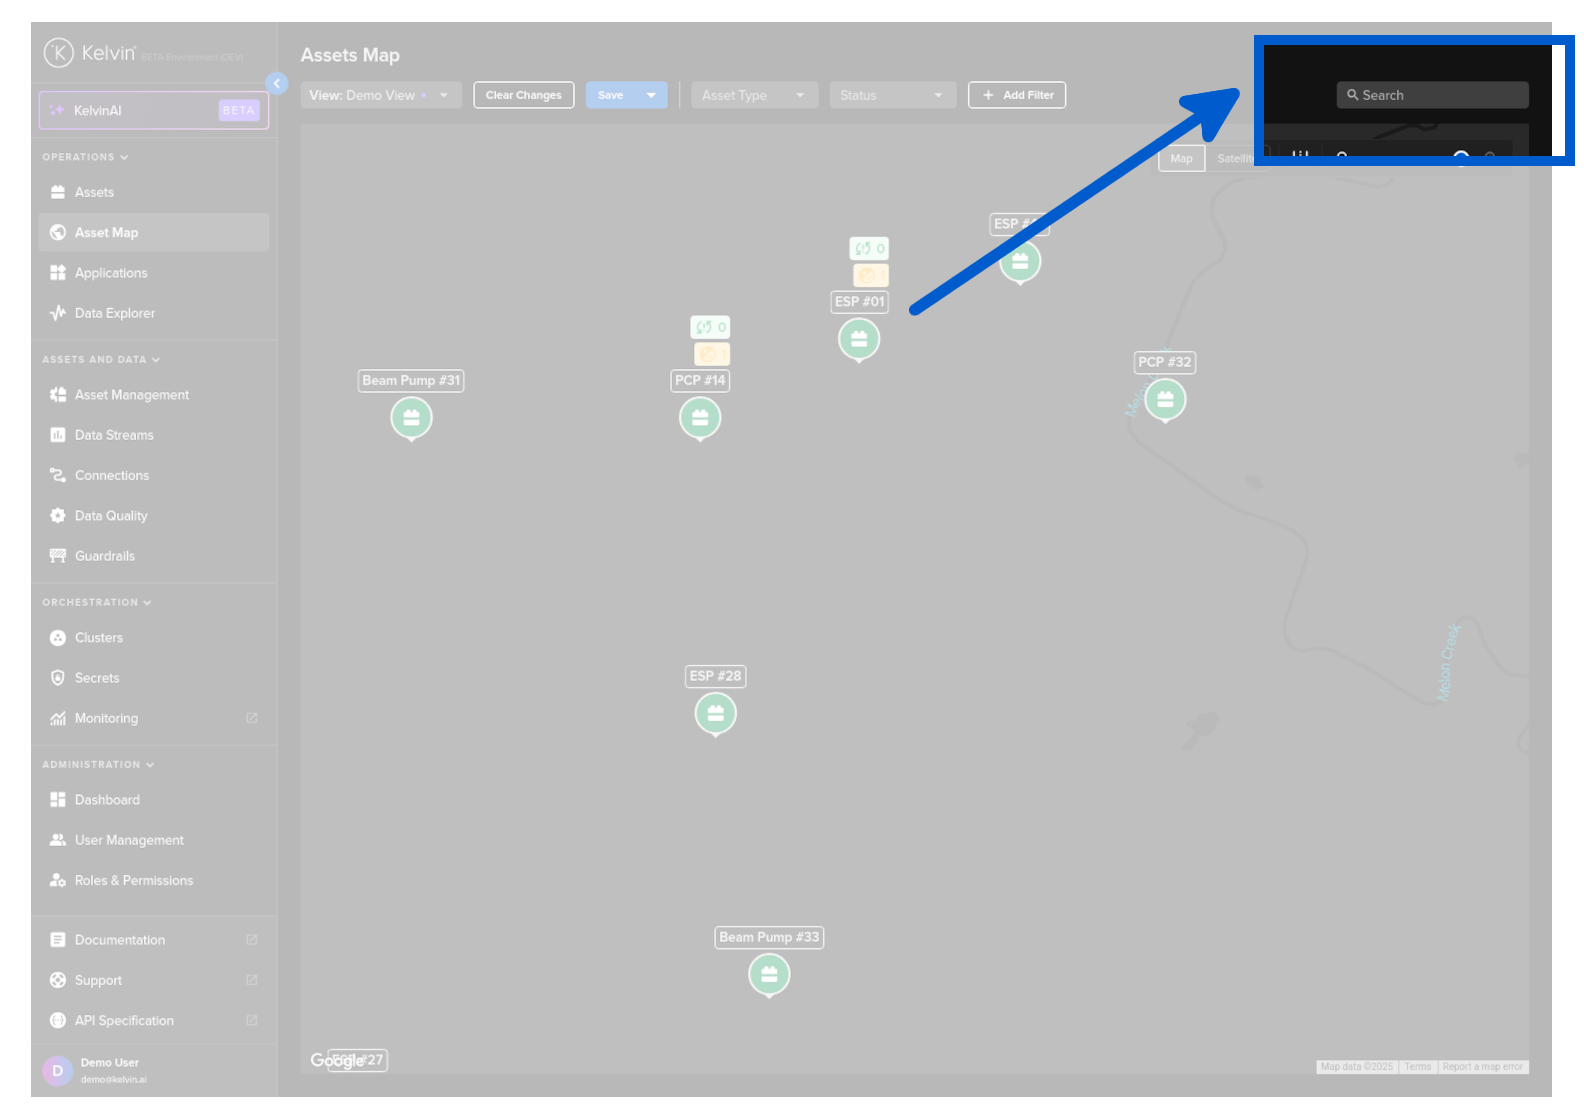
When dealing with large quantities of Assets, you can search for the Assets of interest.
This is dynamic and will update the list as you type.
Note
See full details on search in the Asset page documentation.
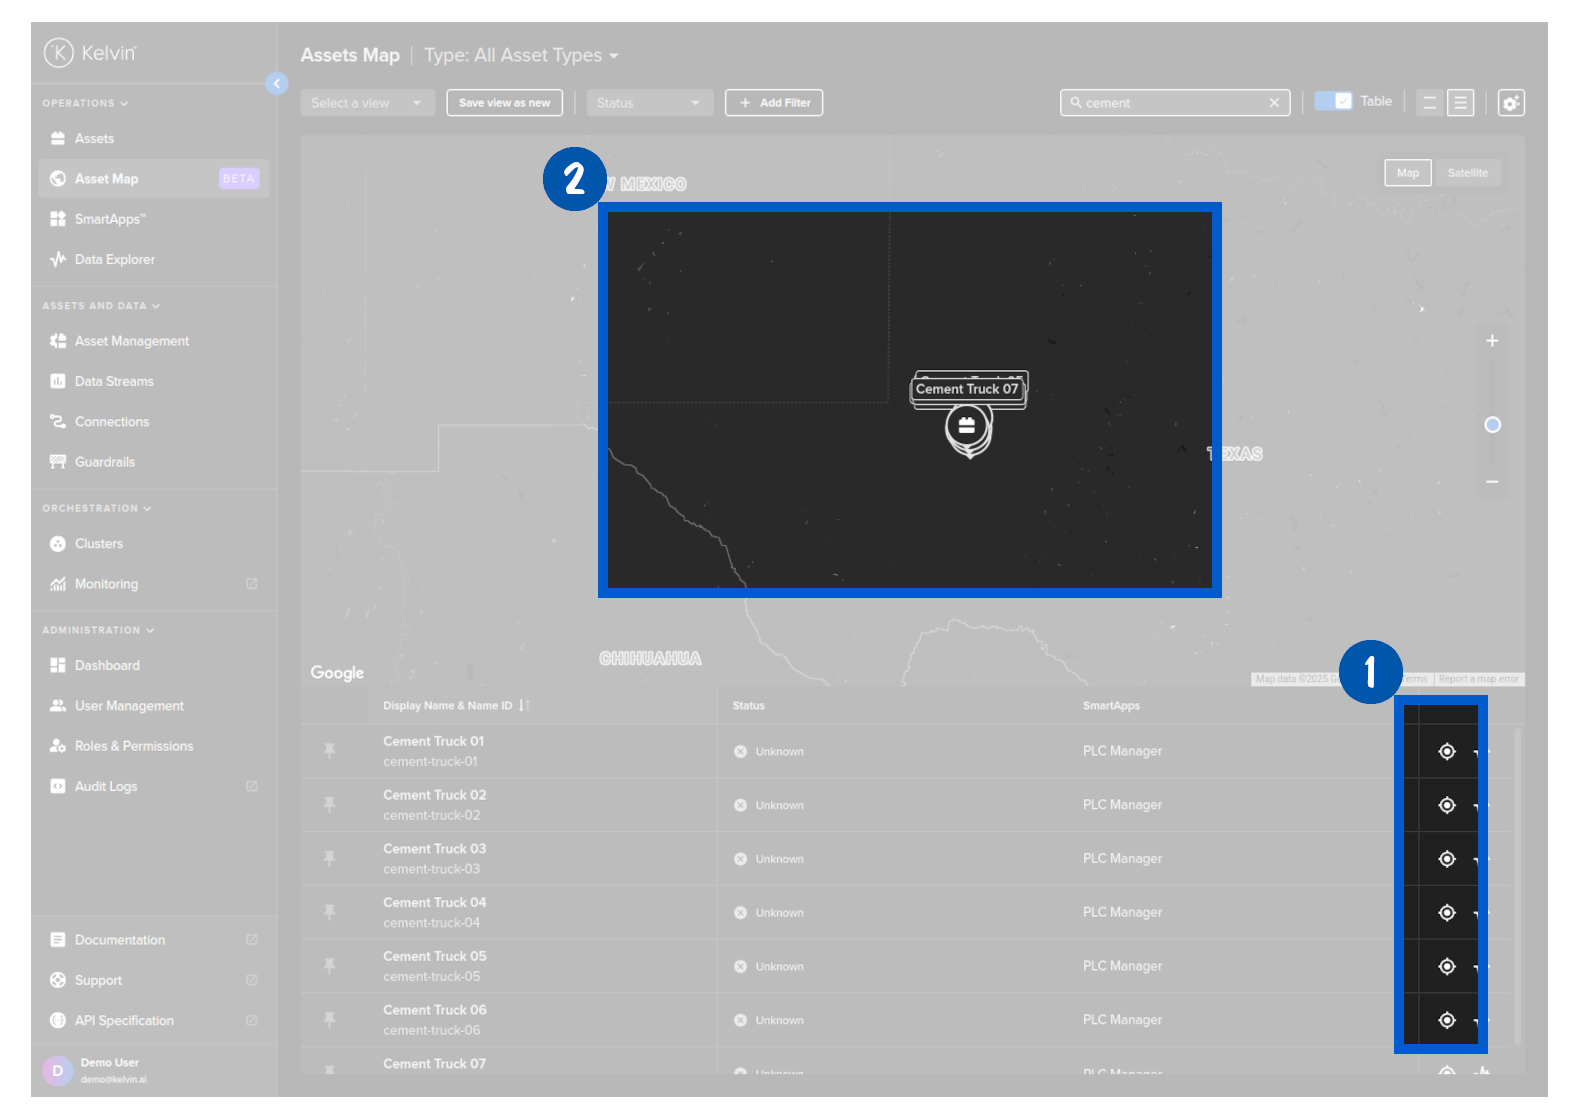
This will switch on the Asset list below the geospatial map.
From here you can click on the target icon on the right hand side to center the Asset on the geospatial map.
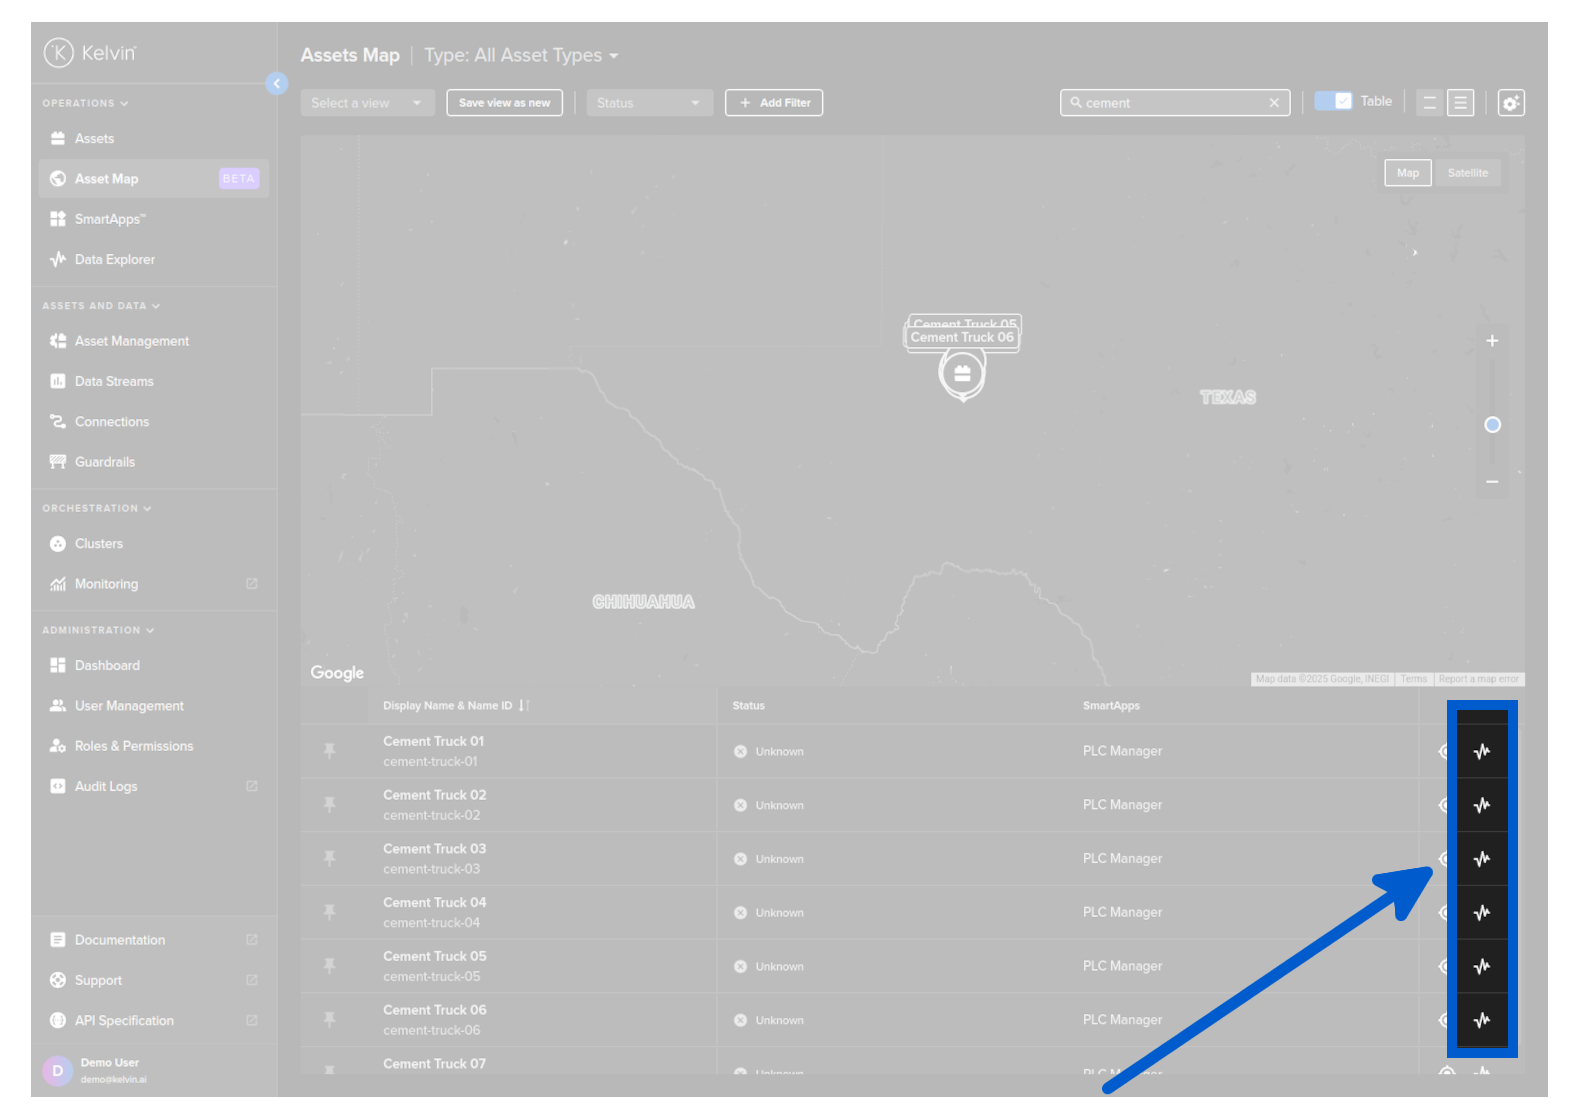
And you can go directly to the Data Explorer using the shortcut icon.
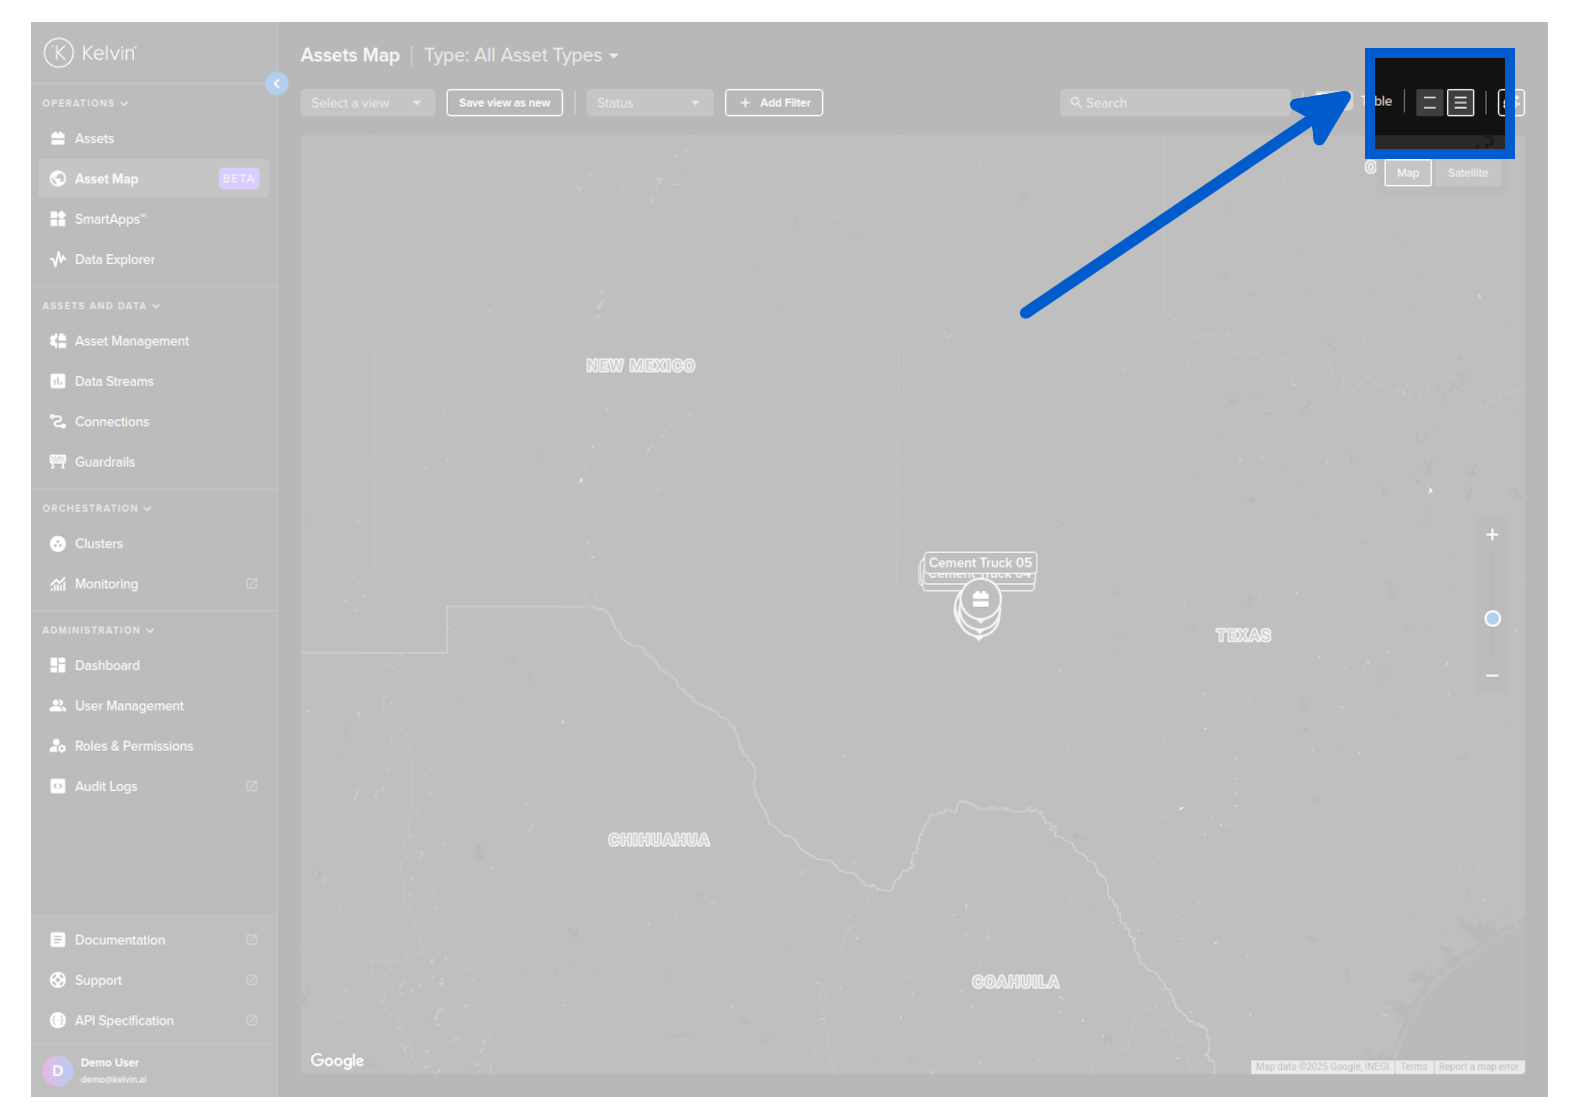
You can choose the height of the row to fit as many rows as possible on the screen, or space them out for easier readability.
Note
See full details on search in the Asset page documentation.
If you do any customization to the columns but do not save it as a view, you will lose your changes when you leave the Asset page.
If you want to keep your changes, make sure to save it as a View.
Note
See full details on search in the Asset page documentation.
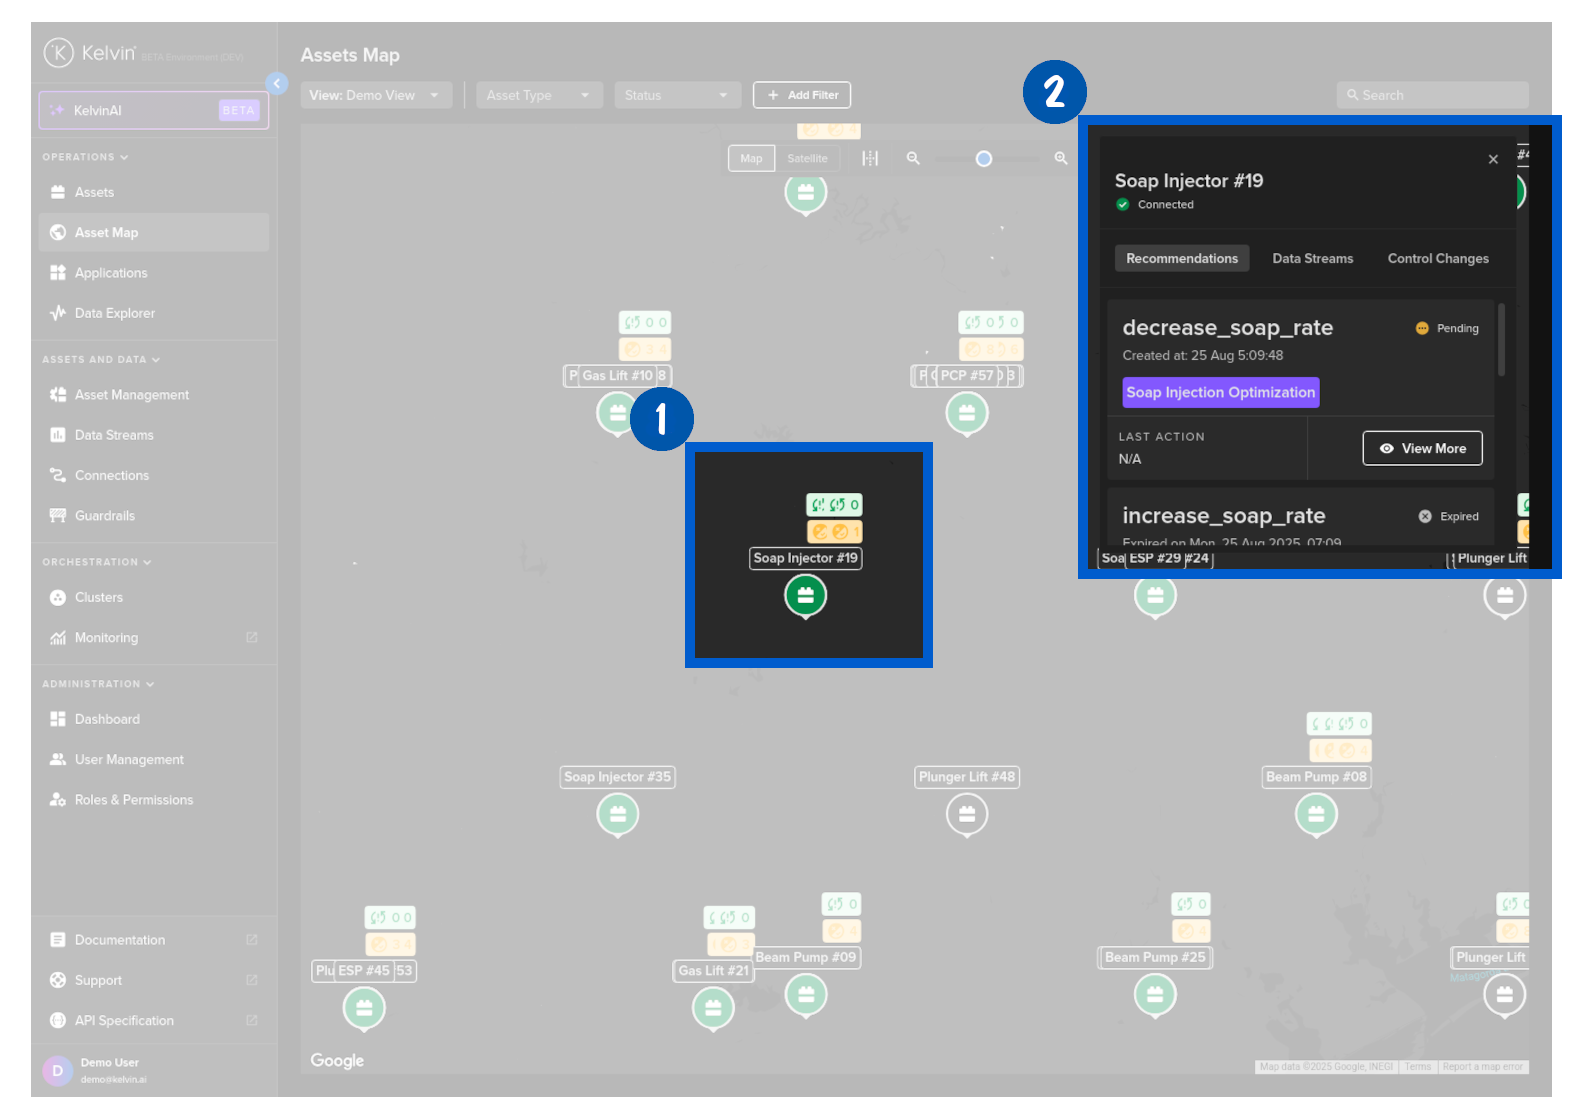
Asset-Specific Insights
Selecting an asset on the map shows asset-specific metadata including historical control changes and current Recommendations.