Monitor Kelvin SmartApp™
Now that your Kelvin SmartApp™ has been successfully deployed, it’s time to see it in action. We’ll guide you through how to visualize the recommendations and data, as well as provide troubleshooting with logs and telemetry of your Kelvin SmartApp™.
Visualize SmartApp Recommendations
To visualize the recommendations made by your Kelvin SmartApp™, go the the Kelvin SmartApp™ details.
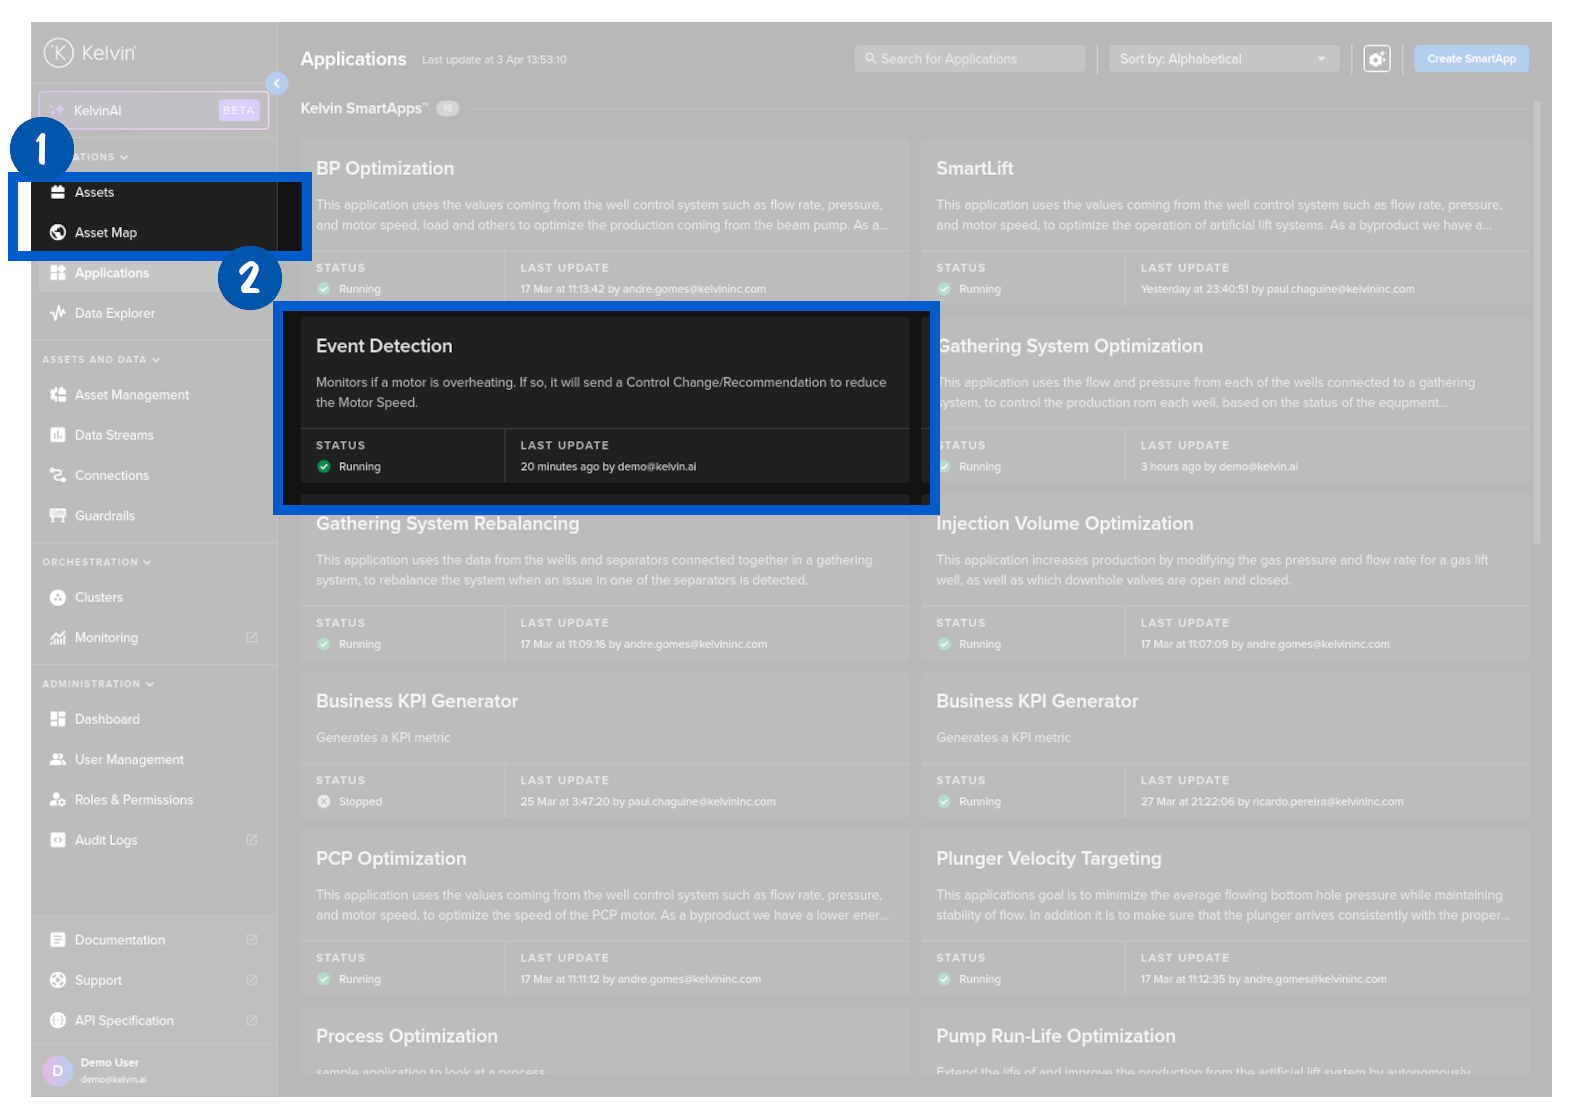
And click on the Assets tab.
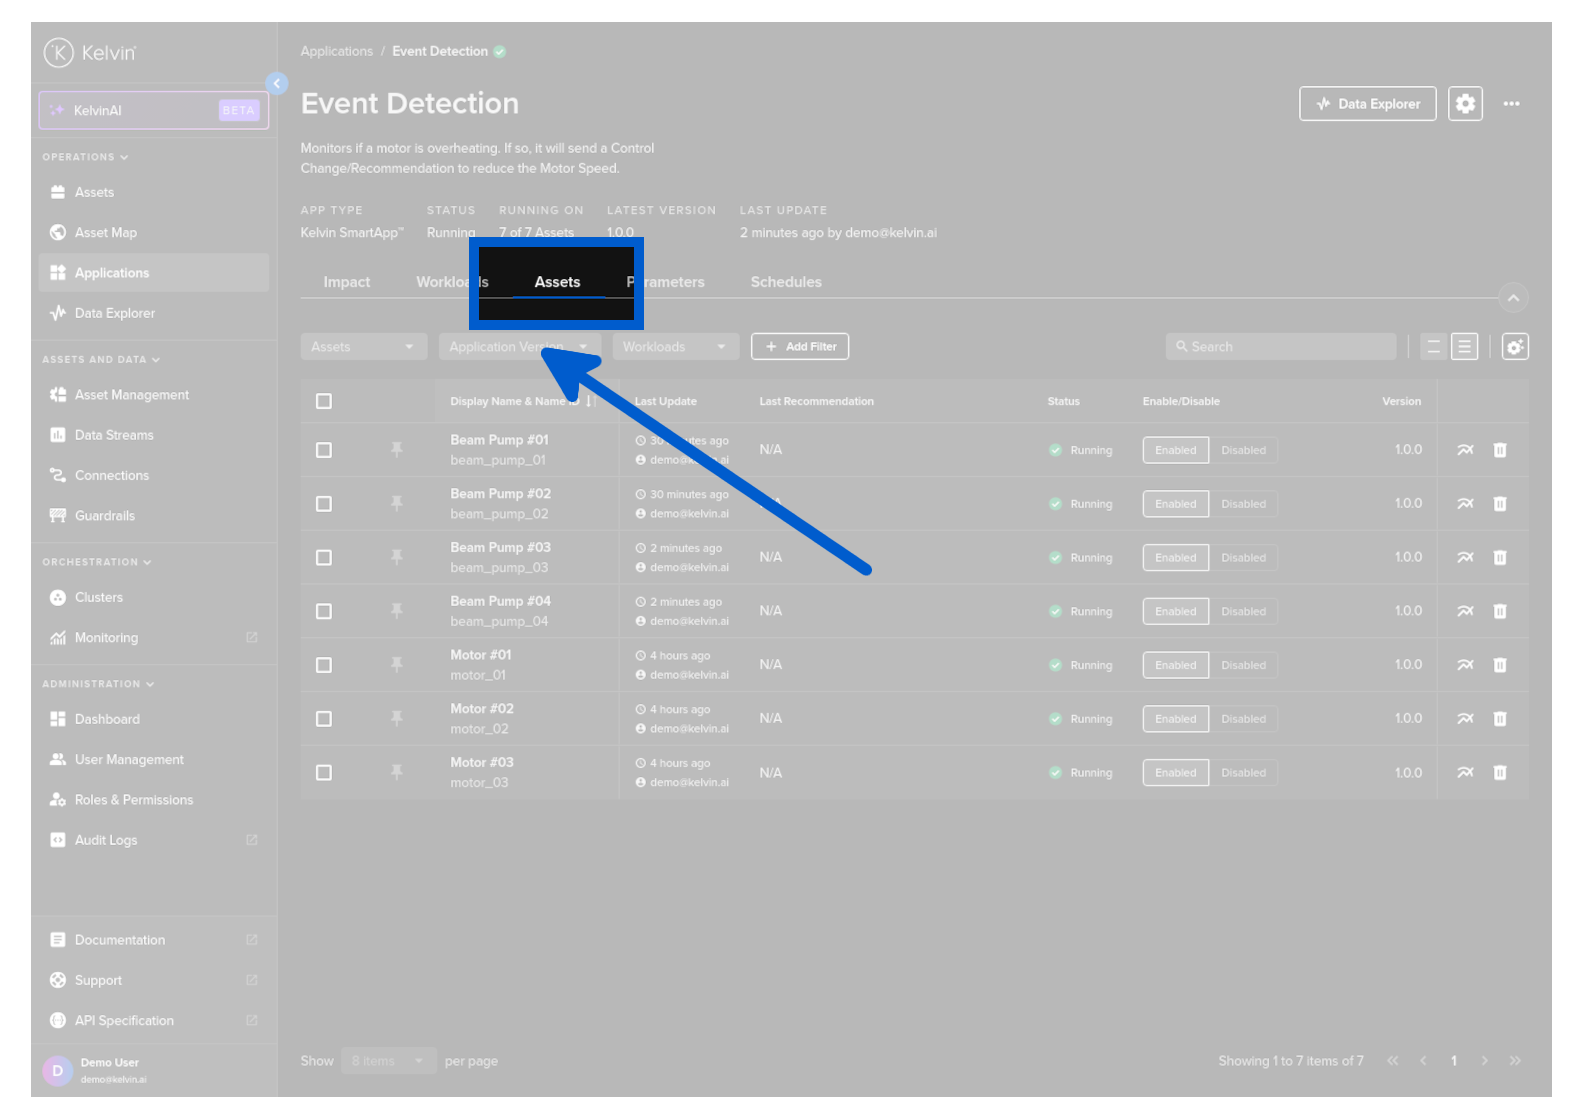
The Last Recommendation column shows you the latest Recommendation for each Asset:
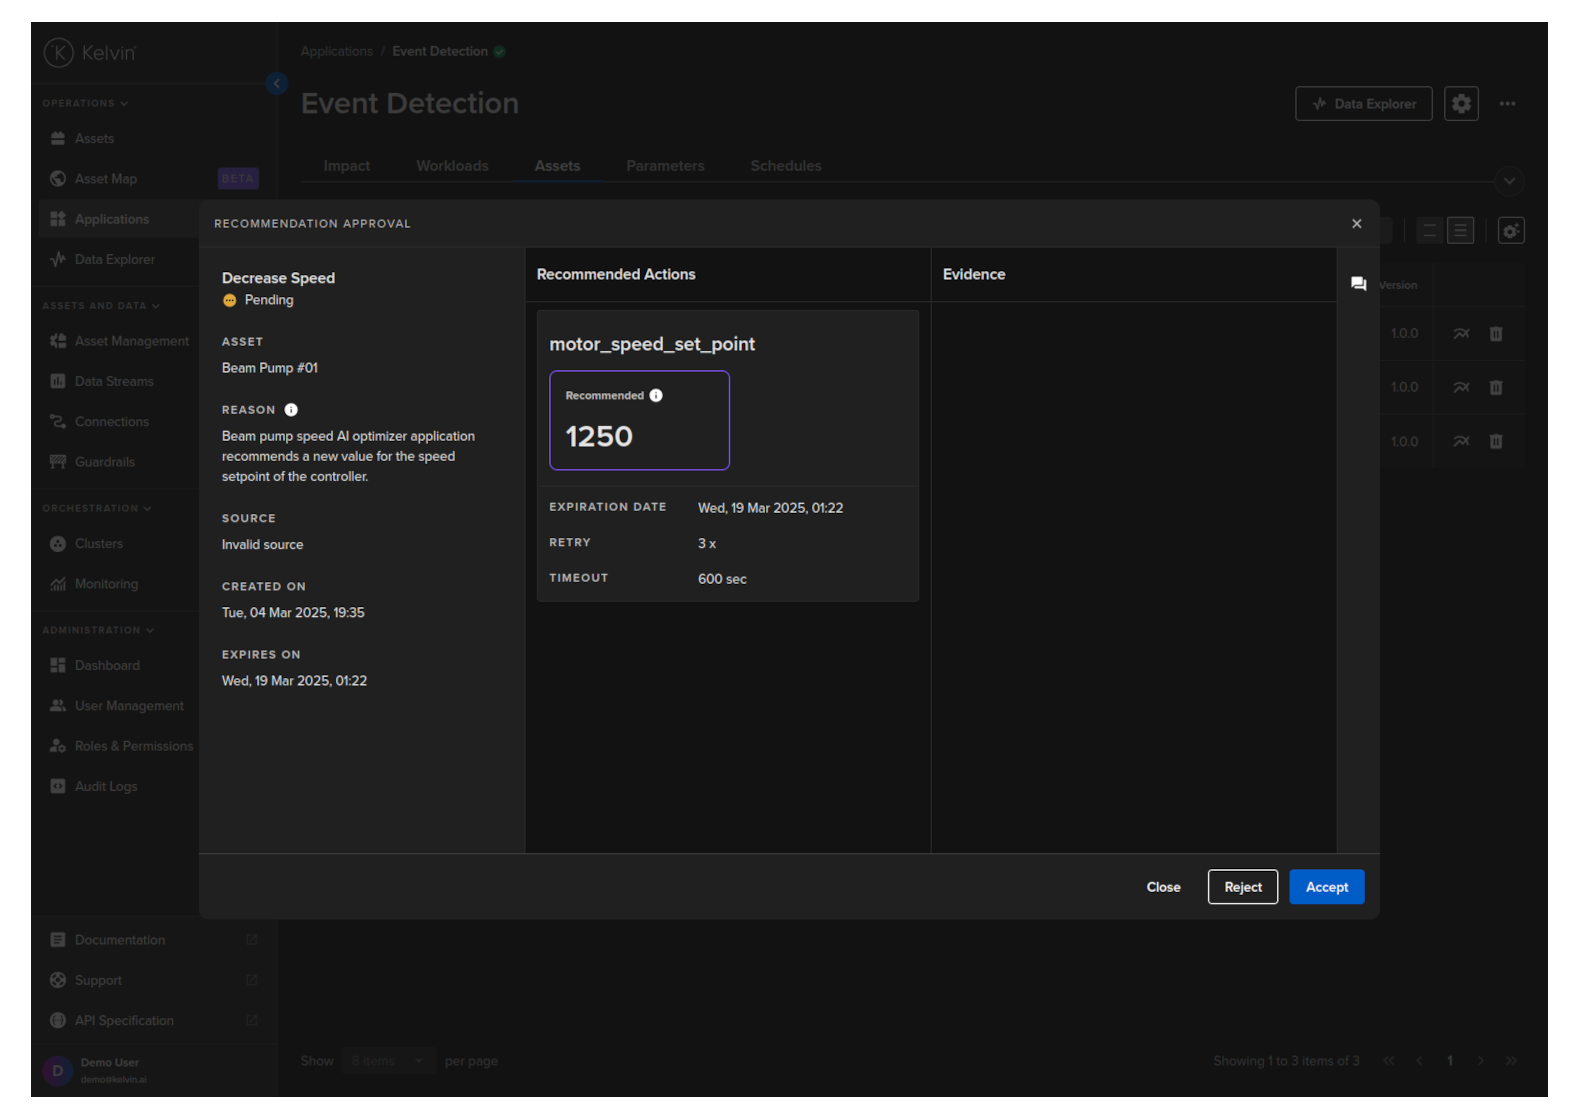
You can also click on the View More button
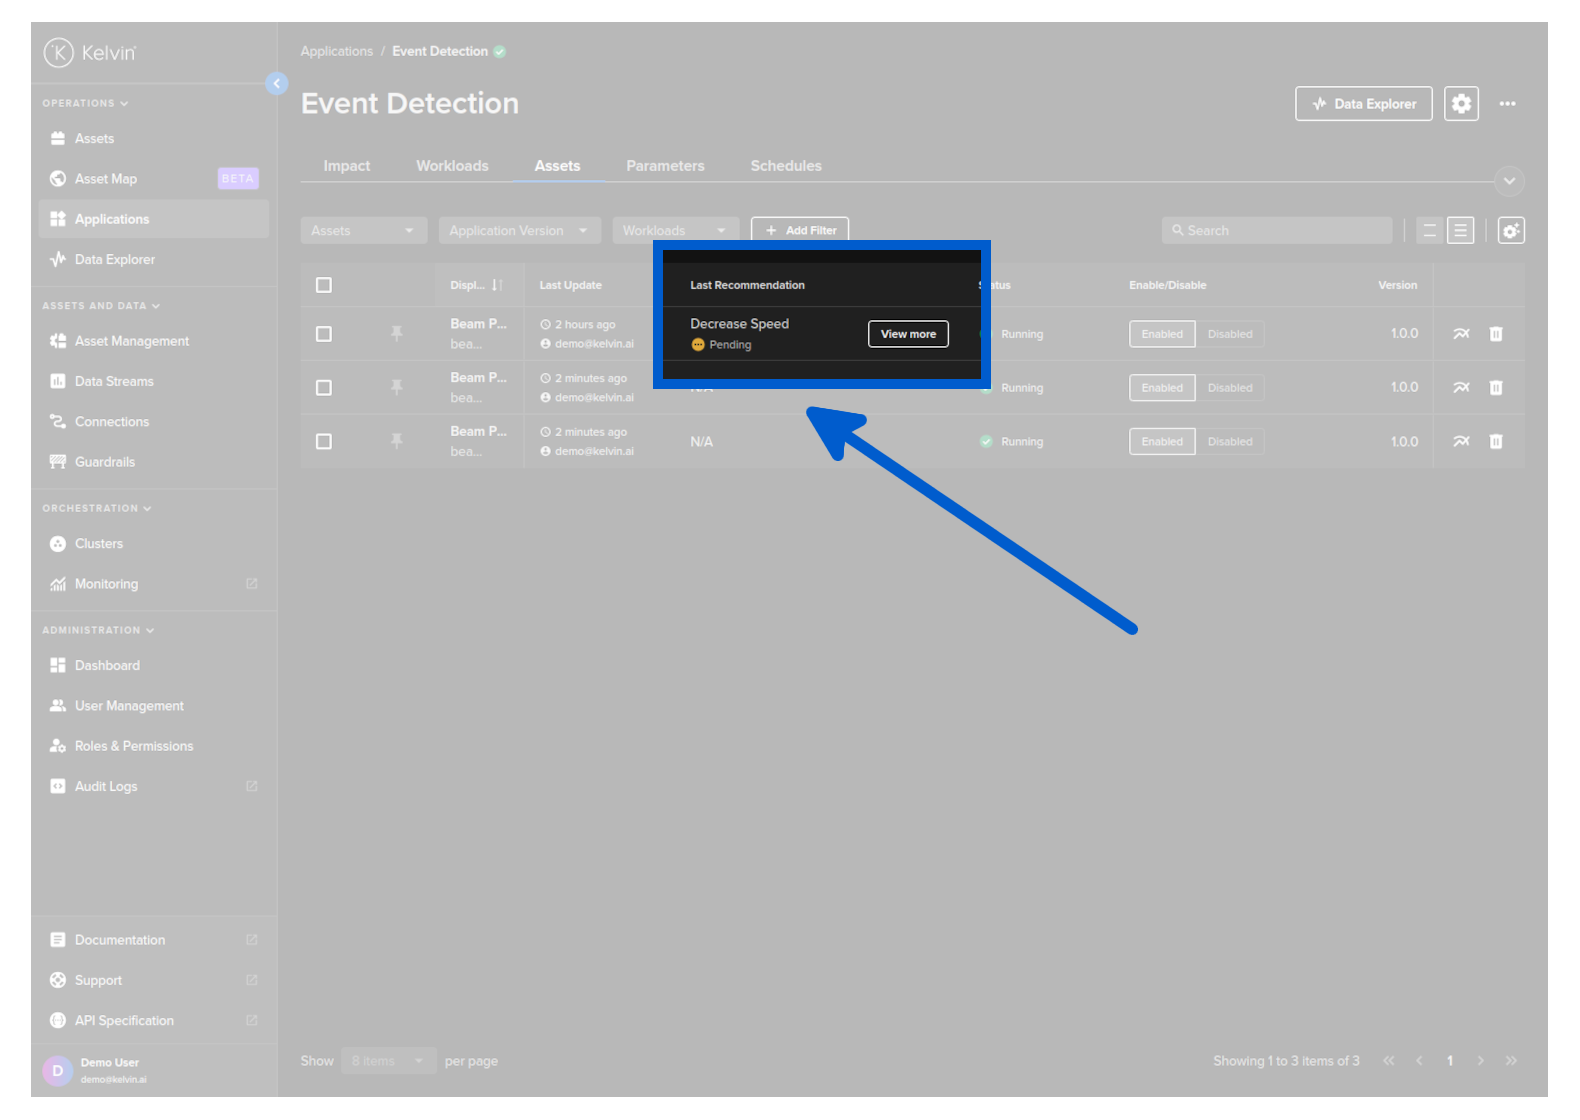
And see the details of the recommendation:
Visualize SmartApp Inputs and Outputs
Another important aspect of seeing your app in action is to visualize the data that your SmartApp is processing.
For that task, you can use the Data Explorer, a powerful tool that allows you to plot timeseries data and also visualize the control changes published by your Kelvin SmartApp™.
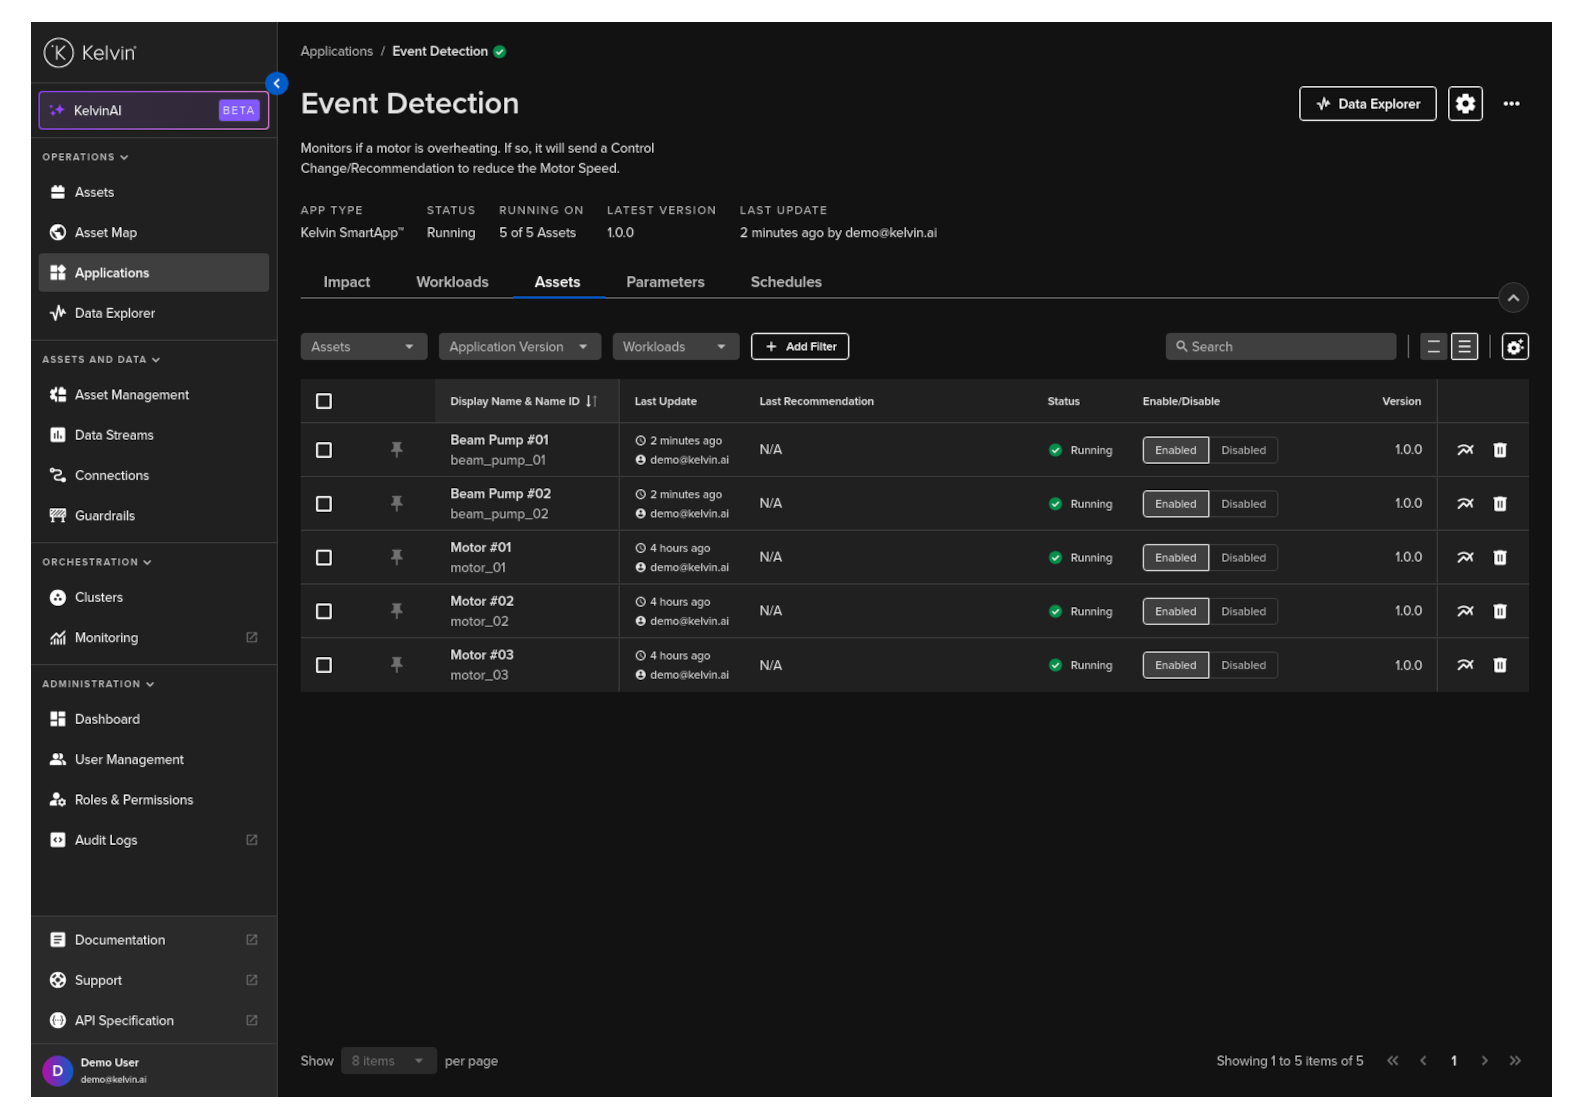
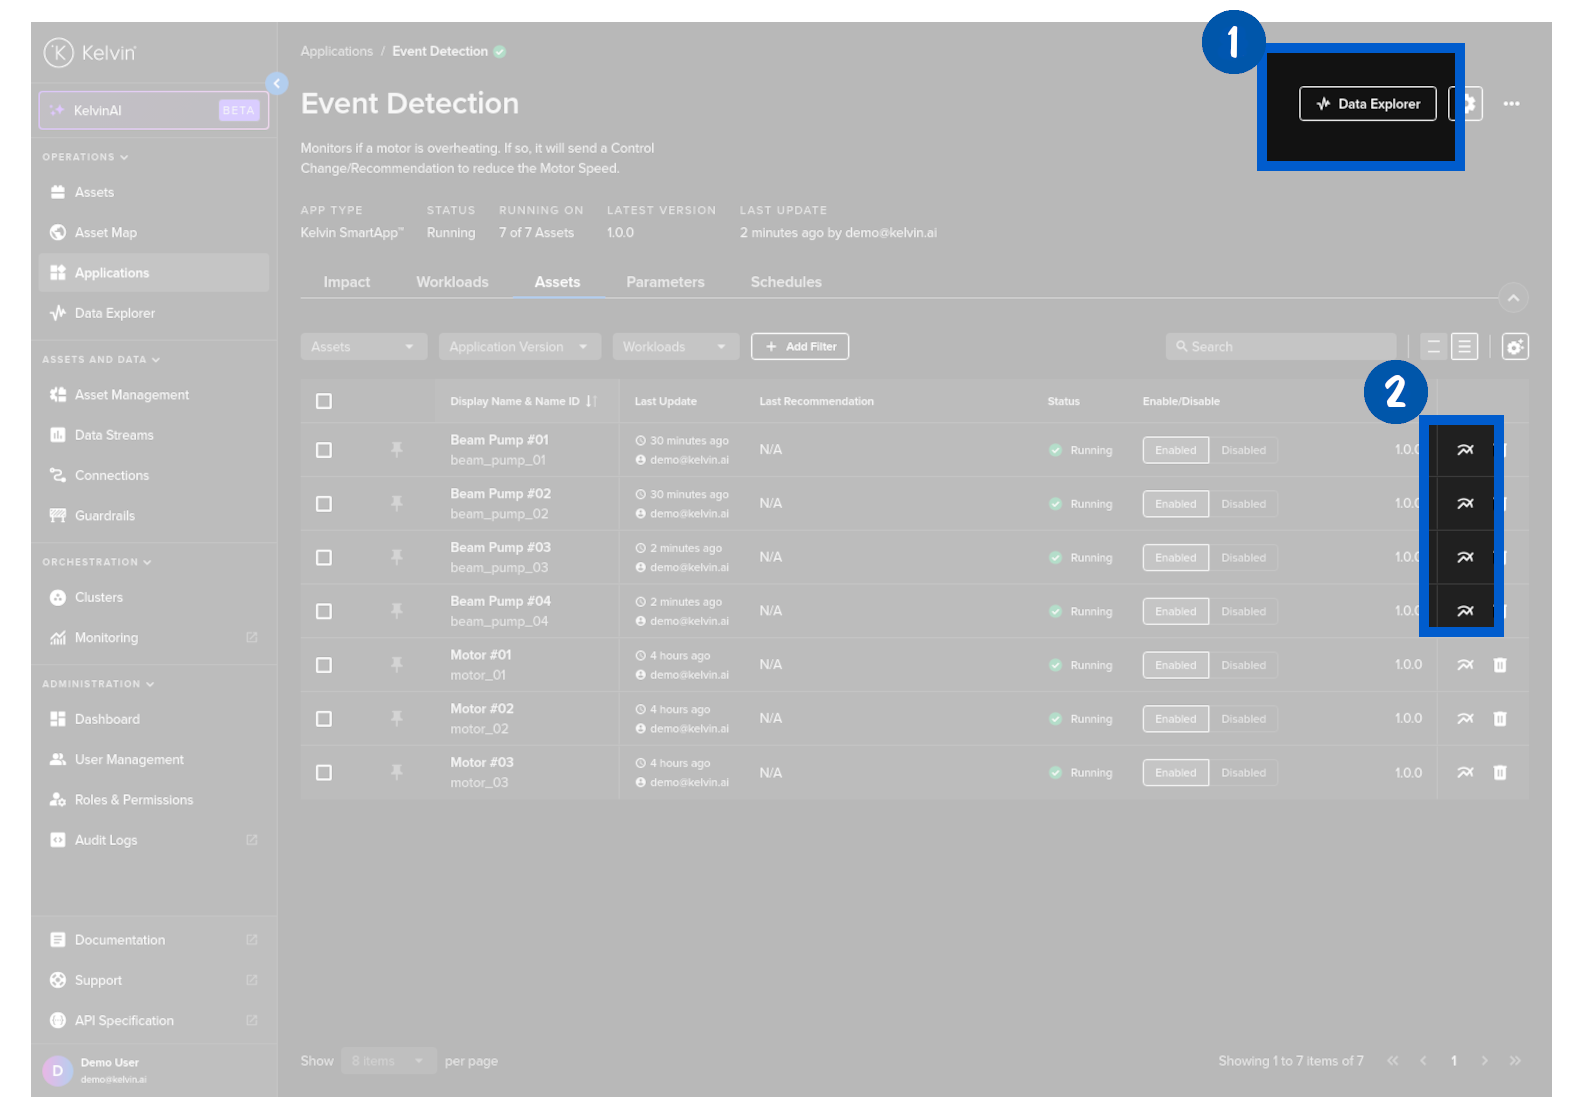
To do this, go to the Assets tab
And click on Data Explorer button at the top or a Data Explorer Icon ![]() on the Asset row you want to visualize the data.
on the Asset row you want to visualize the data.
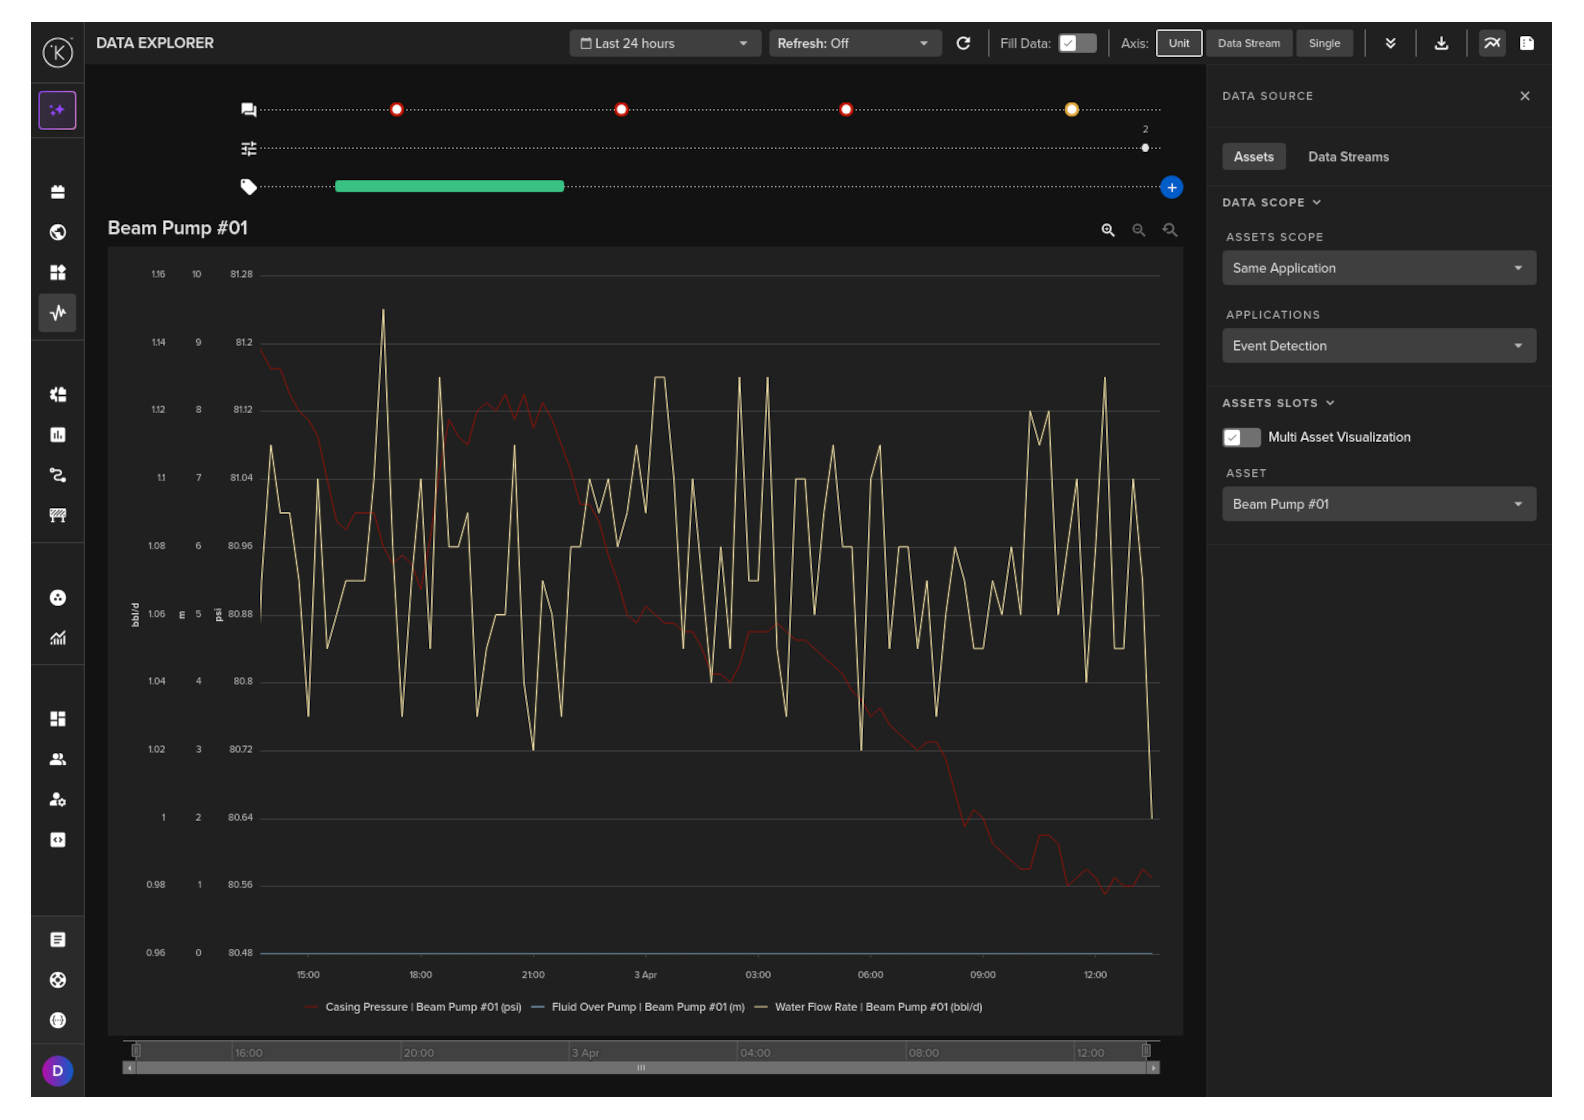
This will open Data Explorer with the asset automatically selected.
Info
If you do not see any data, click on the Data Streams tab on the right hand side and select the data streams that we can connected in the Inputs/Outputs during the Deployment phase earlier.
To understand more about the Data Explorer page
Congratulations! You've successfully visualized the data processed by your Kelvin SmartApp™ using Data Explorer.
Troubleshoot: Visualize SmartApp Logs
Kelvin SmartApps™ logs are automatically uploaded to the Kelvin Cloud.
To see the app logs, click on the Workload tab and then on the wanted workload name.
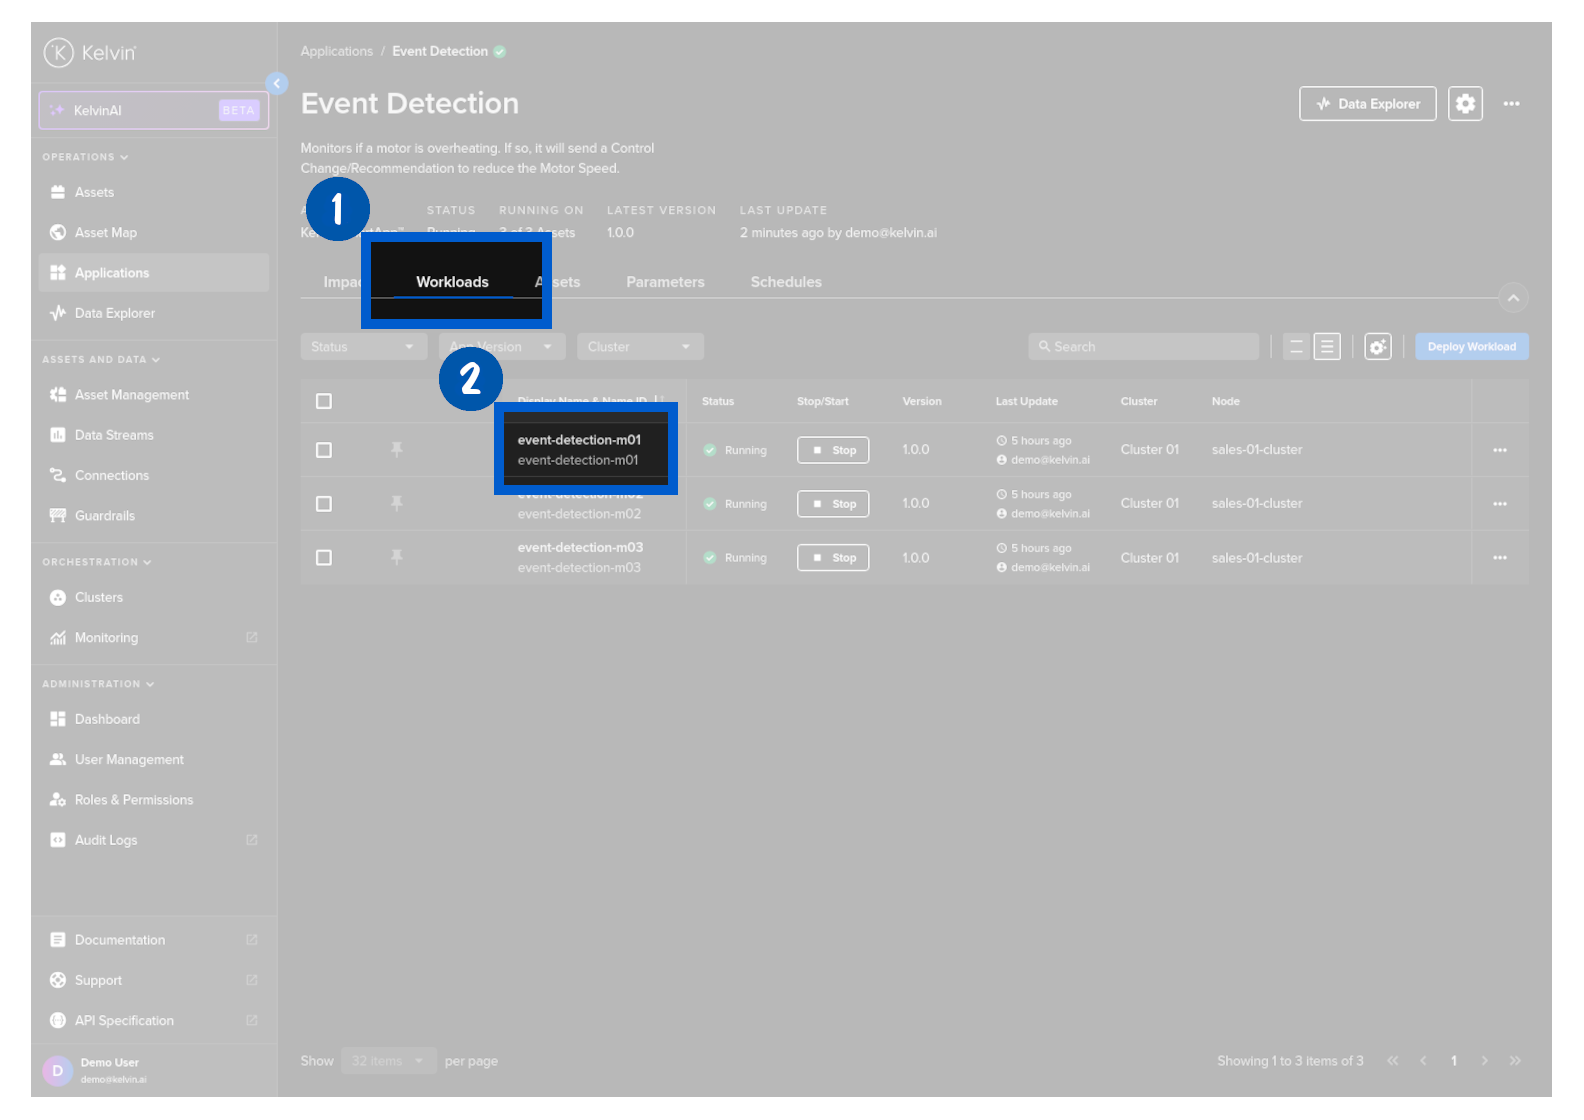
The Logs tab is automatically selected and will show you the logs.
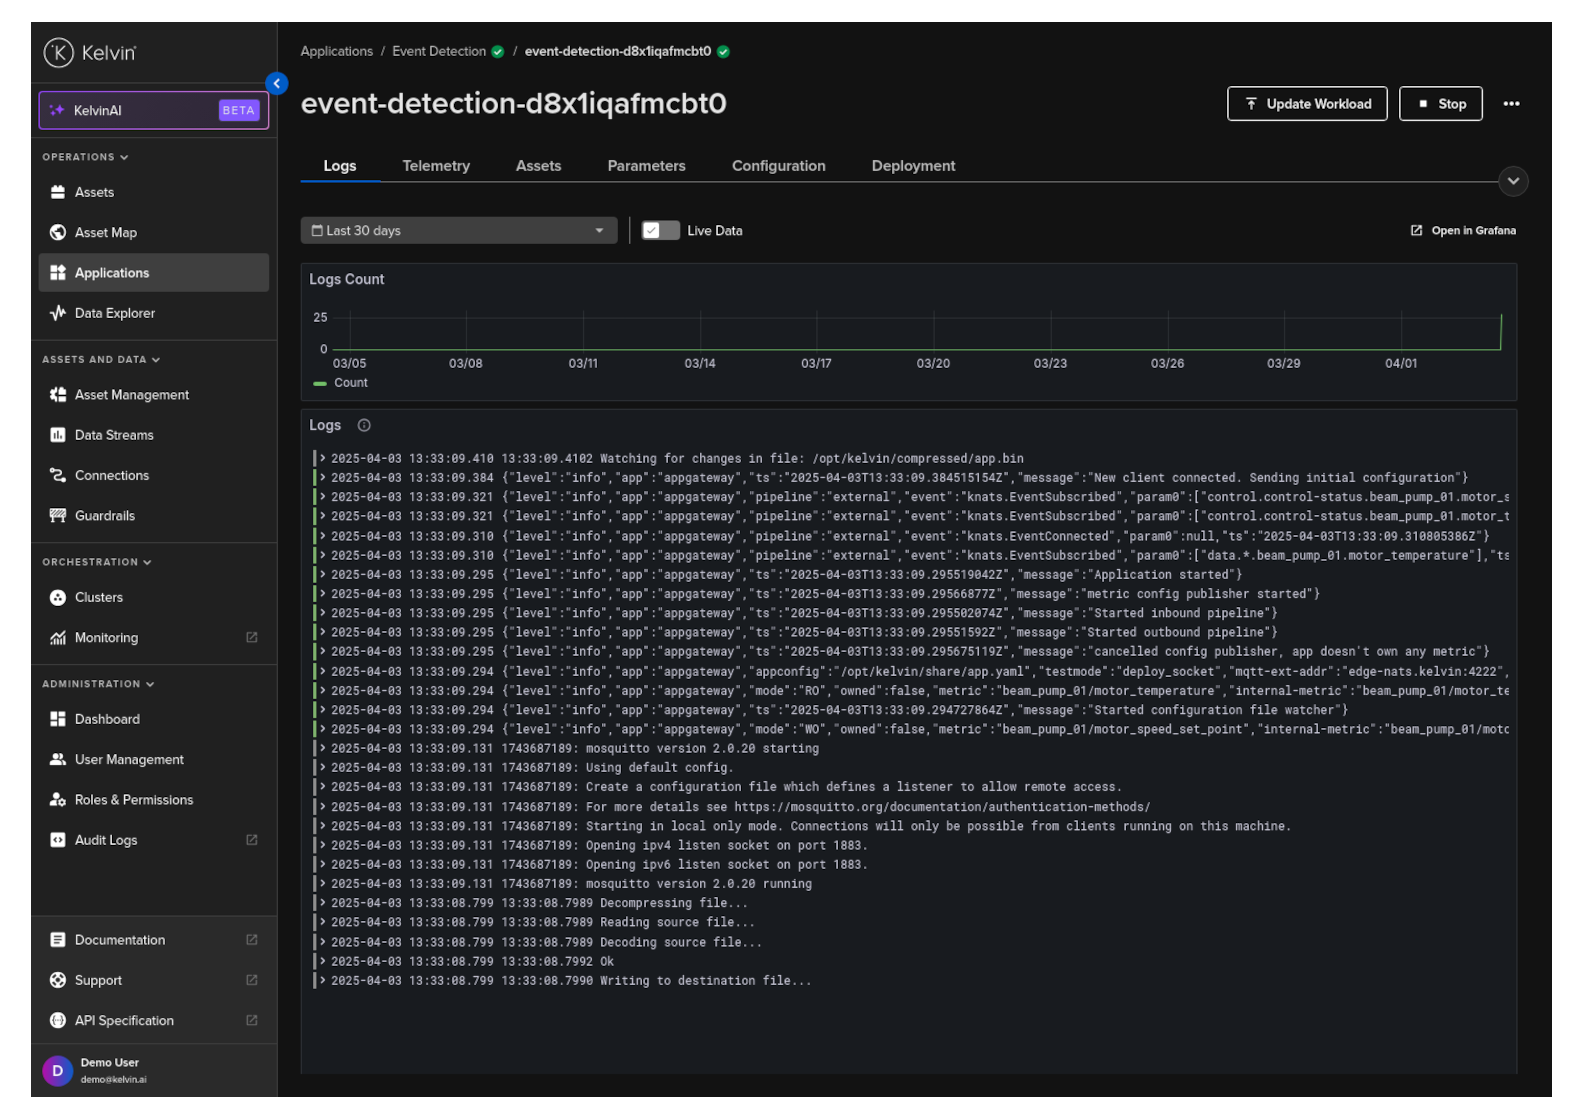
Congratulations! You've successfully visualized the logs of your Kelvin SmartApp™.
Troubleshoot: Visualize SmartApp Telemetry
Another aspect of monitoring your Kelvin SmartApp™ is to monitor telemetry data.
Kelvin SmartApps™ automatically uploads information related with CPU, Memory and Network usage. These metrics can be used to assess the performance of your app and to debug any issues.
To see the app logs, click on the Workload tab and then on the wanted workload name.
Then click on the Telemetry tab which will show you the telemetry for the workload.
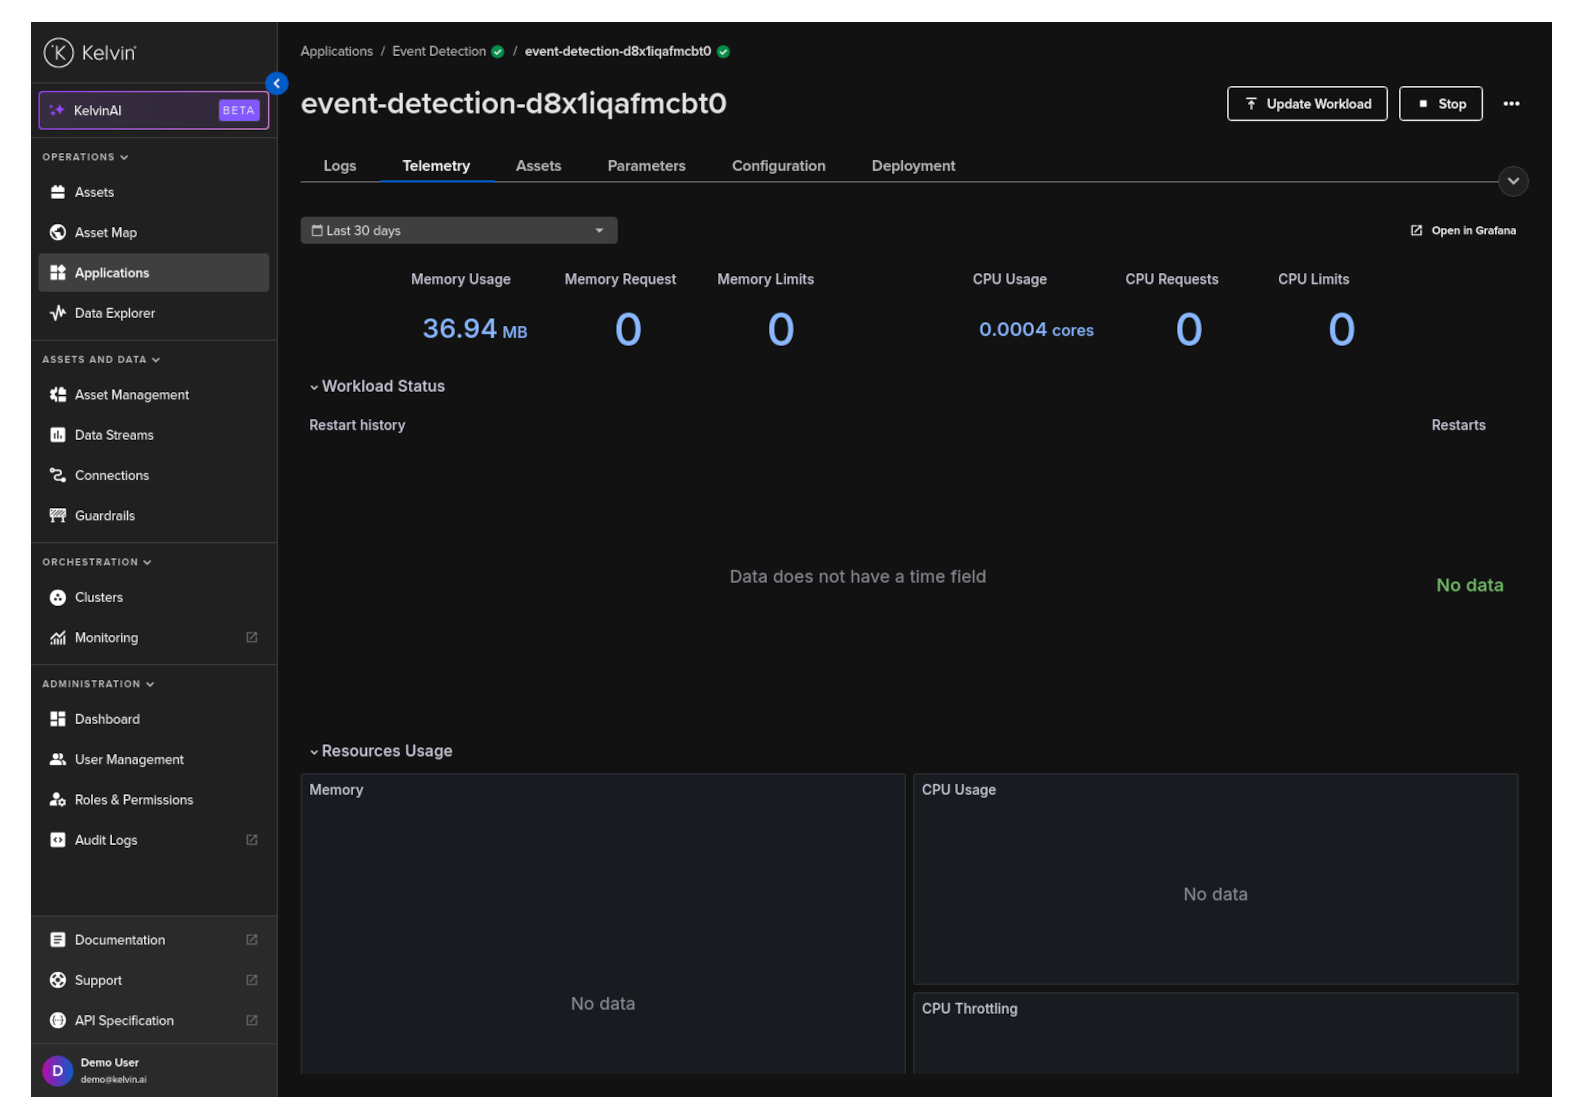
Congratulations! You've successfully visualized the telemetry of your Kelvin SmartApp™ using Grafana.
All done!
Congratulations! You've successfully created, uploaded and deployed your first Kelvin SmartApp™. You are now ready to start exploring other topics within Kelvin.