View Workload Telemetry
You can see the telemetry of a workload for any Application in the Kelvin UI.
Click on Applications, select the Application card, then navigate to the Workload tab to view the list of workloads for that Application.
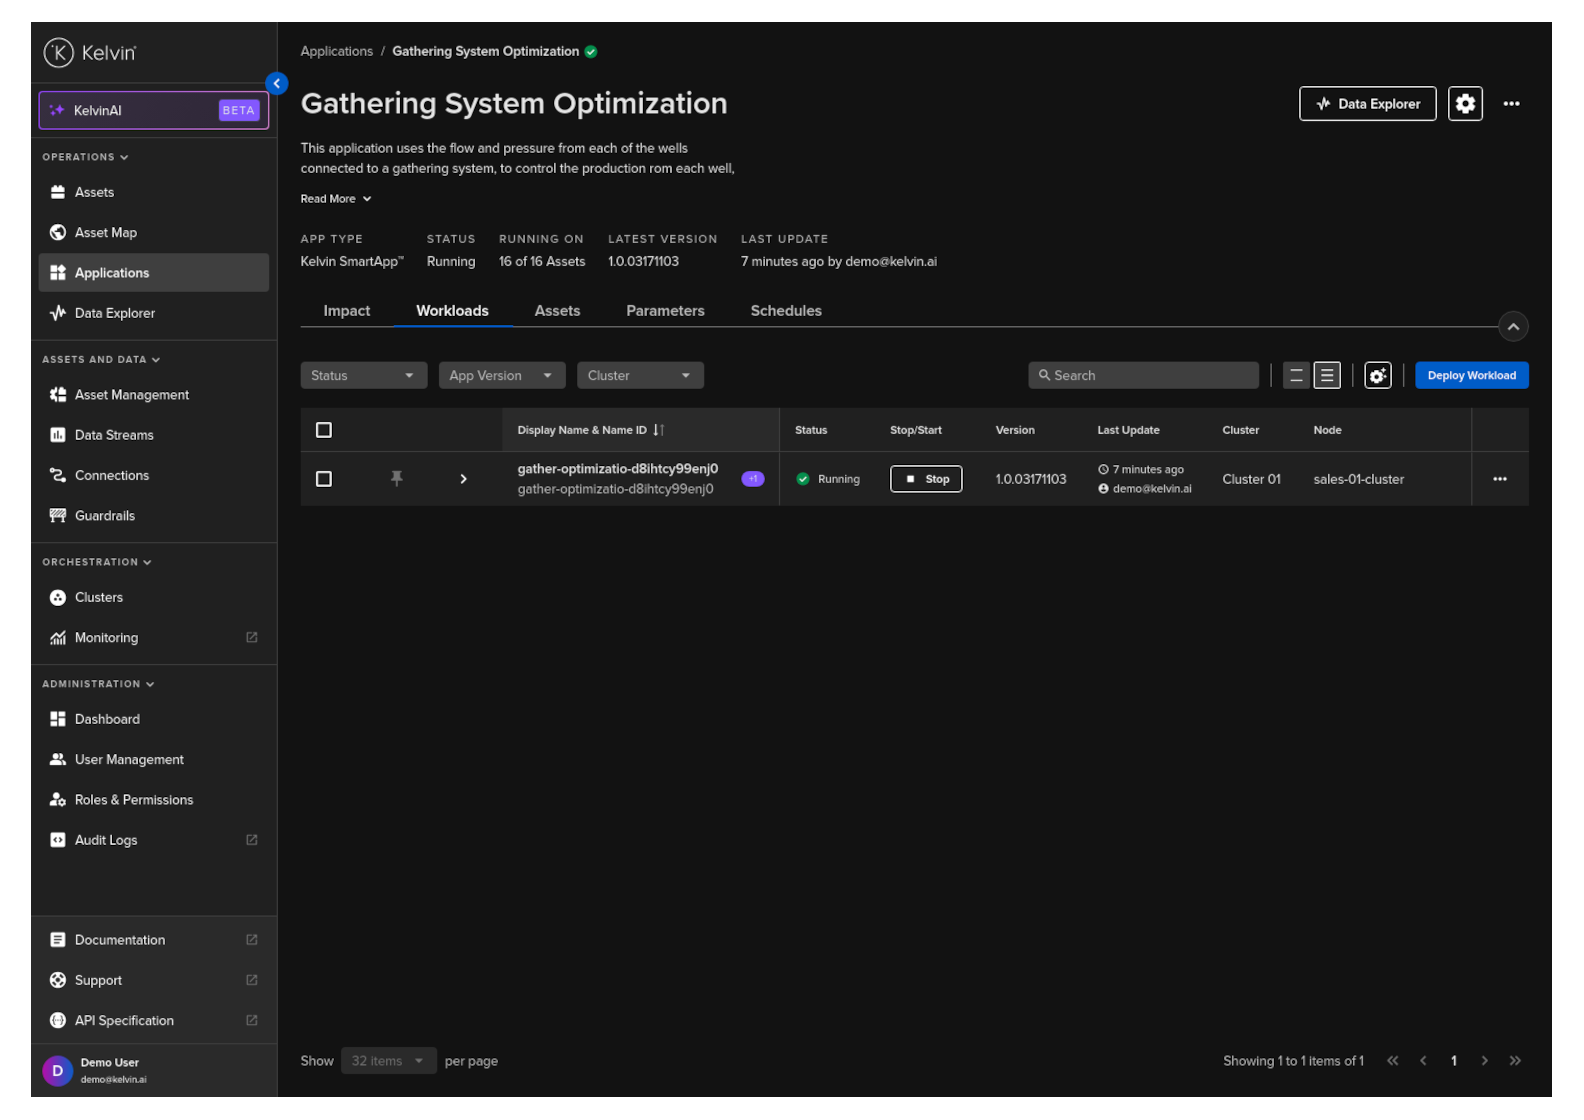
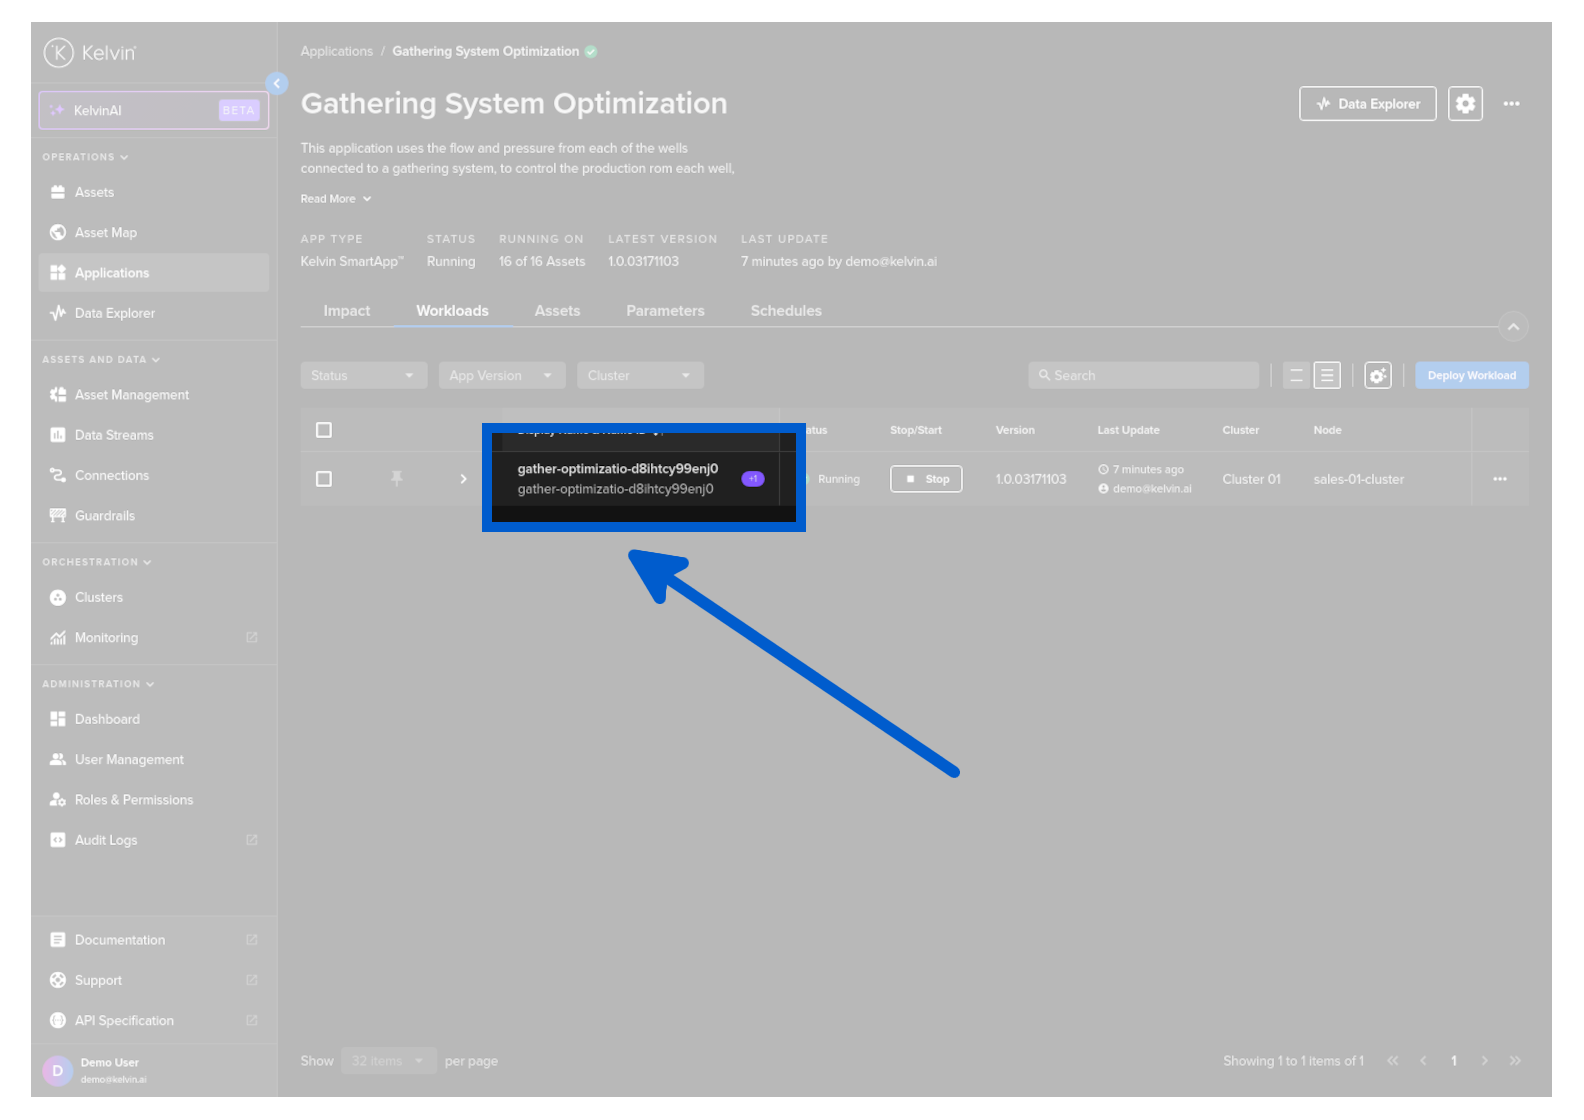
Then click on a Workload name.
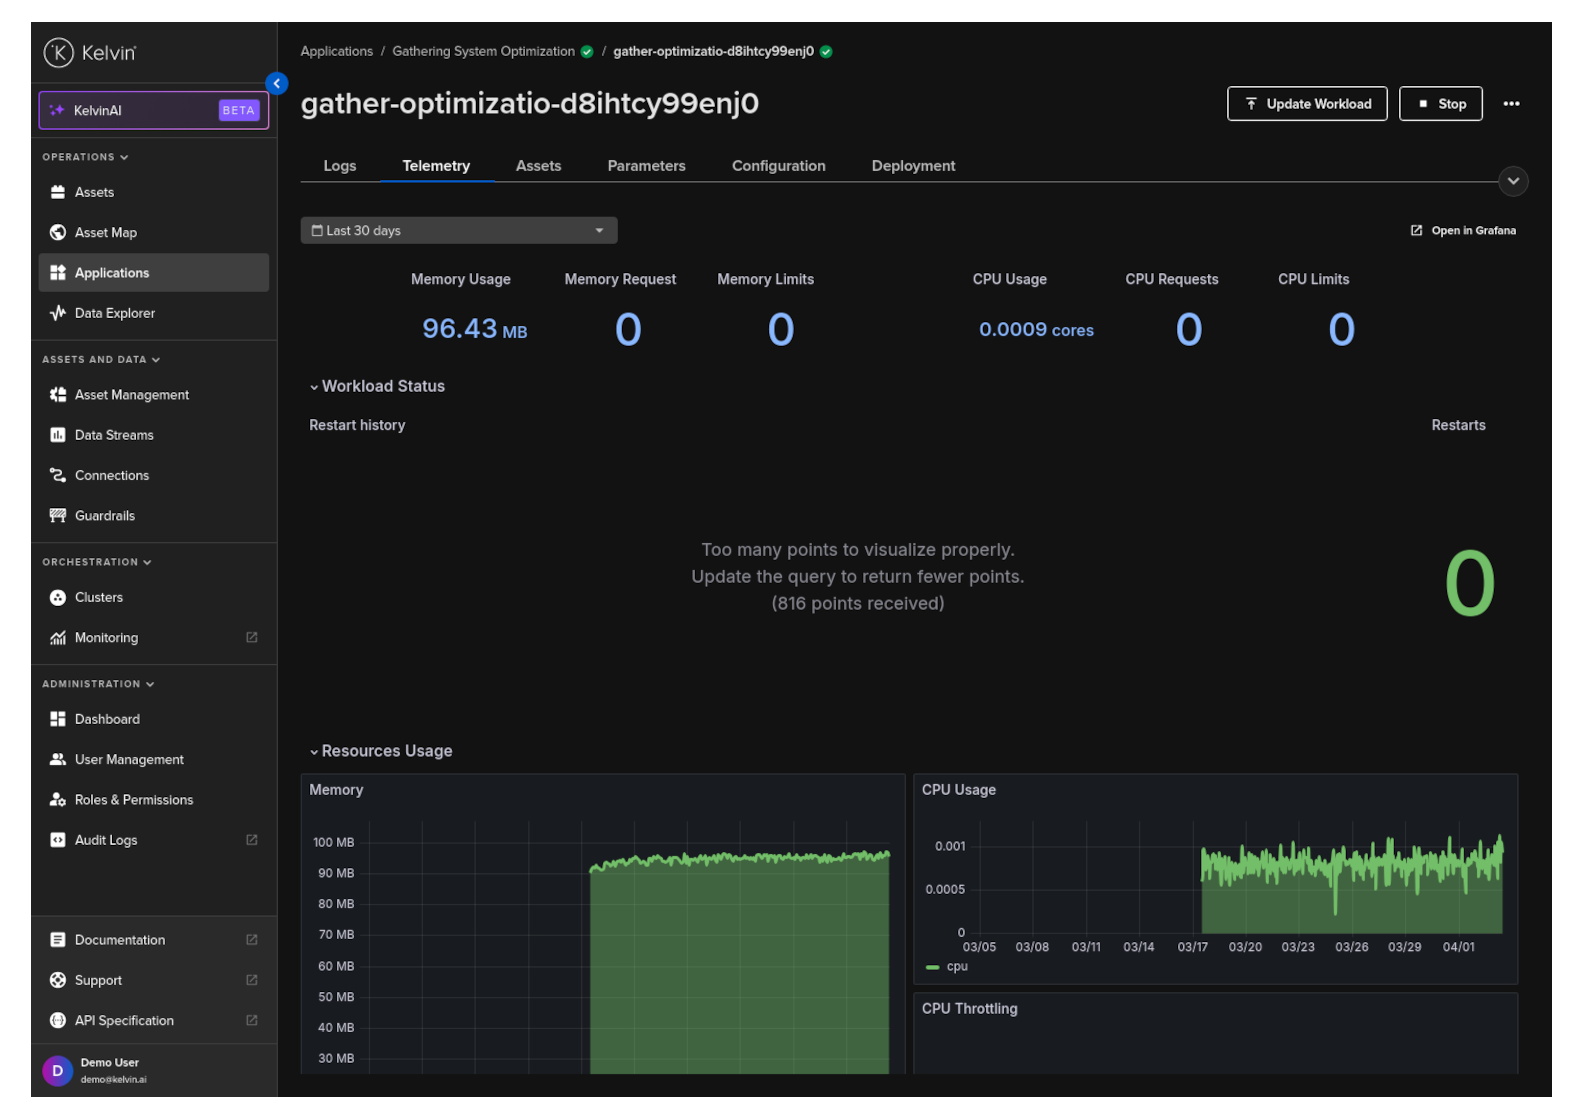
Then click on the Telemetry tab.
Here you can view all the telemetry information.
- Memory Usage, Requests and Limits
- CPU Usage, Requests and Limits
- Network Usage, Received and Transmitted
- Storage IO
- IOPS and Throughput