Asset Profile
The Asset Profile page is where the data emitted and uploaded from the Asset can be visualized.
This page displays the outputs of all the workloads running on the Node. More information about Workloads can be found in the Control Center Documentation
Info
Only metrics that are uploaded to our cloud storage will be shown in the Data-viewer
The Asset Profile page is divided in the following sections:
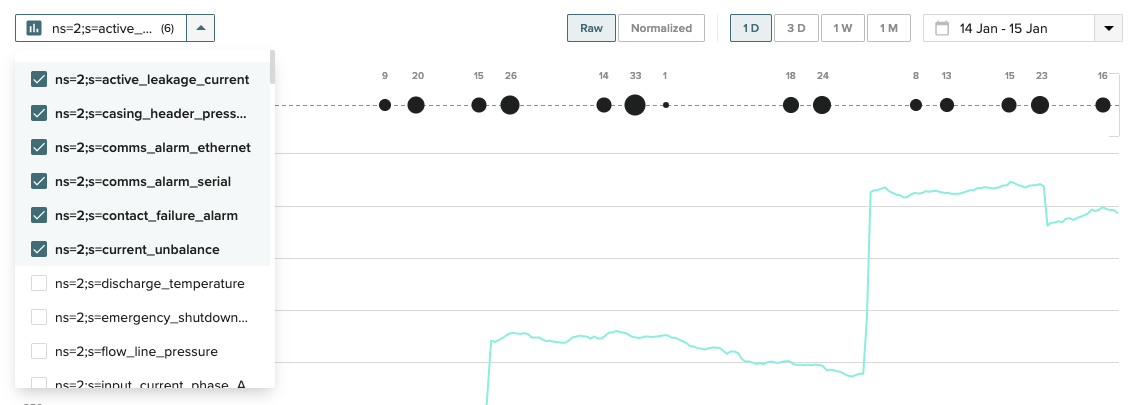
- Overview - A set of fixed metrics, showing their last uploaded value.
- Chart - Time series representation of the chosen list of metrics.
- Activity Lane & Activity Drawer - The representation of Data Labels (events) in context with the time series data.
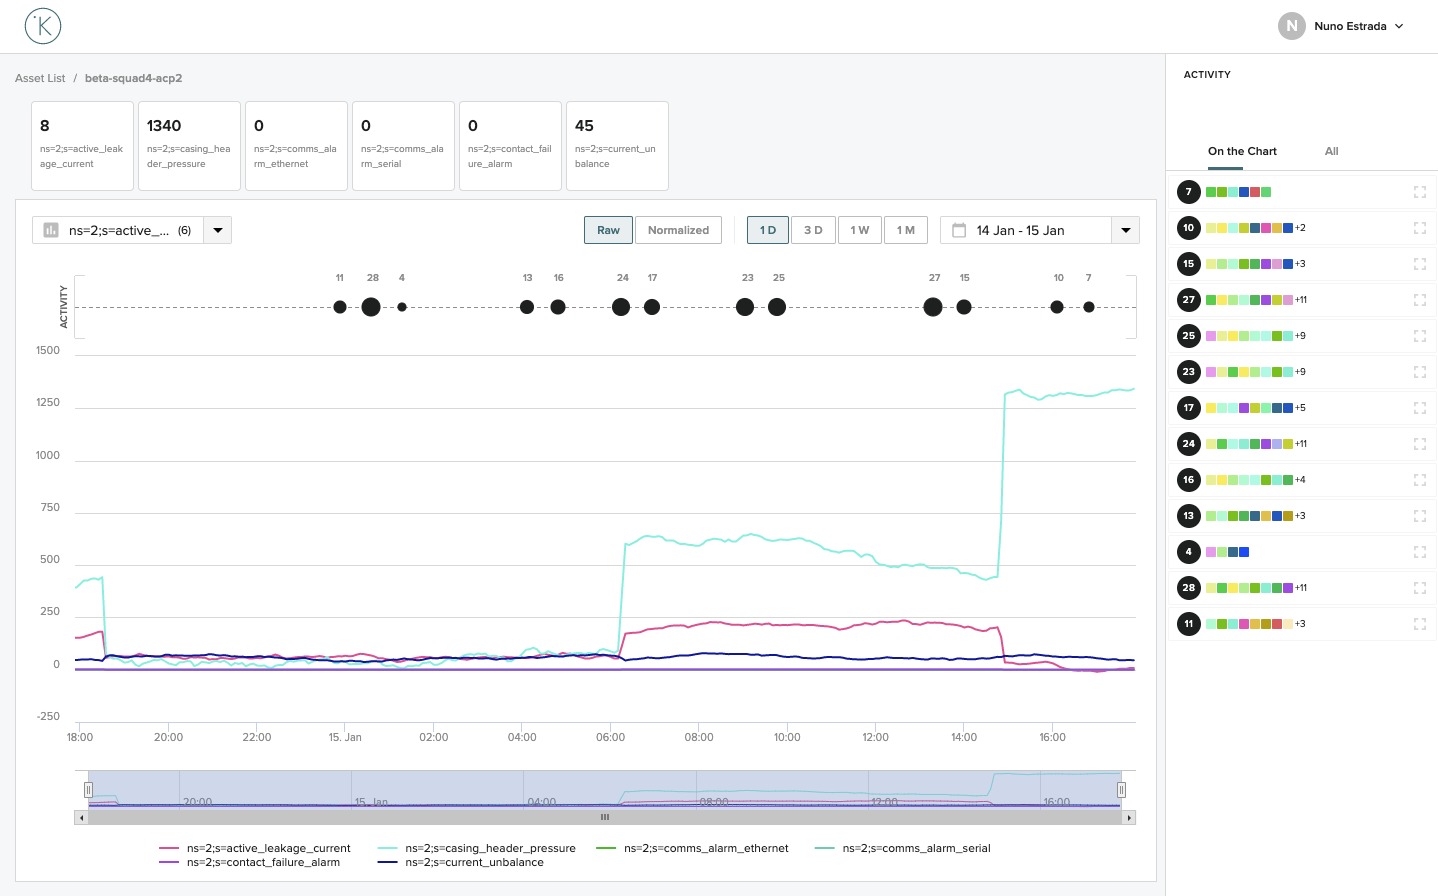
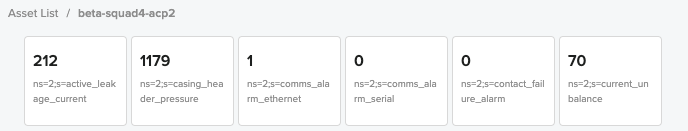
Overview
The Overview Section shows the last uploaded value for the first 6 metrics from the list of metrics. This section is updated every 30 seconds.
Info
The Metrics displayed on the overview section can be configured using a View Template
Chart
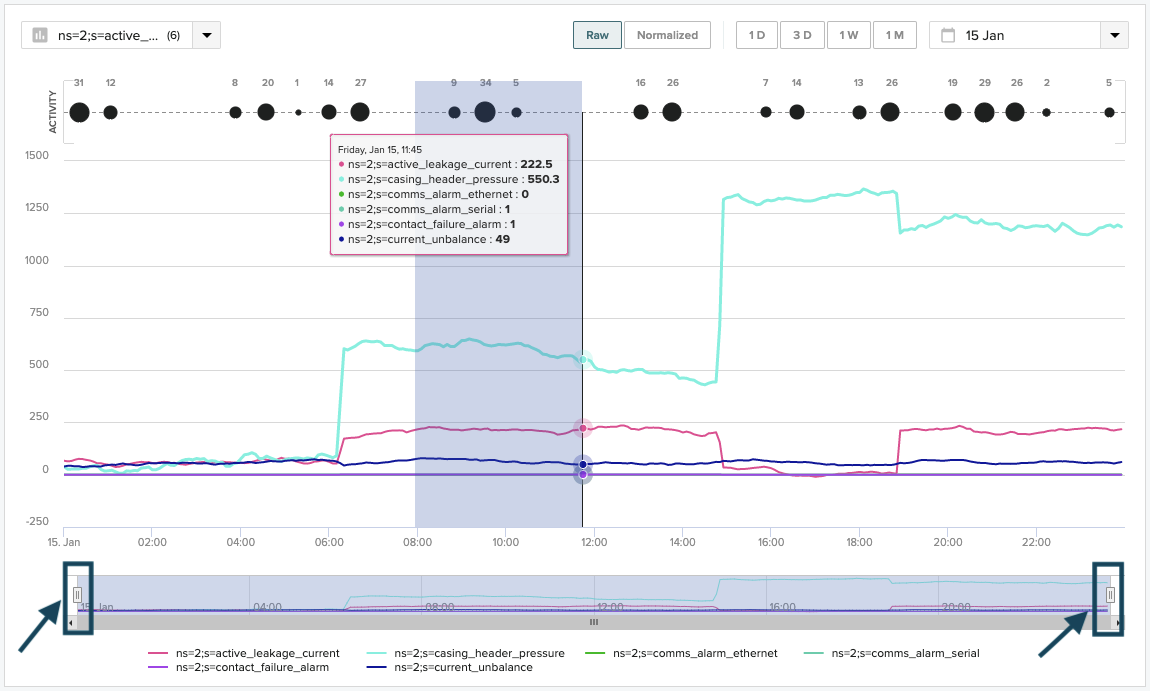
The chart section shows a time series representation of the data.
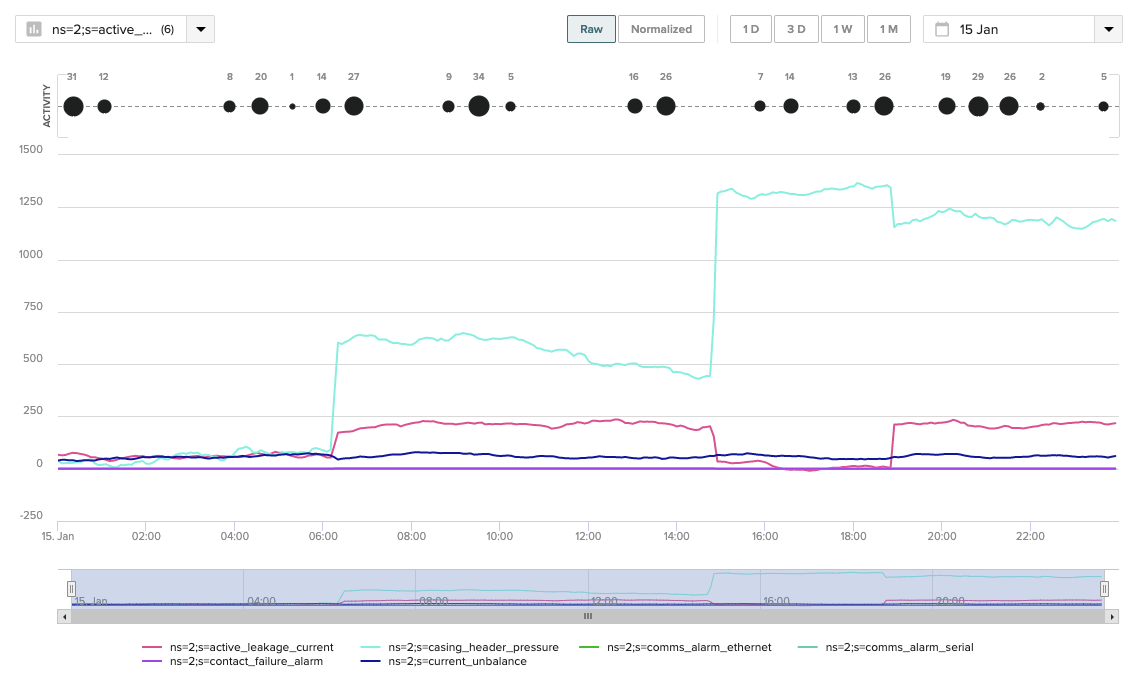
The dropdown on the top left is used to add/remove metrics from the chart. Any changes made to the metrics on the chart will be saved locally when leaving the Asset Profile page.
The time range on the chart can be changed using the quick time selectors on the top right or the calendar selector. By default, "1D" is the interval selected, which shows the last 24 hours.
Info
The title, color and unit of the metrics can be configured using a View Template
The Raw/Normalized toggle is used to change the scale of the metrics on the Y-axis of the chart:
- Raw - All metrics are shown on the same scale.
- Normalized - Each metric is shown on an optimized scale for the range of values displayed.
It is possible to zoom in on the data using the drag-zoom function on the chart, or by dragging the interval on the bottom navigator.
Activity Lane & Activity Drawer
The Activity Lane and Activity Drawer are the representation of Data Labels in context with the time series data.
The Activity Lane sits above the Chart. It shows Data Labels or Clusters (the count of Data Labels in an interval) depending on the level of zoom on the Chart.
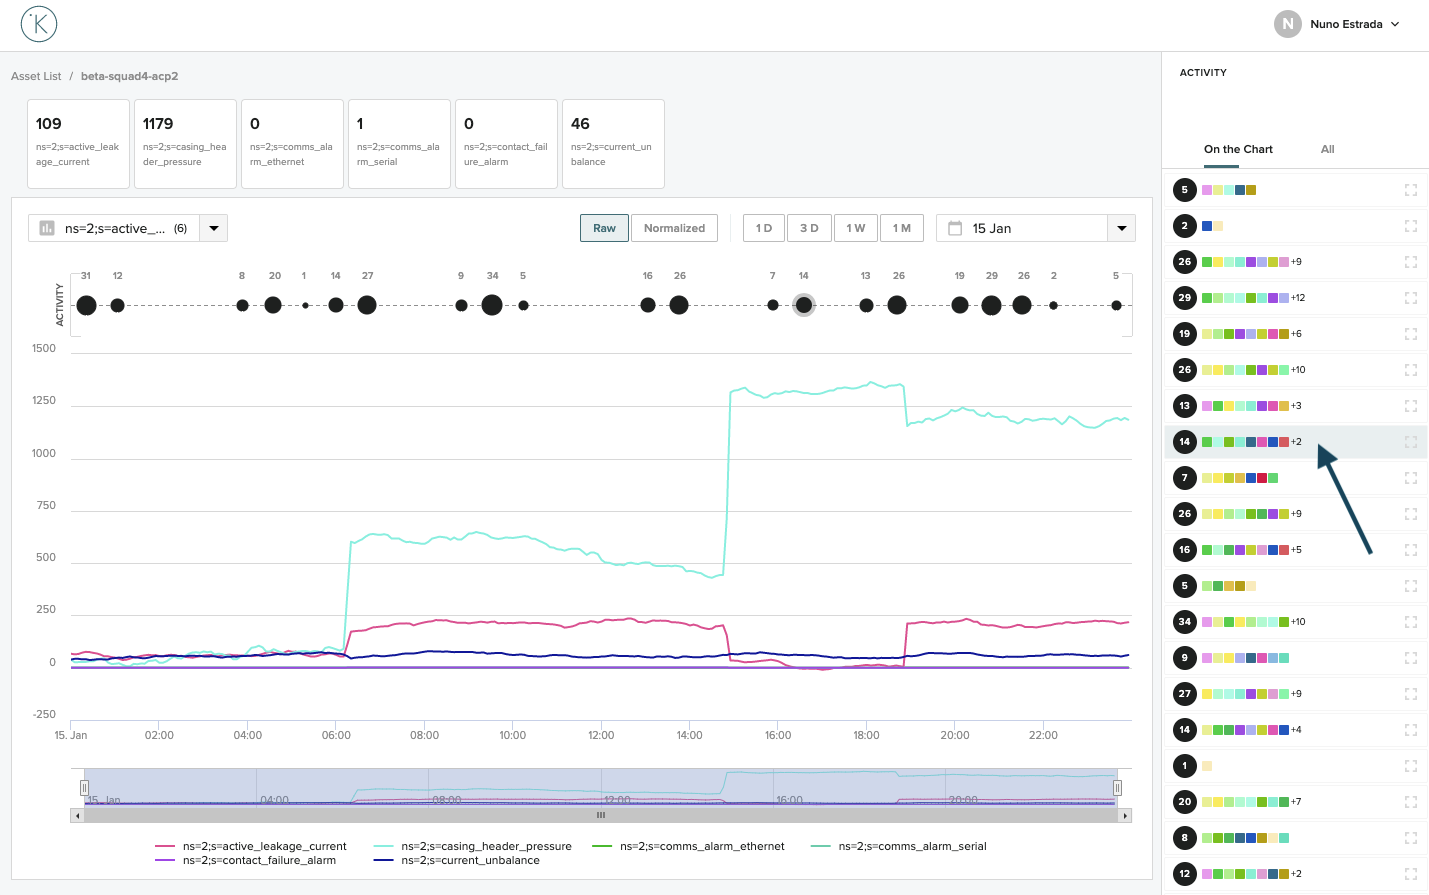
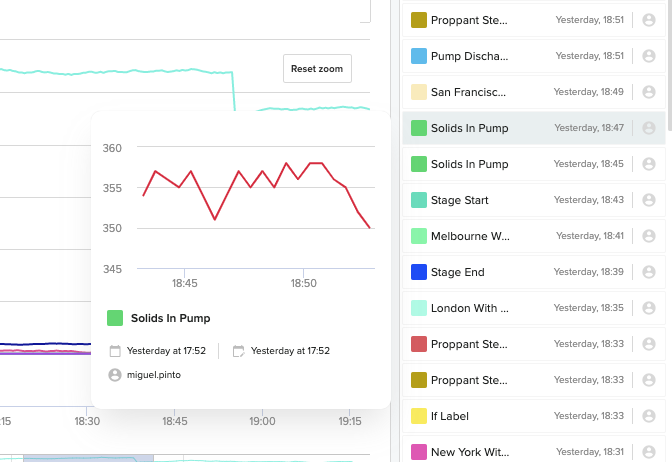
Drag-zoom on a Cluster or click on the Cluster on the Activity Drawer to see the Data Labels inside the Cluster.
Hovering on a Data Label on the Activity Lane shows the name of the associated Label, and highlights the Data Label on the Activity Drawer
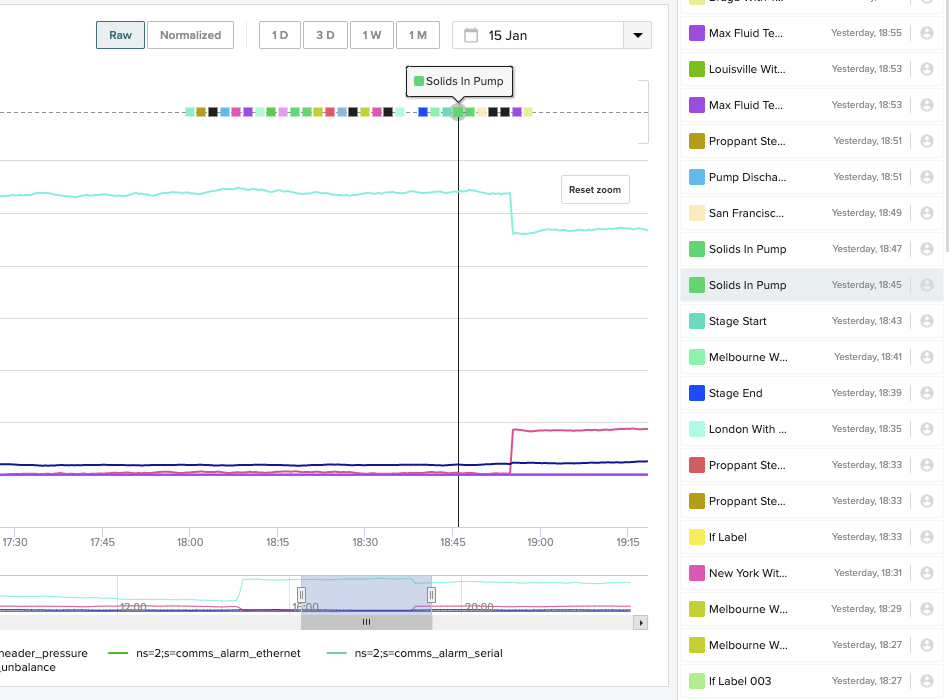
Clicking on the Data Label in the Activity Drawer will reveal the Data Label Detail popup. The Data Label Detail popup has the following information (from top to bottom):
- Chart thumbnail - A chart with a snapshot of the data of the metrics associated with the Data Label, in its time range.
- Label Name - The name of the Label associated with the Data Label.
- Data Label Description - A text description bellow the Label Name (optional).
- Created & Updated dates - The date when the Data Label was created (on the left) and the date when the Data Label was updated (on the right).
- Created by - The user or workload that created the Data Label