Kelvin (Main UX) Overview
On this page you will learn about Kelvin (Main UX) and how it fits into the Kelvin Collaboration Control Software.
What is Kelvin (Main UX) ?
Kelvin (Main UX) has been developed to add system visualization and simulation capabilities to the Kelvin Suite.
Kelvin (Main UX) runs as the operational monitoring and control layer for the Kelvin Core. Its key features are;
- Visualize the process flow, data and alarms of your machinery and assets.
- Easily modify the visualization screens on-the-fly by your operational personnel (not programmers) to ensure the visualizations show exact as-built process flows and actual asset data streams.
- Ensure visualization modifications are automatically shown across all users and screens to maintain a unified vision of the complete process flow and data streams.
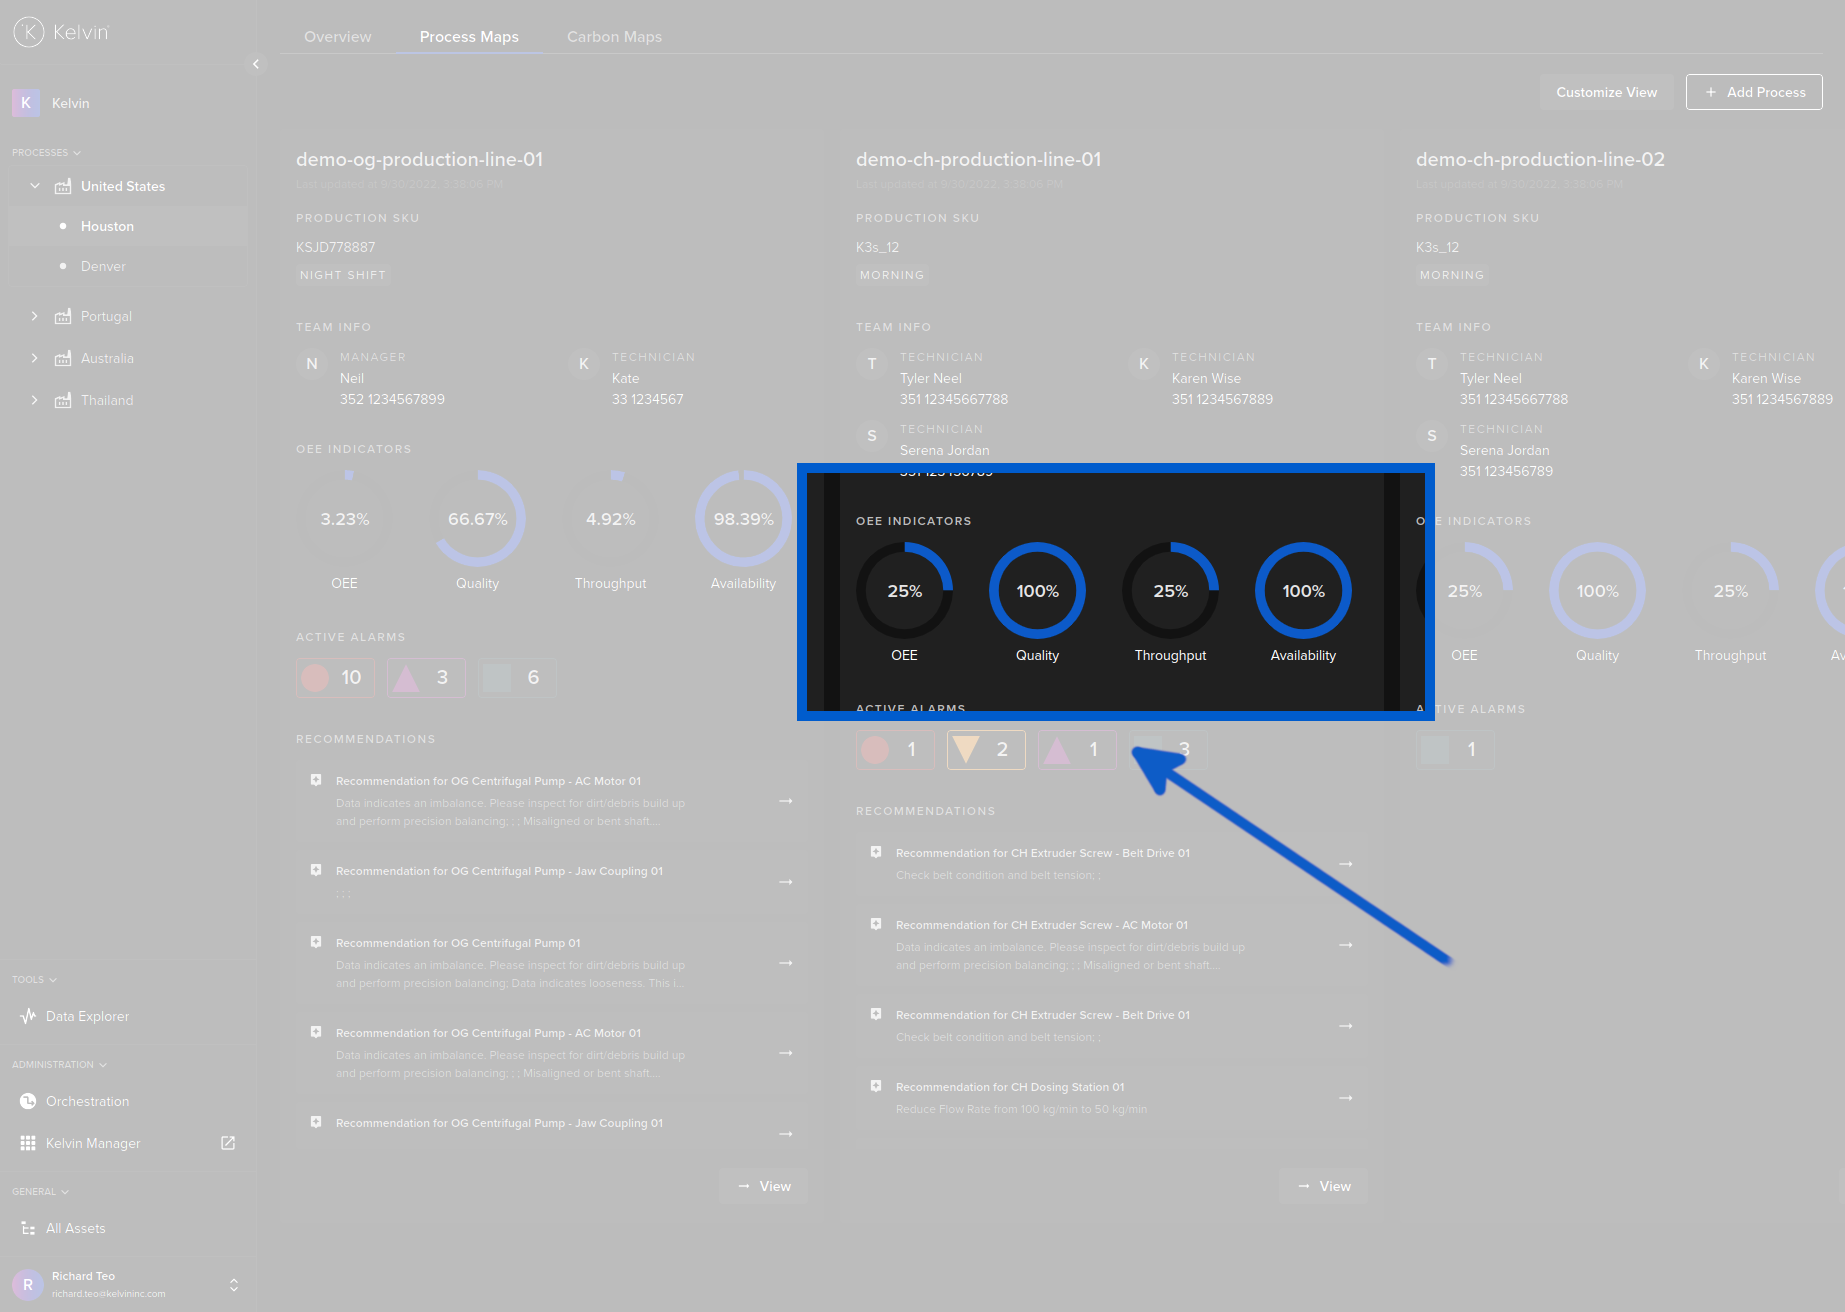
- Out of the box advanced analytical measurements such as KPI and OEE calculations.
- Have one visualization design but allow each user to customize their screens to show only information relevant to them.
- Quickly translate your process flows, data sources and contextual information into visualizations.
- Communication tools integrated with many different types of communication apps (e.g. Slack, Microsoft Teams, etc) to allow engineers and operators to communicate and collaborate in real time.
- Simulate new process flows with existing data to find better production results before actually implementing them.
- Use Control Change logic to add an extra layer of control systems across many assets. The allows a low cost evolution to production wide automation either with simple logic of machine learning based logic.
Kelvin (Main UX) is the interface for operations and management alike. All information and data management is done by the Cloud Server and the administration for Kelvin Metrics, Kelvin Assets and Kelvin Apps is handled by the Kelvin Manager UI.
Definitions
As this tool is very versatile for use in many types of industrial operations, we will define the terminology that is used throughout this documentation for setting up the hierarchical structure.
The full hierarchical structure is created in Kelvin Manager UI except for the last layer where processes can be created directly in Kelvin (Main UX). The structure is created using the Kelvin Assets Group with the different types defining the layer.
To understand more about Kelvin Assets Groups, check out the documentation at Kelvin Overview -> Kelvin Core -> Kelvin Assets # Asset Groups.
You are free to create your own structures using the Kelvin Assets Groups Enterprise, Business Unit and Site. The only requirements is that you can only have one Kelvin Asset Groups Enterprise and it must sit at the top of the hierarchy.
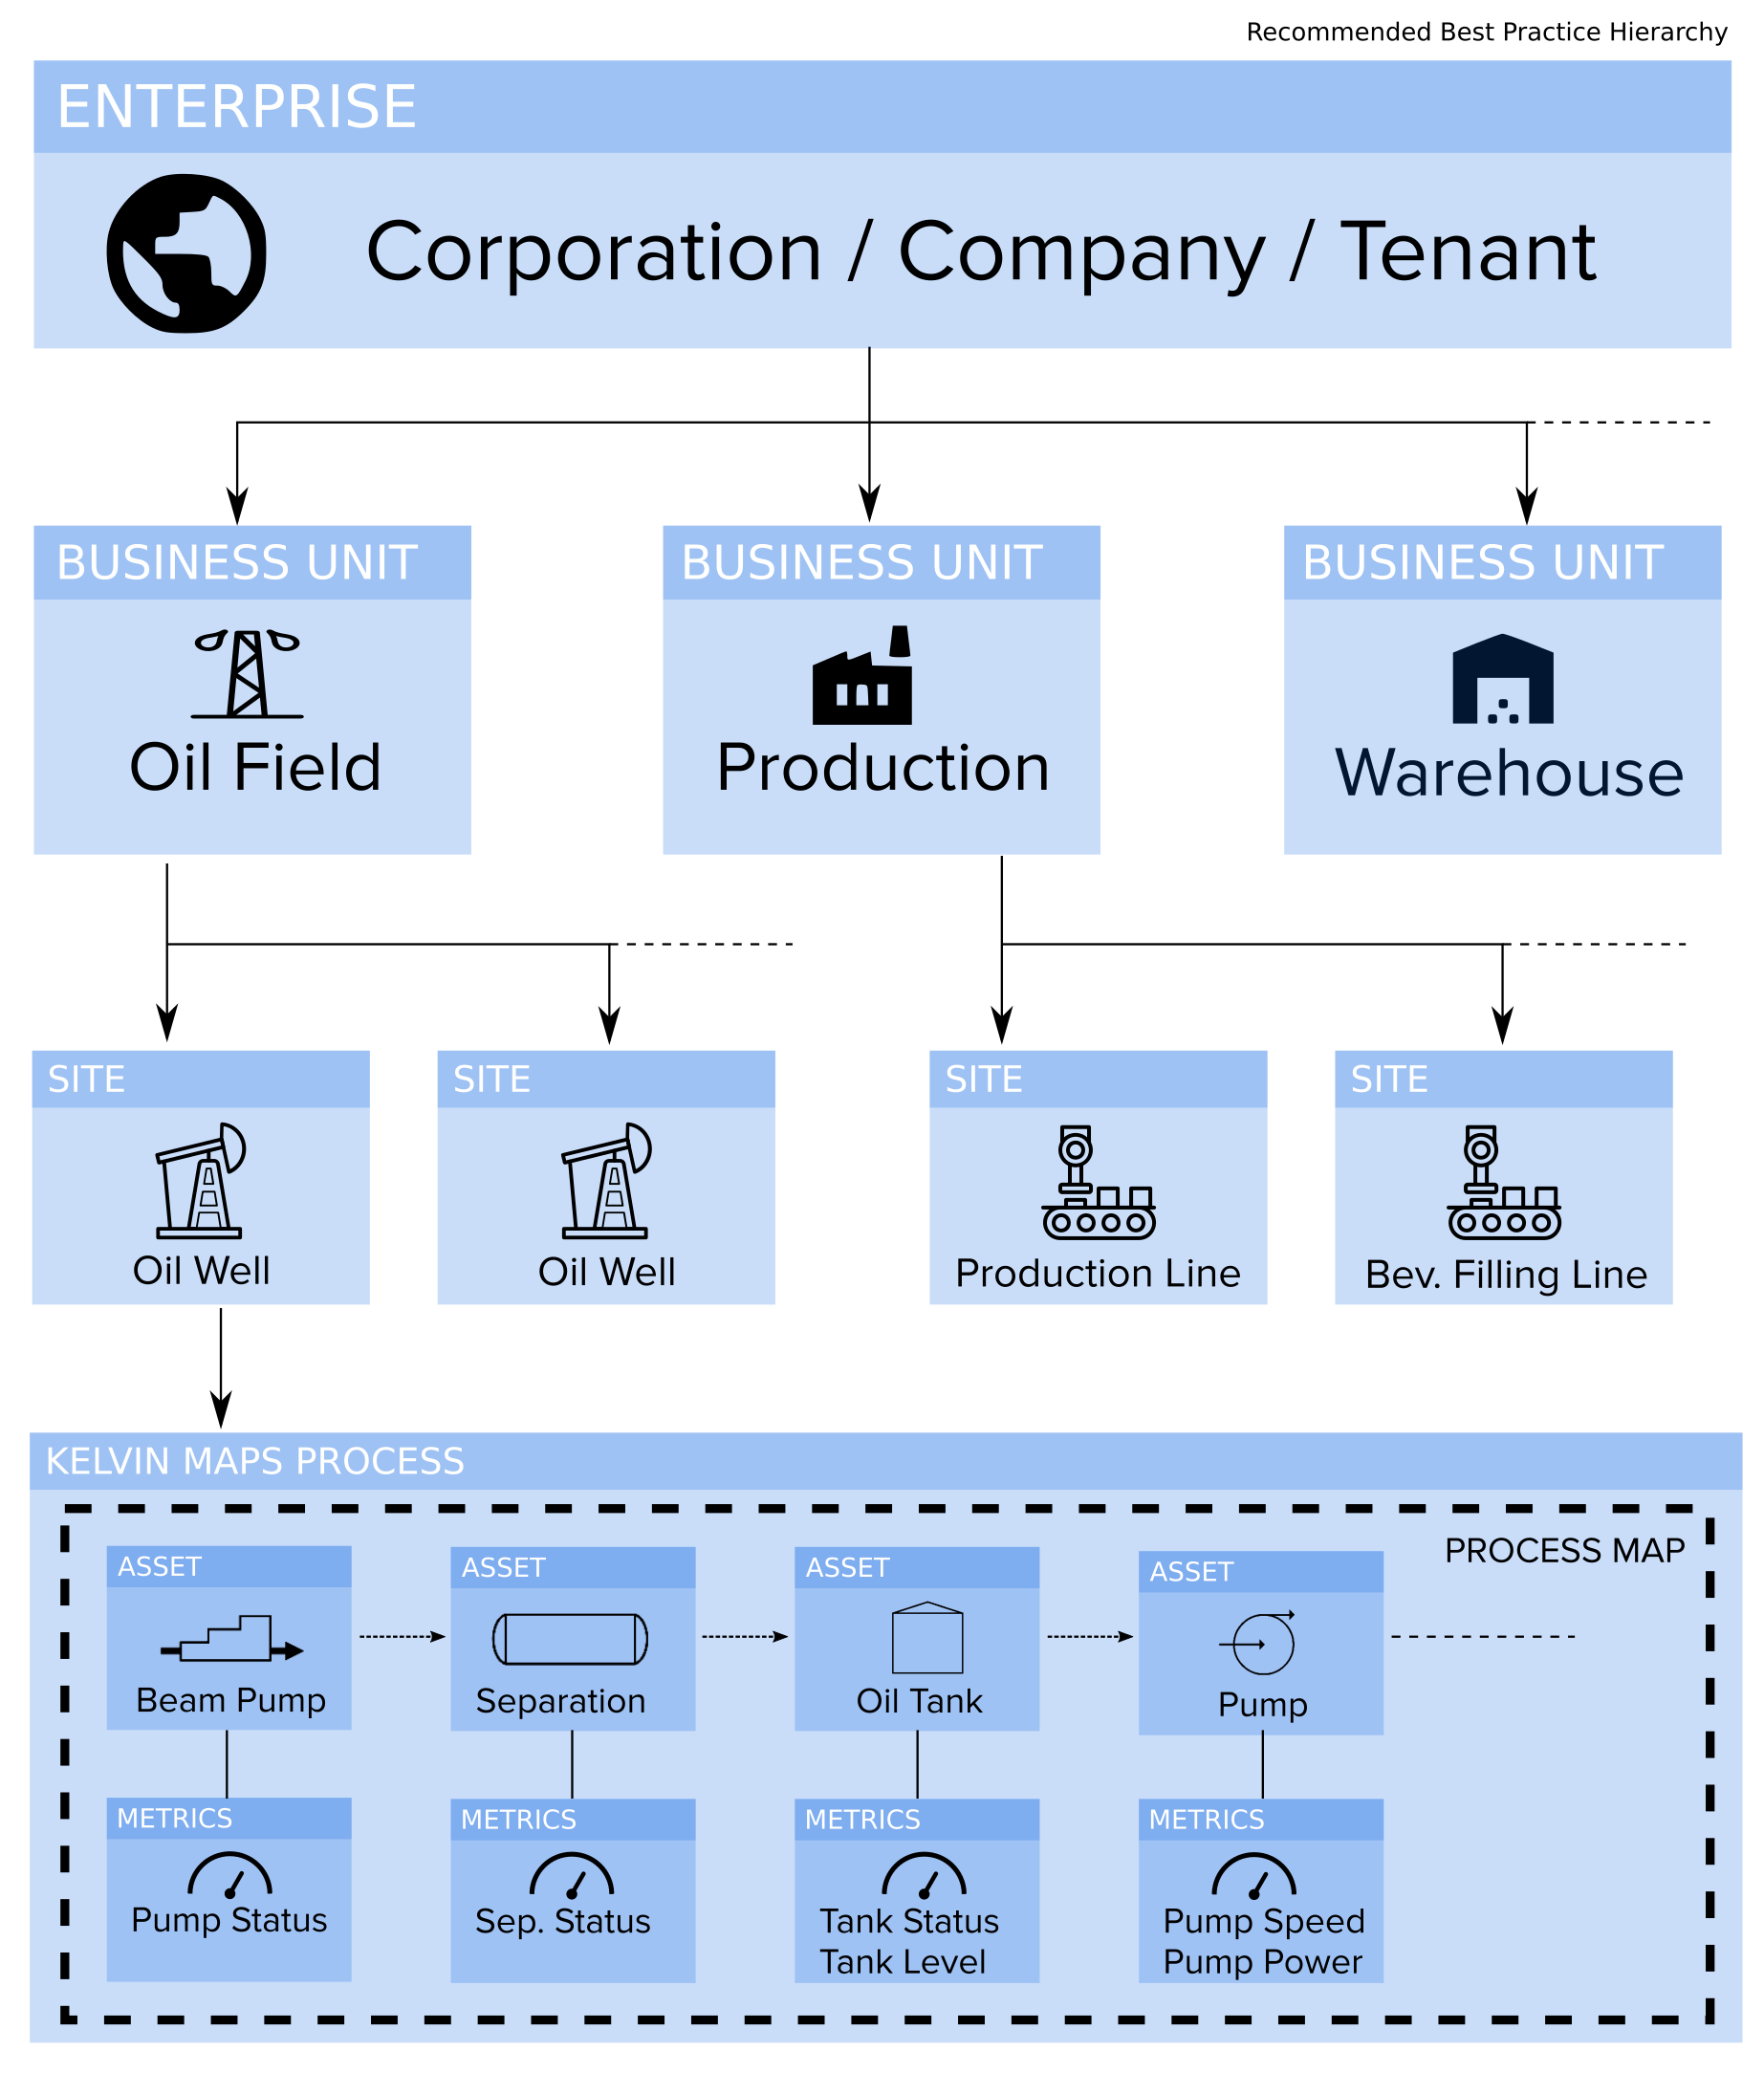
For best practice implementation of the Enterprise hierarchy, we recommend you follow this general structure;
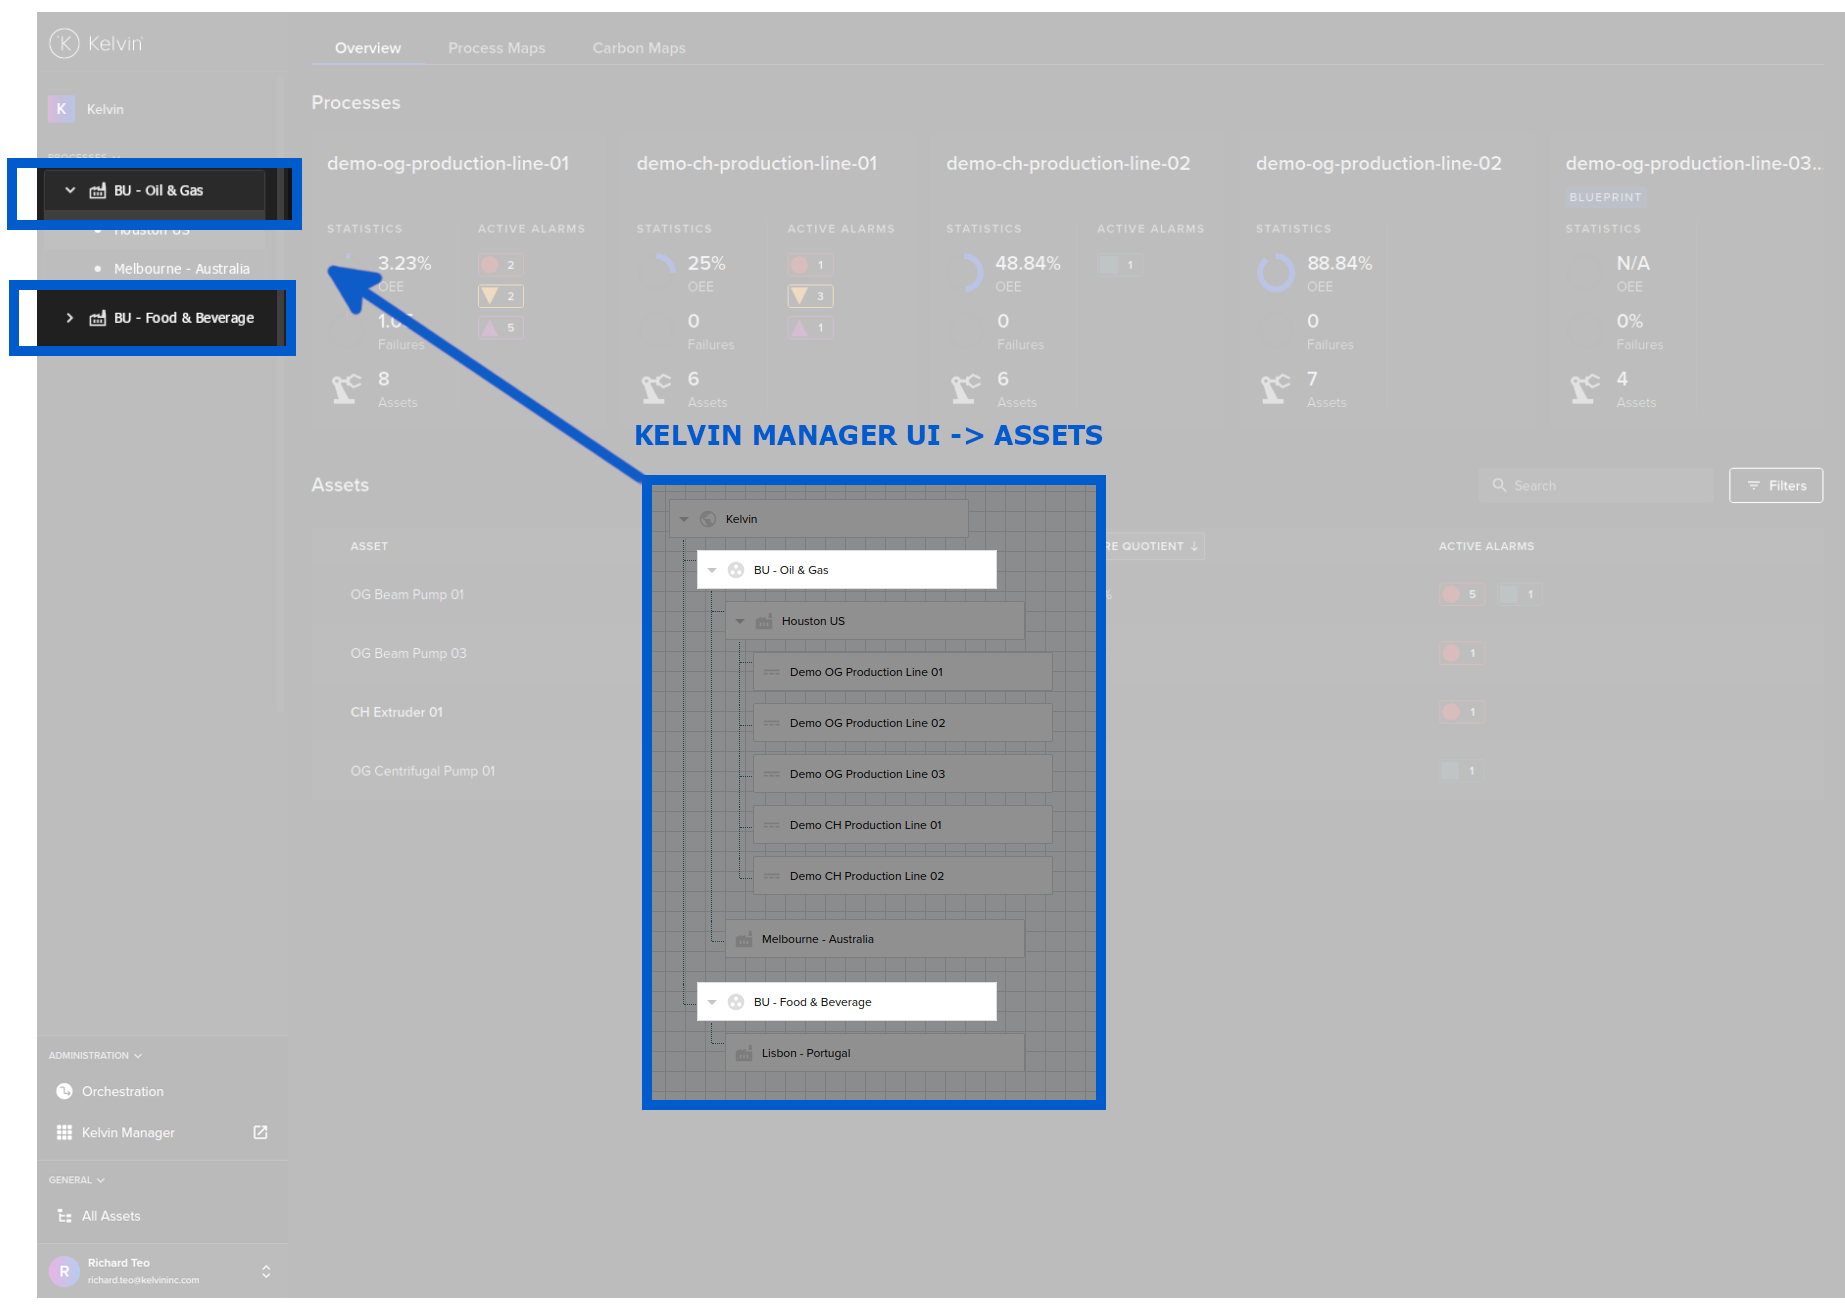
In the Kelvin Manager UI under Assets the structure will look similar to this;
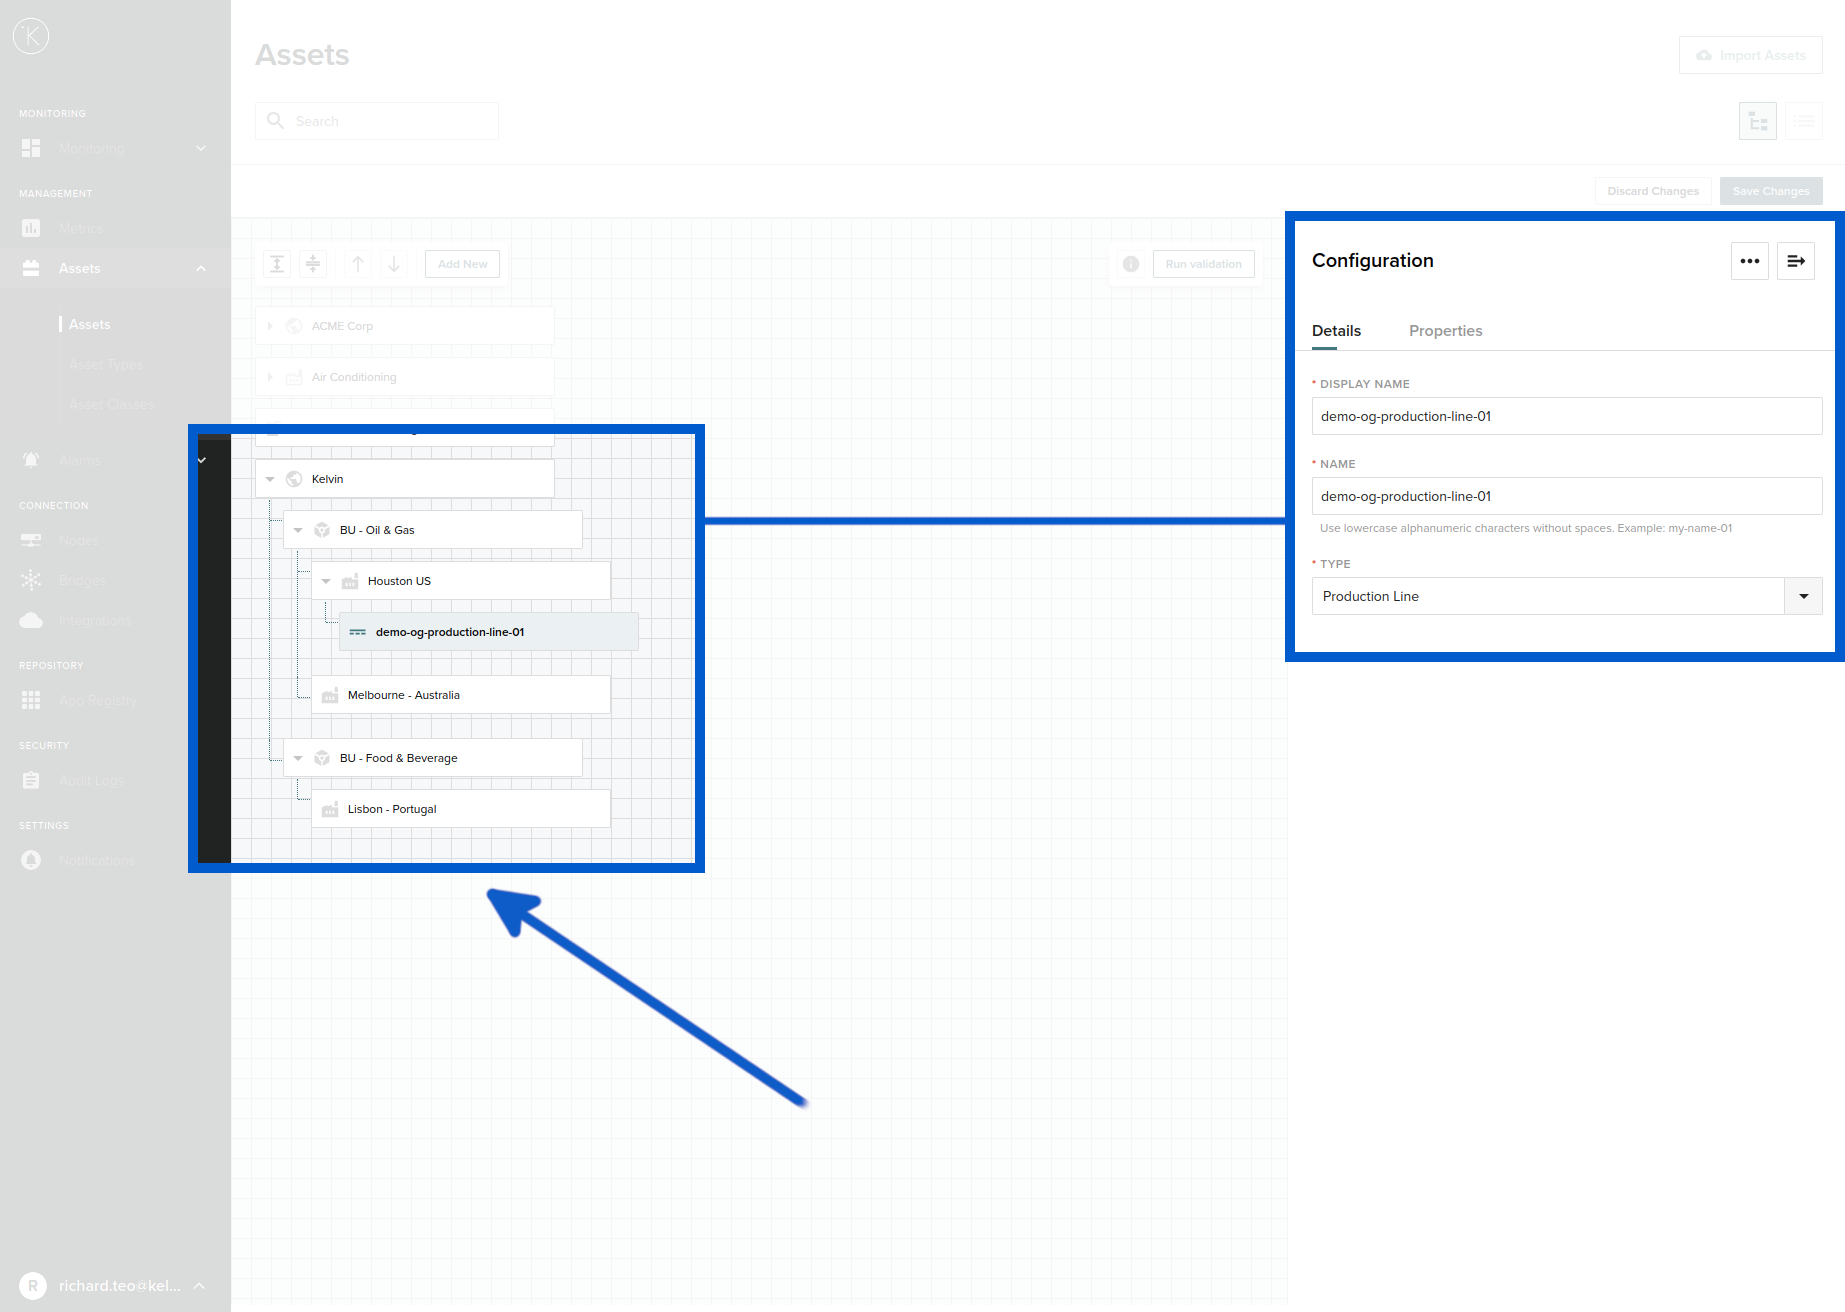
Let's go through each layer of this hierarchy;
Enterprise
At the top you can create one Kelvin Asset Group with a type Enterprise.
Kelvin (Main UX) is designed as a single tenant (called in Kelvin Asset Group with a type Enterprise) application. To have a multi-tenant environment you can deploy one Kelvin Core per tenant.

Business Units
Below the Enterprise layer you can create as many Kelvin Asset Group with a type Business Units as required.
Site
Below the Business Unit you can create as many Kelvin Asset Group with a type Sites as required.

Processes
And finally below Sites you can create Processes. This is done directly in Kelvin (Main UX) after the Enterprise, Business Units and Sites have been created in the Kelvin Manager UI.
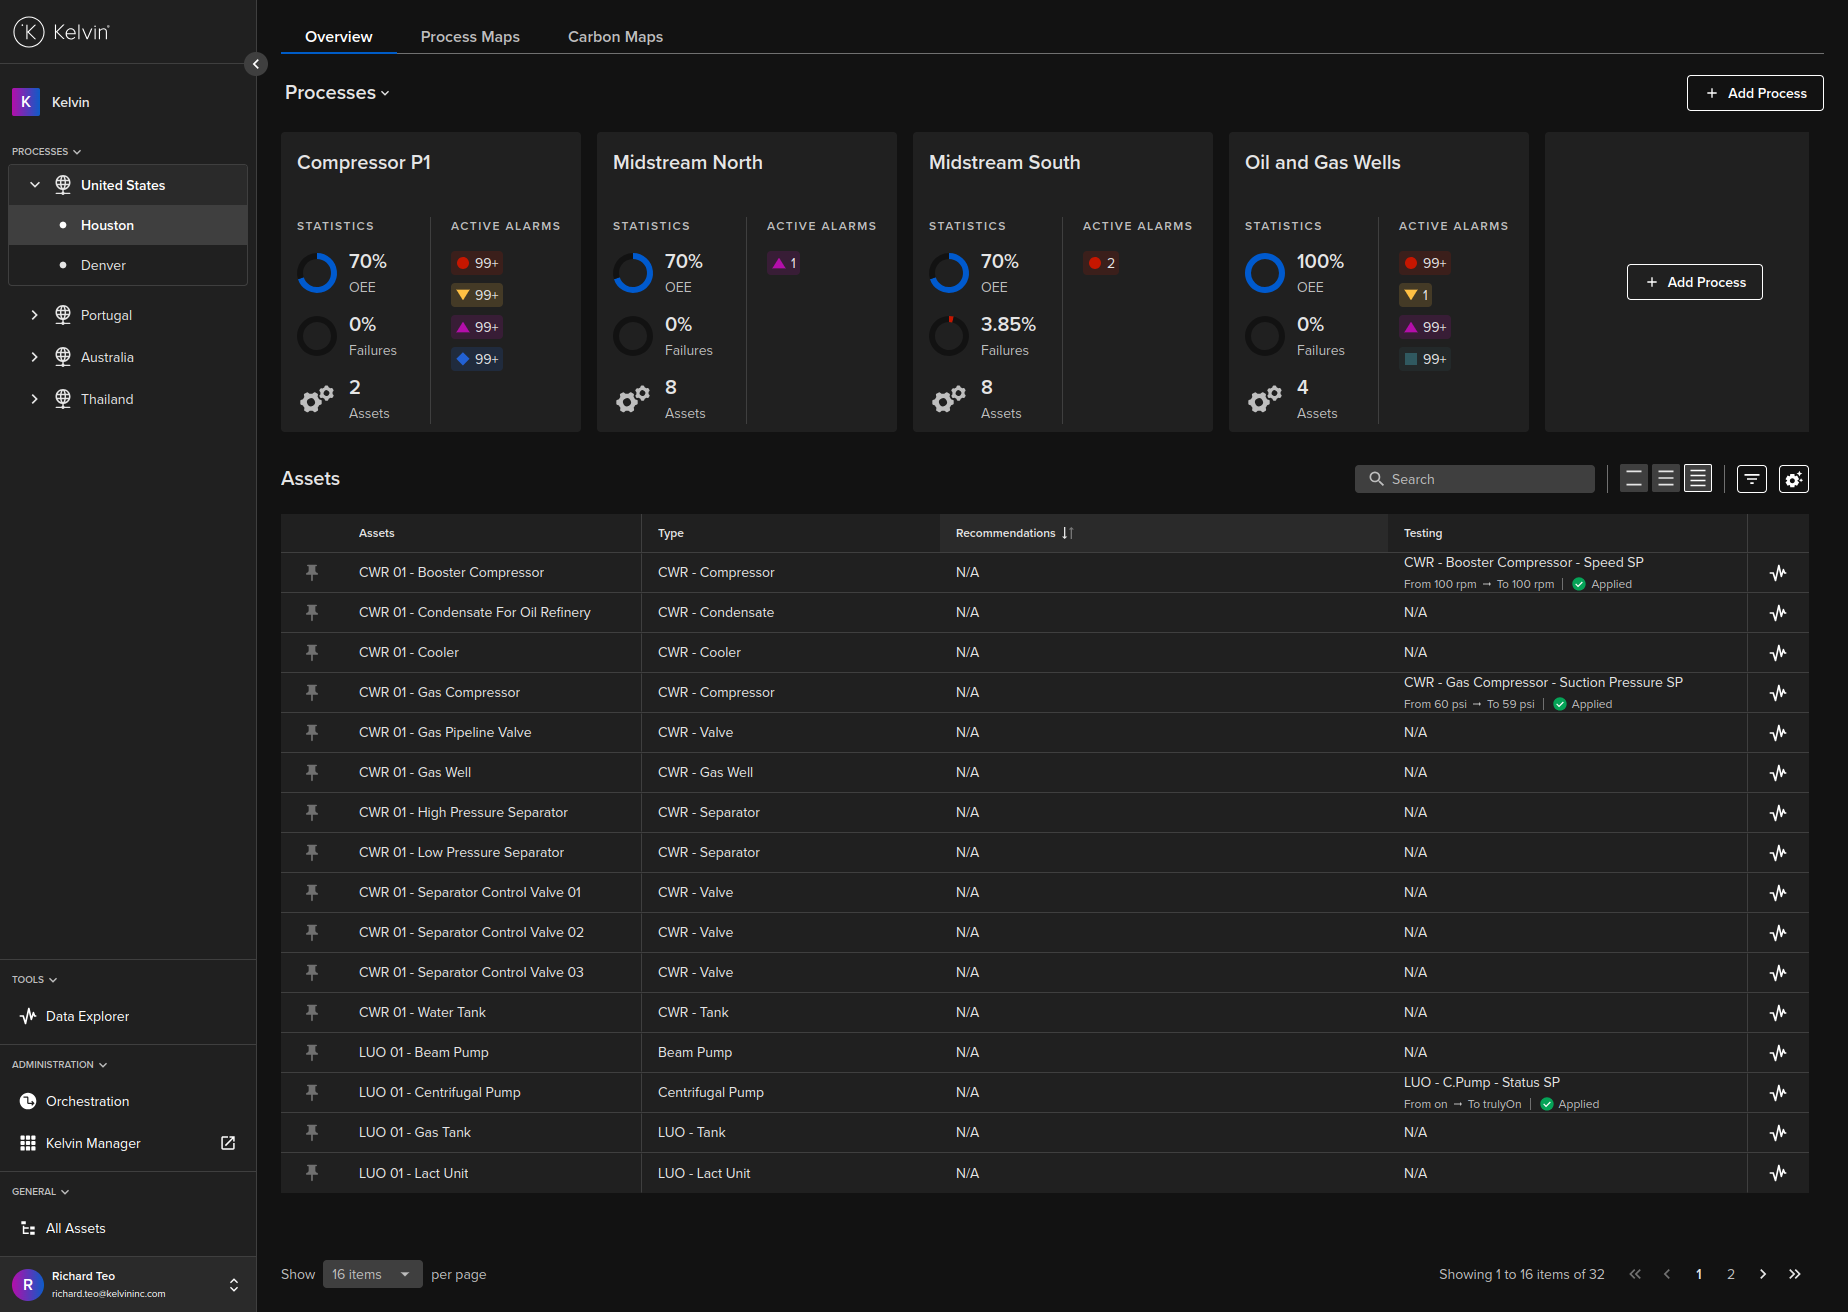
Process is used to group together all assets that are related to a process. This can be a well, an assembly or production line, a group of interconnected assets, etc. In the Kelvin (Main UX) UI you will find this reference on the Dashboard at the top below the Site tabs.
Learn how to create your process using Kelvin (Main UX) process in Getting Started Guides -> GSG Kelvin Maps -> GSG Create Kelvin Maps Hierarchy.

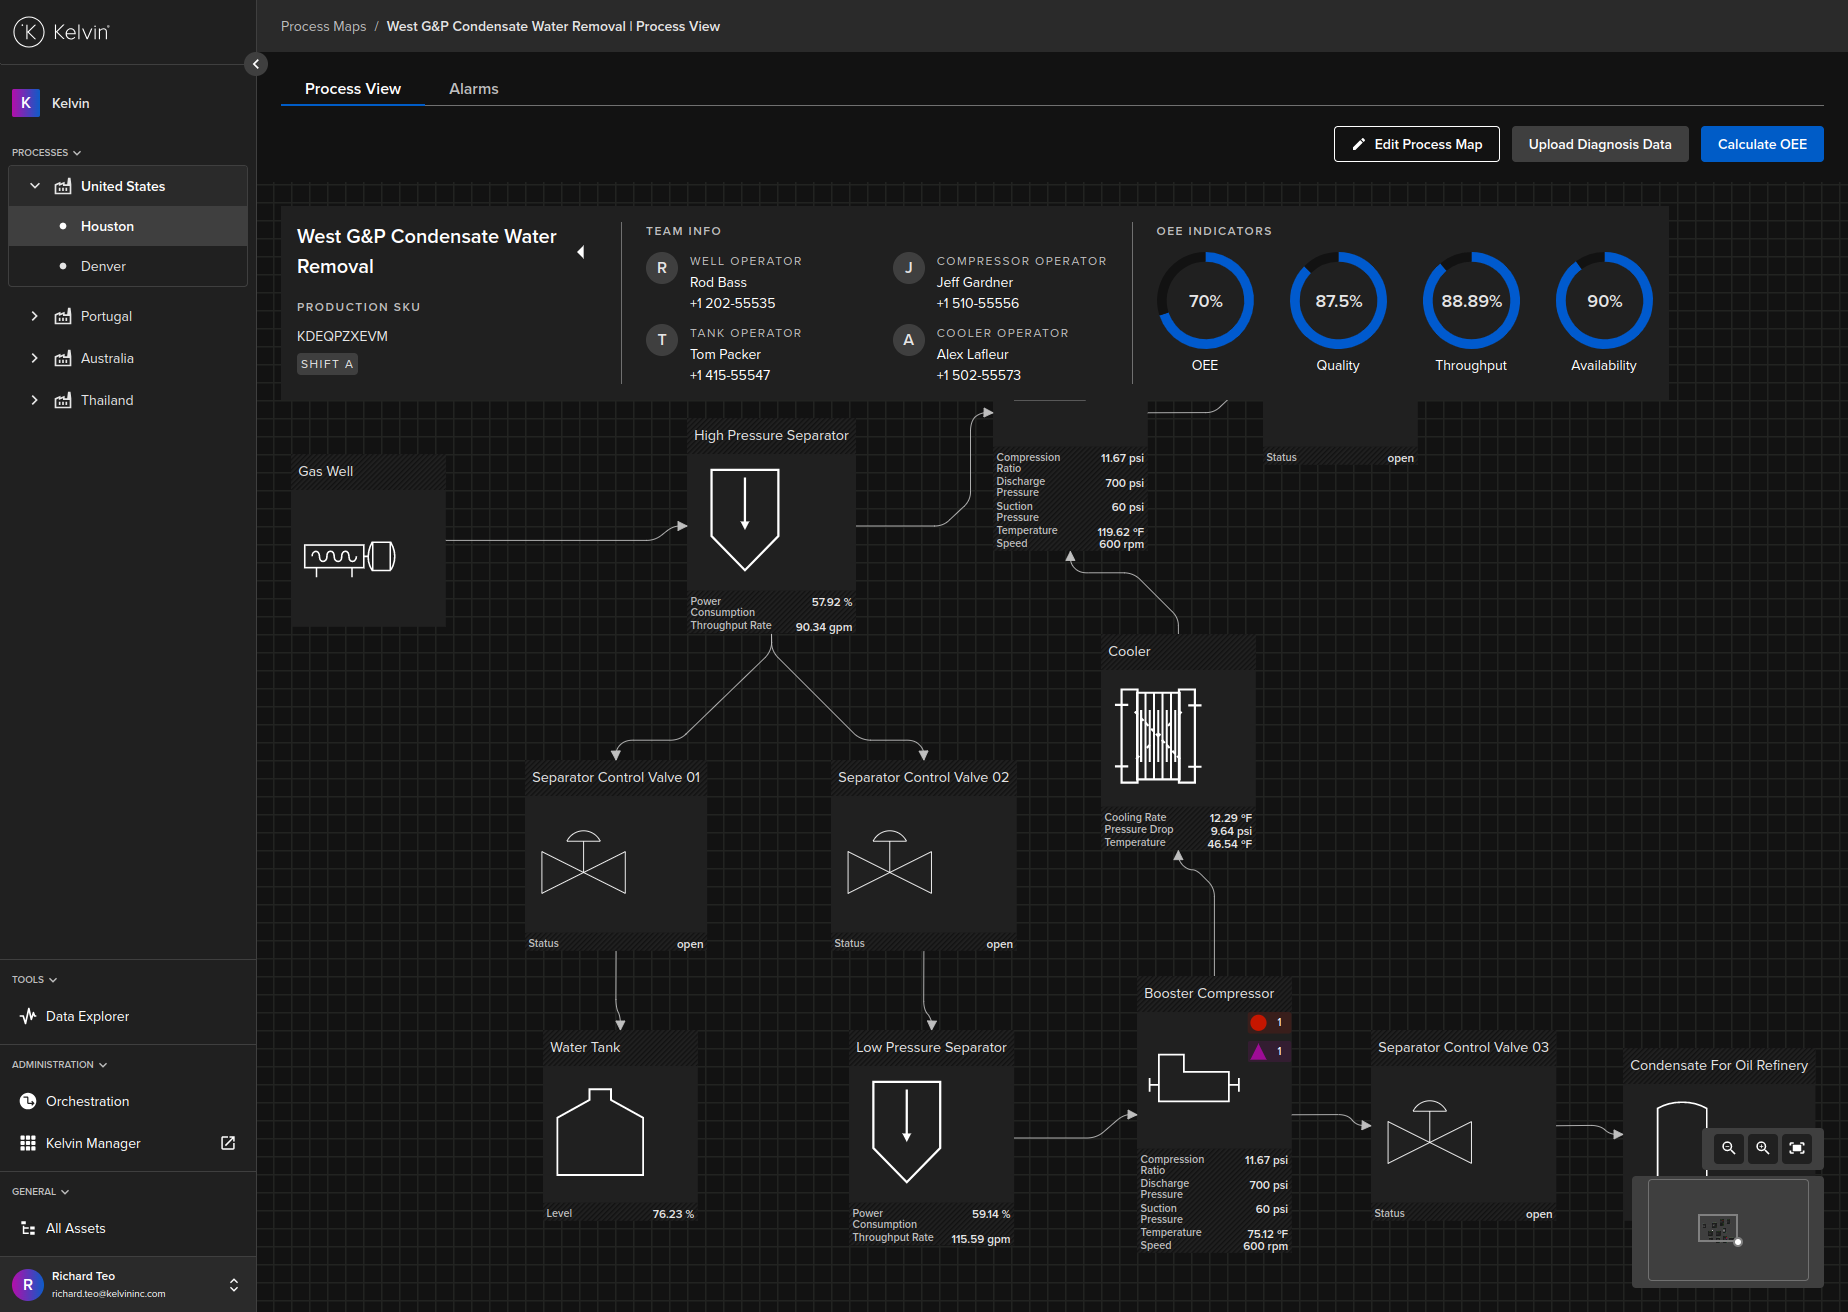
Process View
A Process View usually comes from the overall machine design data. In our example we can called each process flow as view.
To understand how to create process flows, you can read more in Getting Started Guides -> GSG Kelvin Maps -> GSG Create Kelvin Maps Process.
Asset
This is one piece of your process flow. Kelvin provides a library of asset shapes for you to use in your process flow.
An asset in Kelvin (Main UX) is connected with a Kelvin Asset on the Cloud Server. But they are also more than just the Kelvin Asset as you can associate it with any Kelvin Metric that has been deployed in an Kelvin Bridge or Kelvin App.
To appear in this list below the Kelvin Metric must have been deployed as a pair with the selected Kelvin Asset.

Alarms
An alarm is directly related to Kelvin Alarms on the Cloud Server and are grouped and displayed per process view.
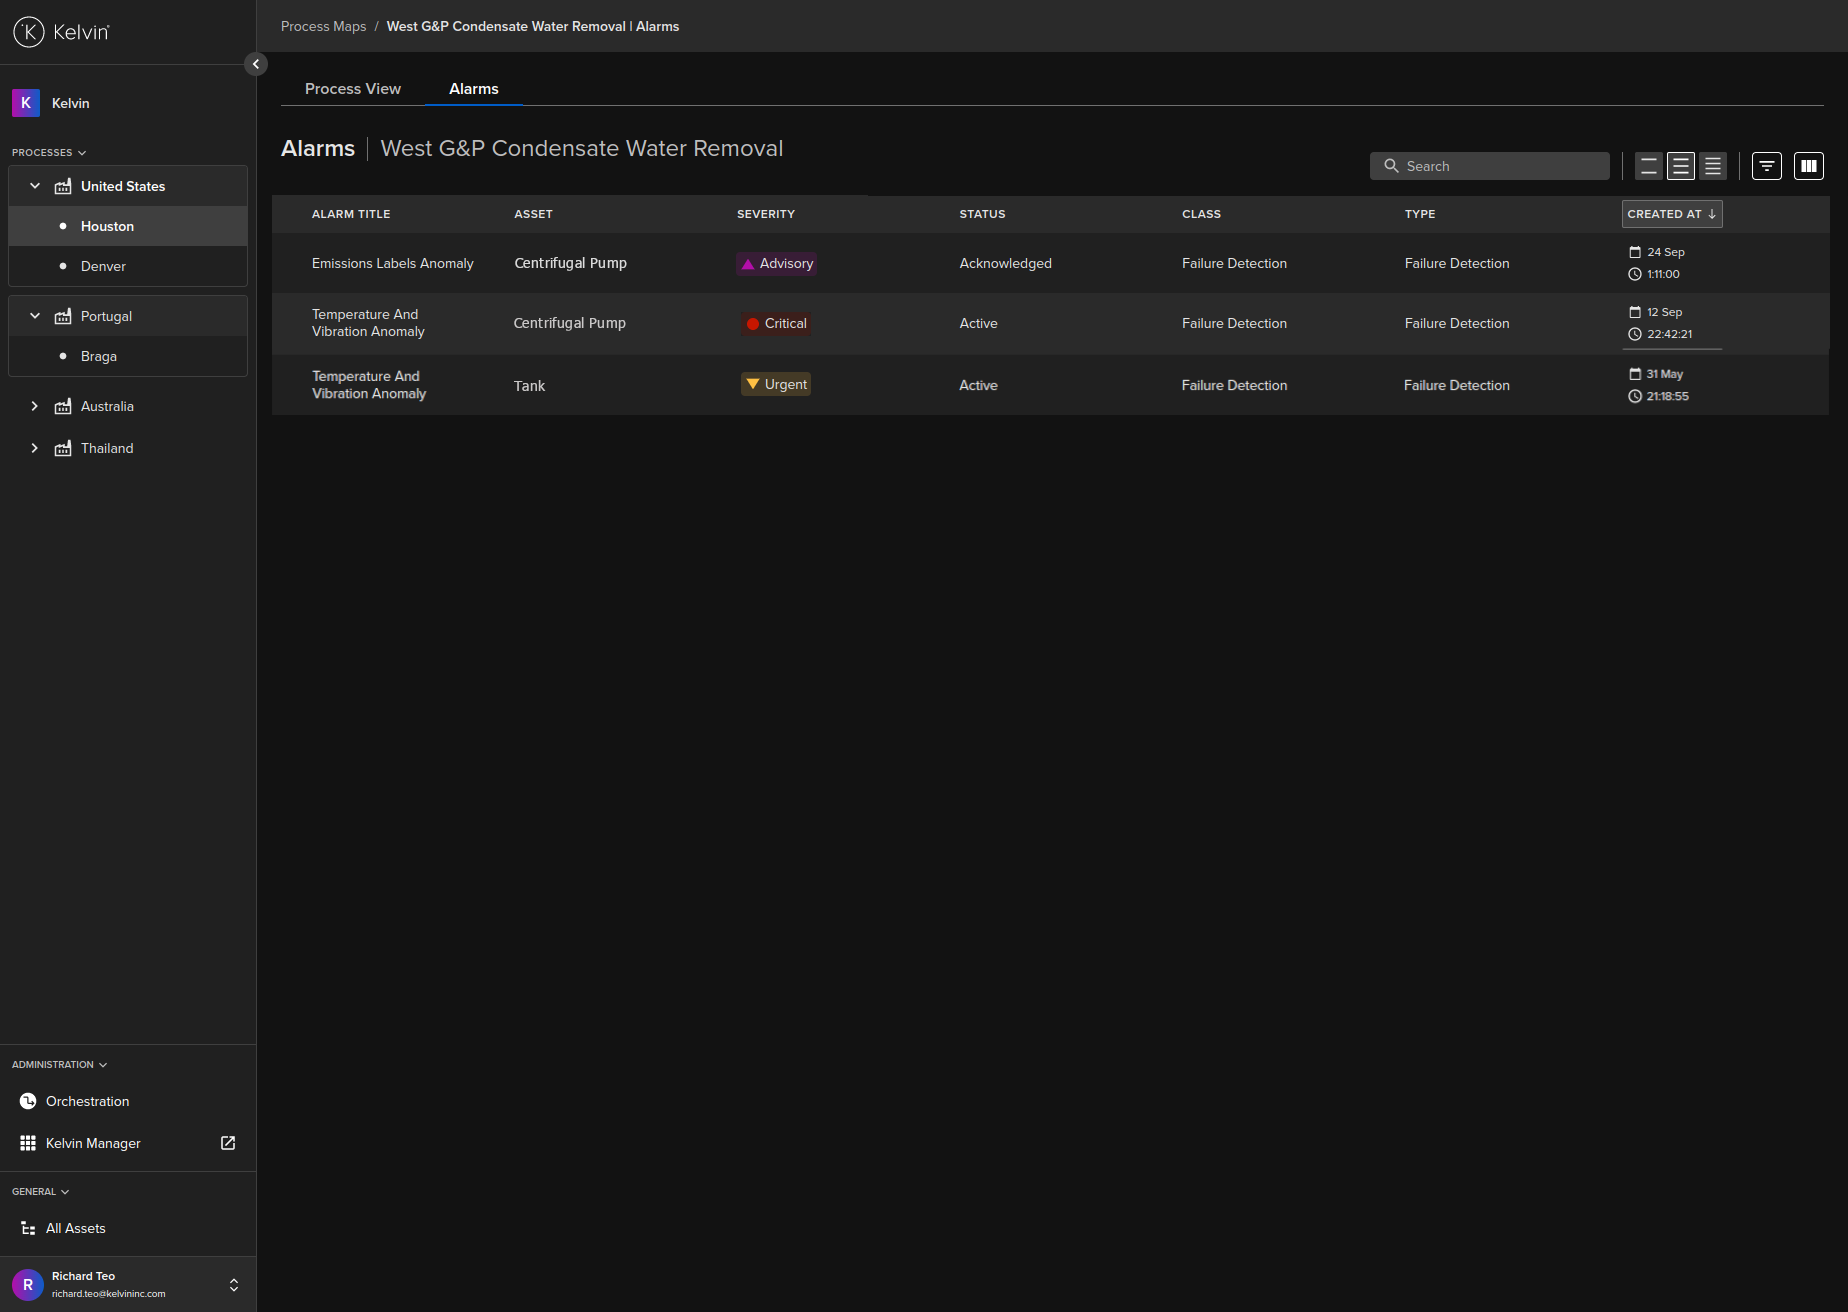
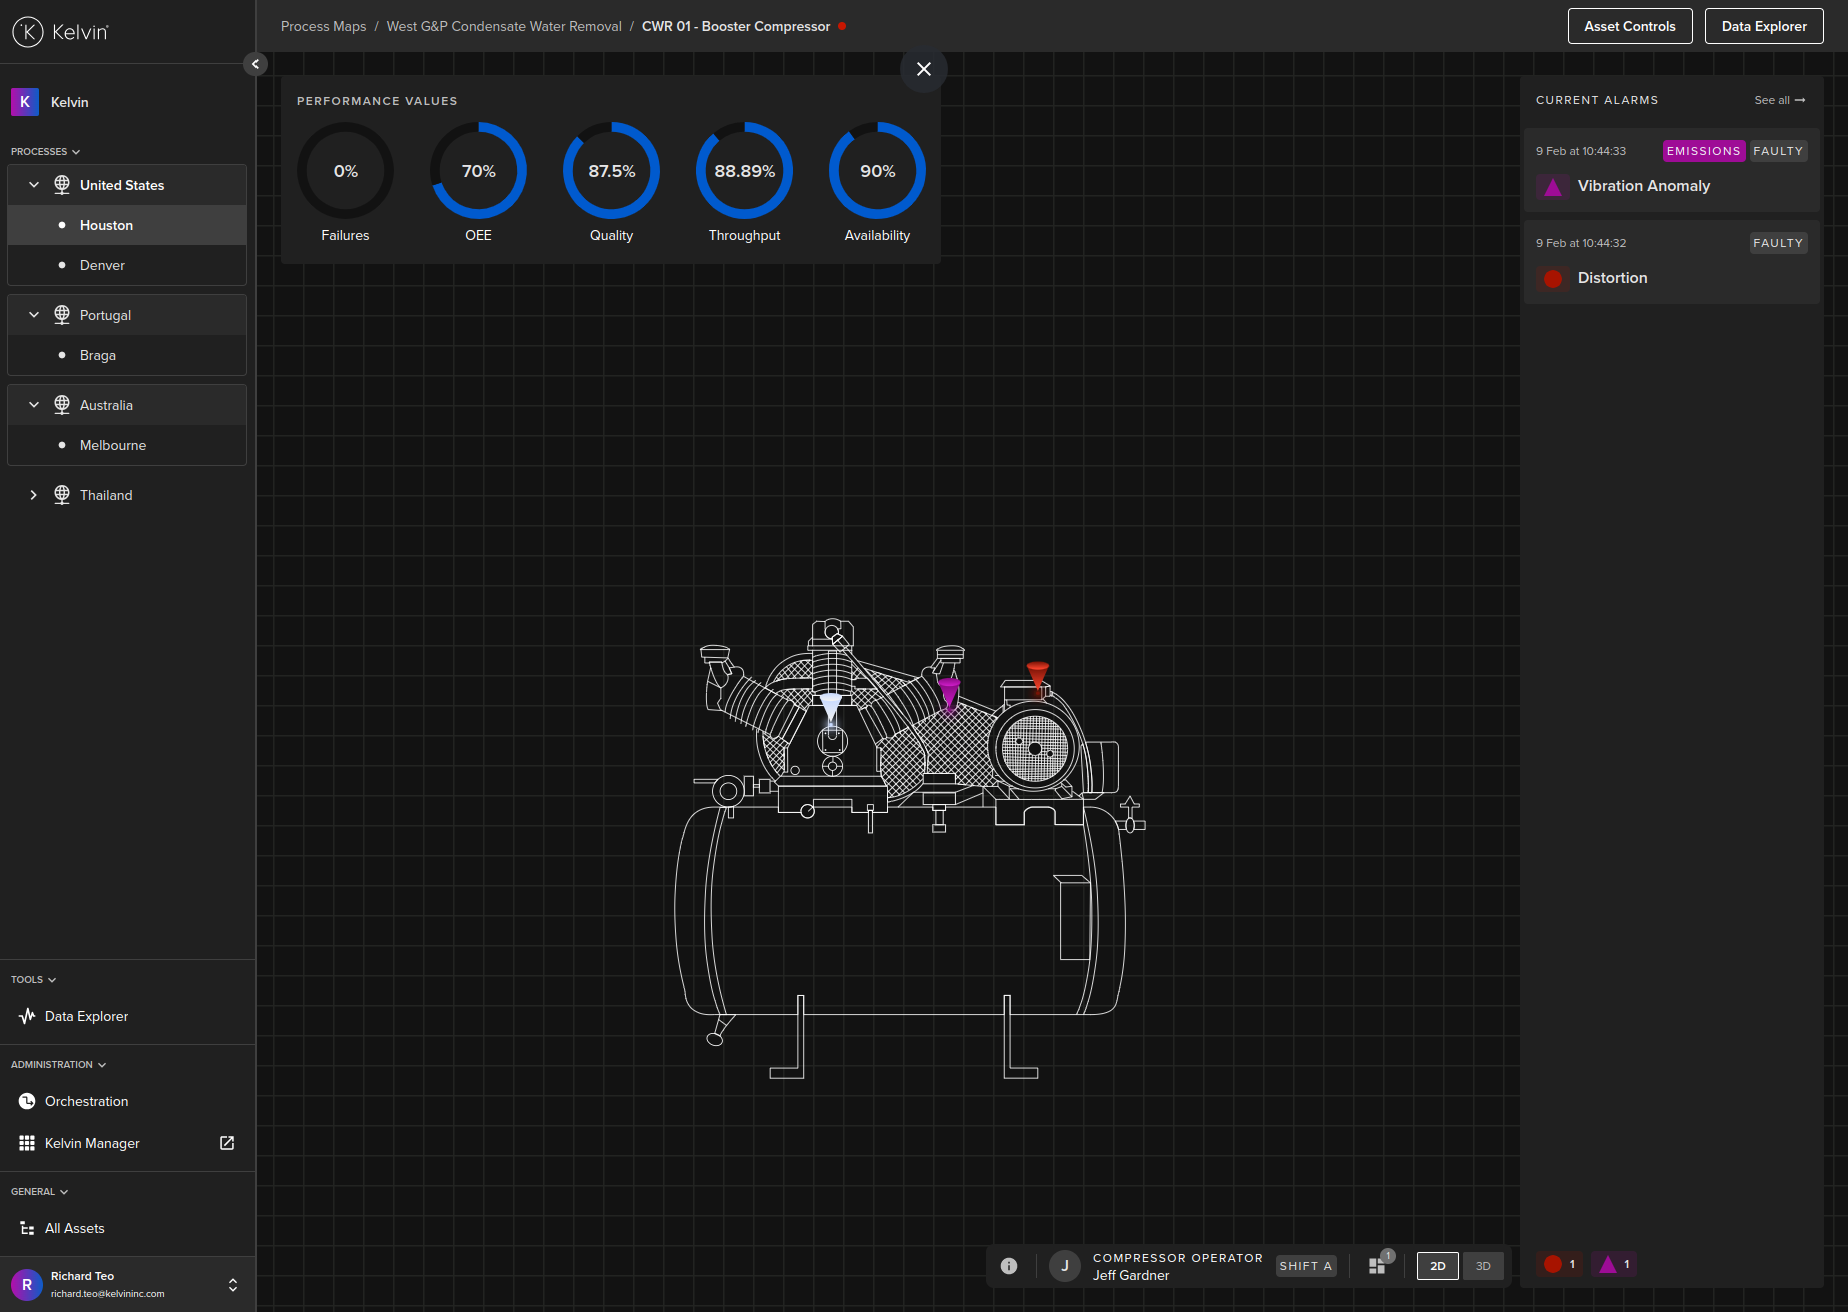
Alarms are also displayed as pins when you look at an Asset in 2D or 3D view.
Only Kelvin Alarms related to Kelvin Parts or Kelvin Sensor will be displayed as pins in the 2D/3D view. If a Kelvin Alarm is related to a Kelvin Component or Kelvin Asset they will only show up in the Kelvin Alarm list above.
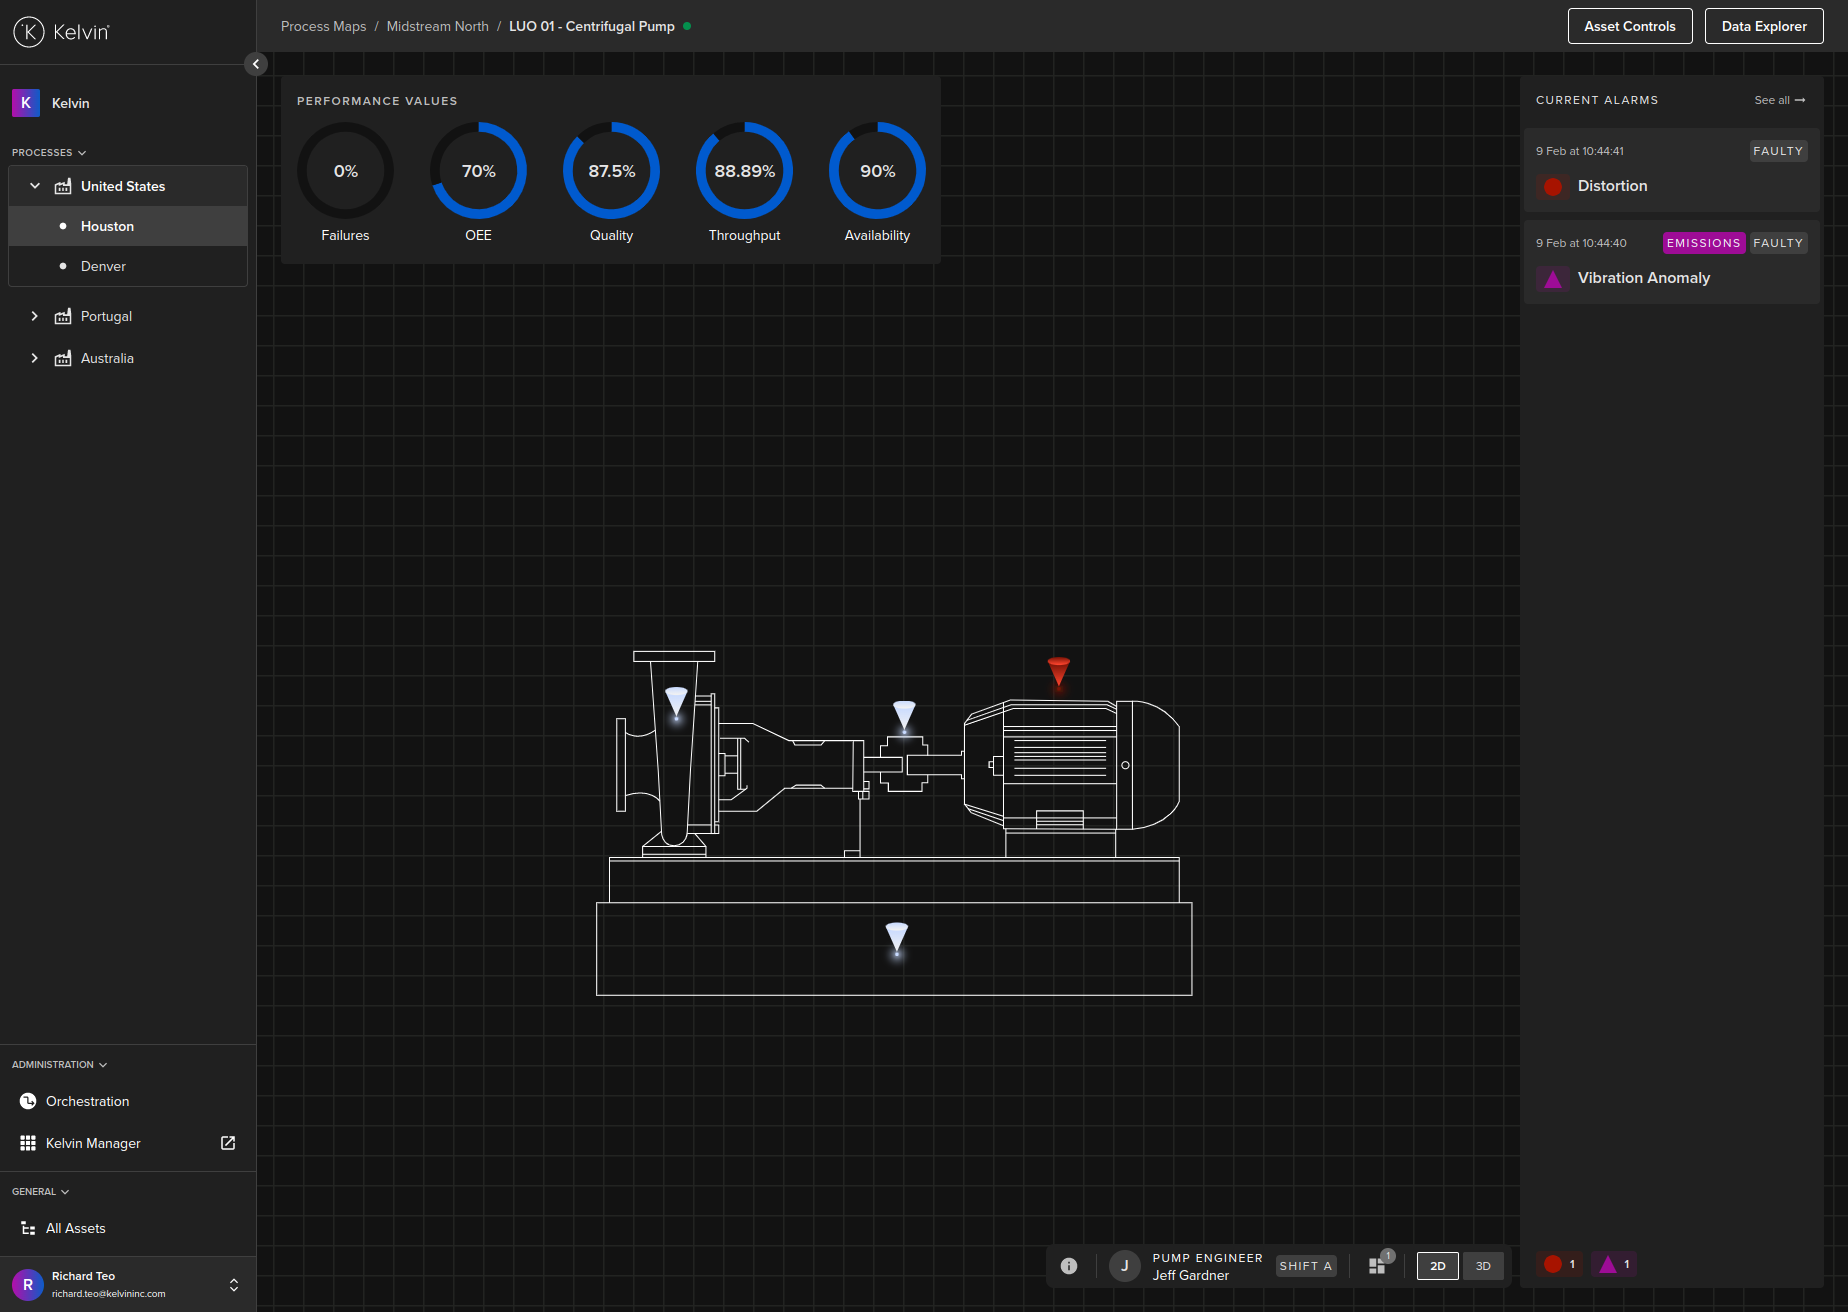
When viewing the Kelvin Alarms in 2D/3D view you may see an ![]() icon. This means the asset is performing inefficiently. This parameter is calculated from the Carbon Maps section and you can read more details there.
icon. This means the asset is performing inefficiently. This parameter is calculated from the Carbon Maps section and you can read more details there.
Visualization
The power of Kelvin (Main UX) is that it is easy to transfer process flows and data maps into visualizations without any programming knowledge.
And as it can be modified and updated on-the-fly while in operation, it is possible to ensure the visualizations accurately reflect the as-built status of the machines at all times.
It is very common that SCADA and DCS systems are never updated after commissioning meaning that modifications and new equipment are rarely accurately incorporated into the process flow.
This is usually the result of the high degree of programming skills required to program such systems, the expensive developer licence fees and that it can only be upgraded during down time of the process.
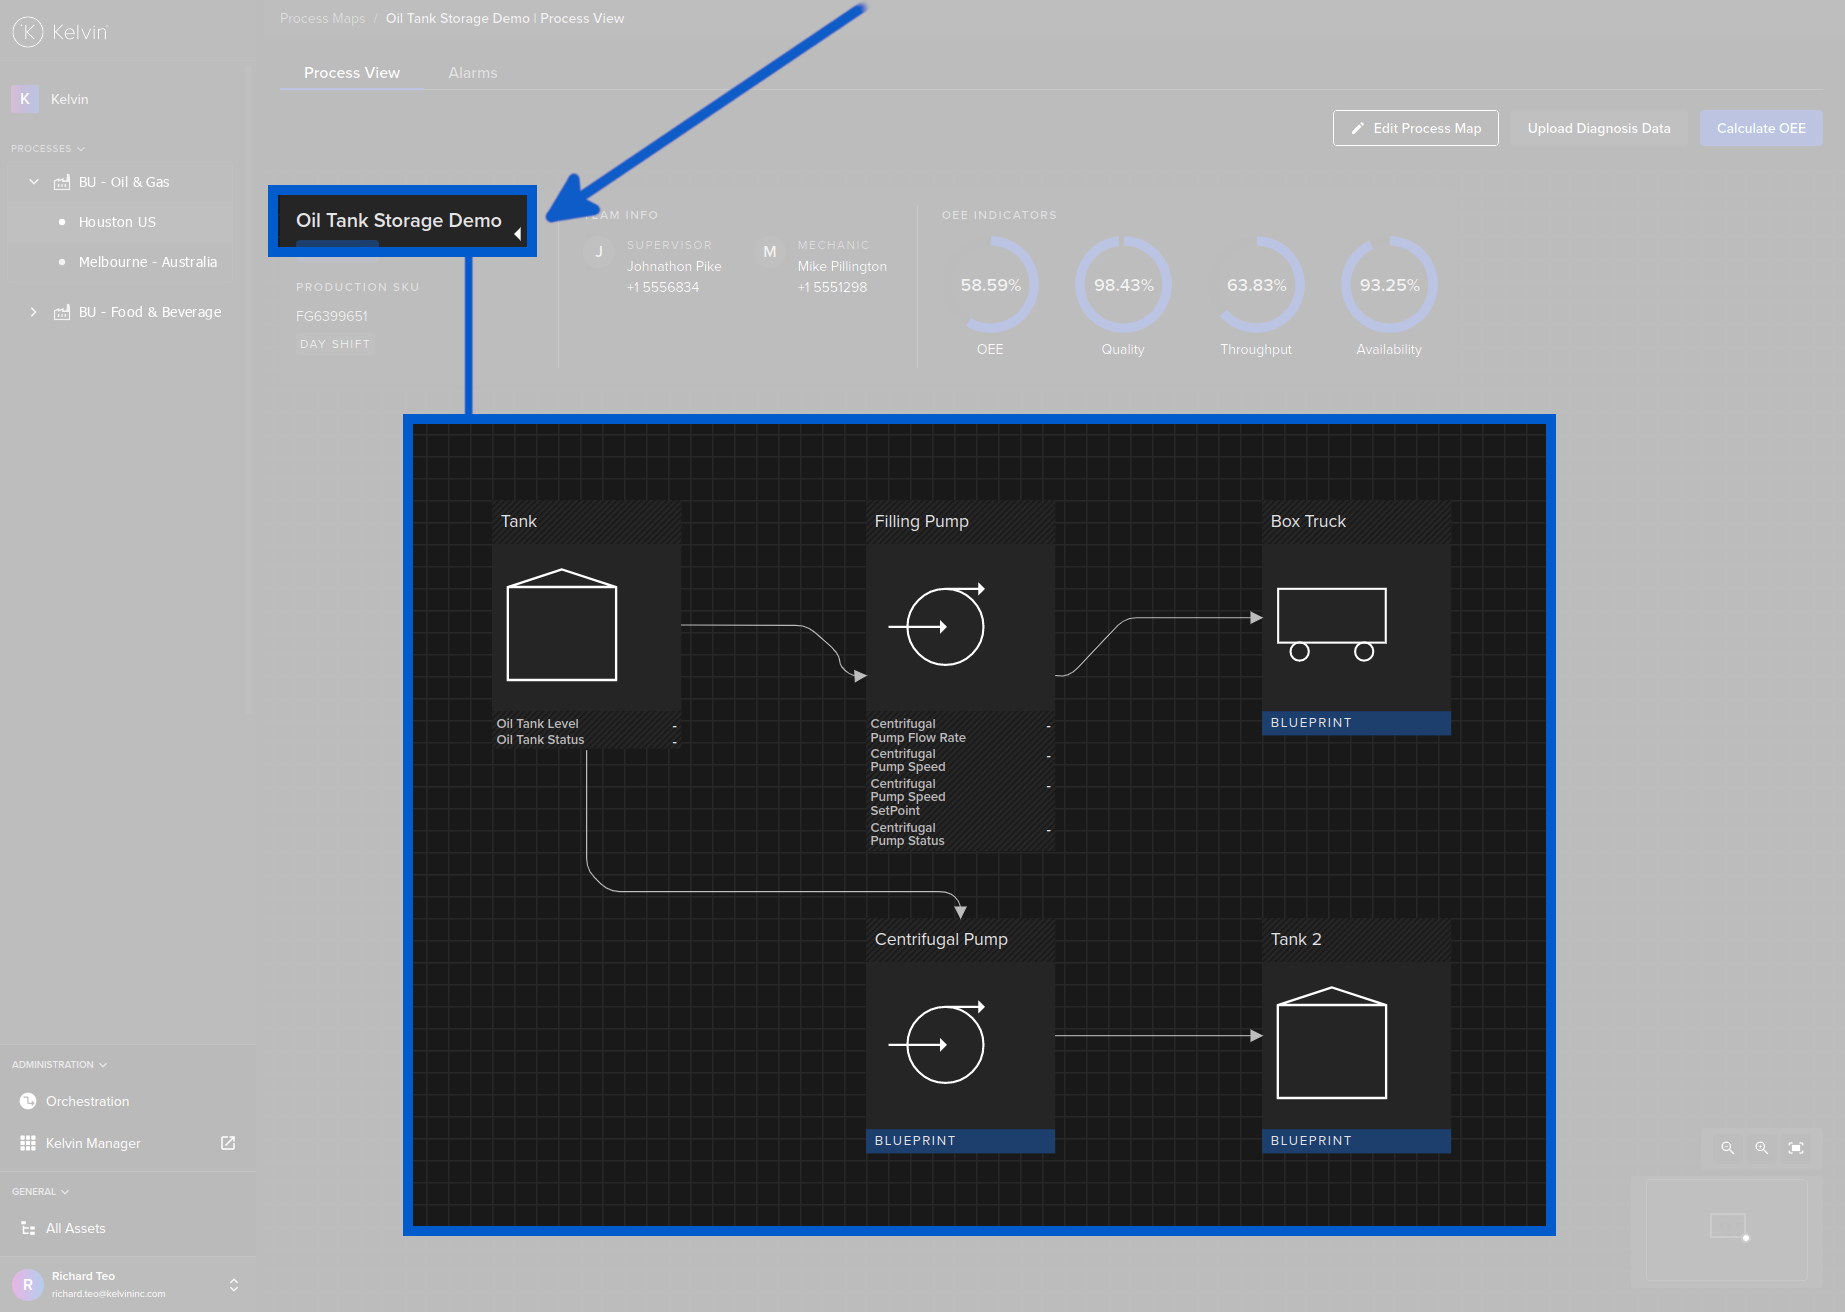
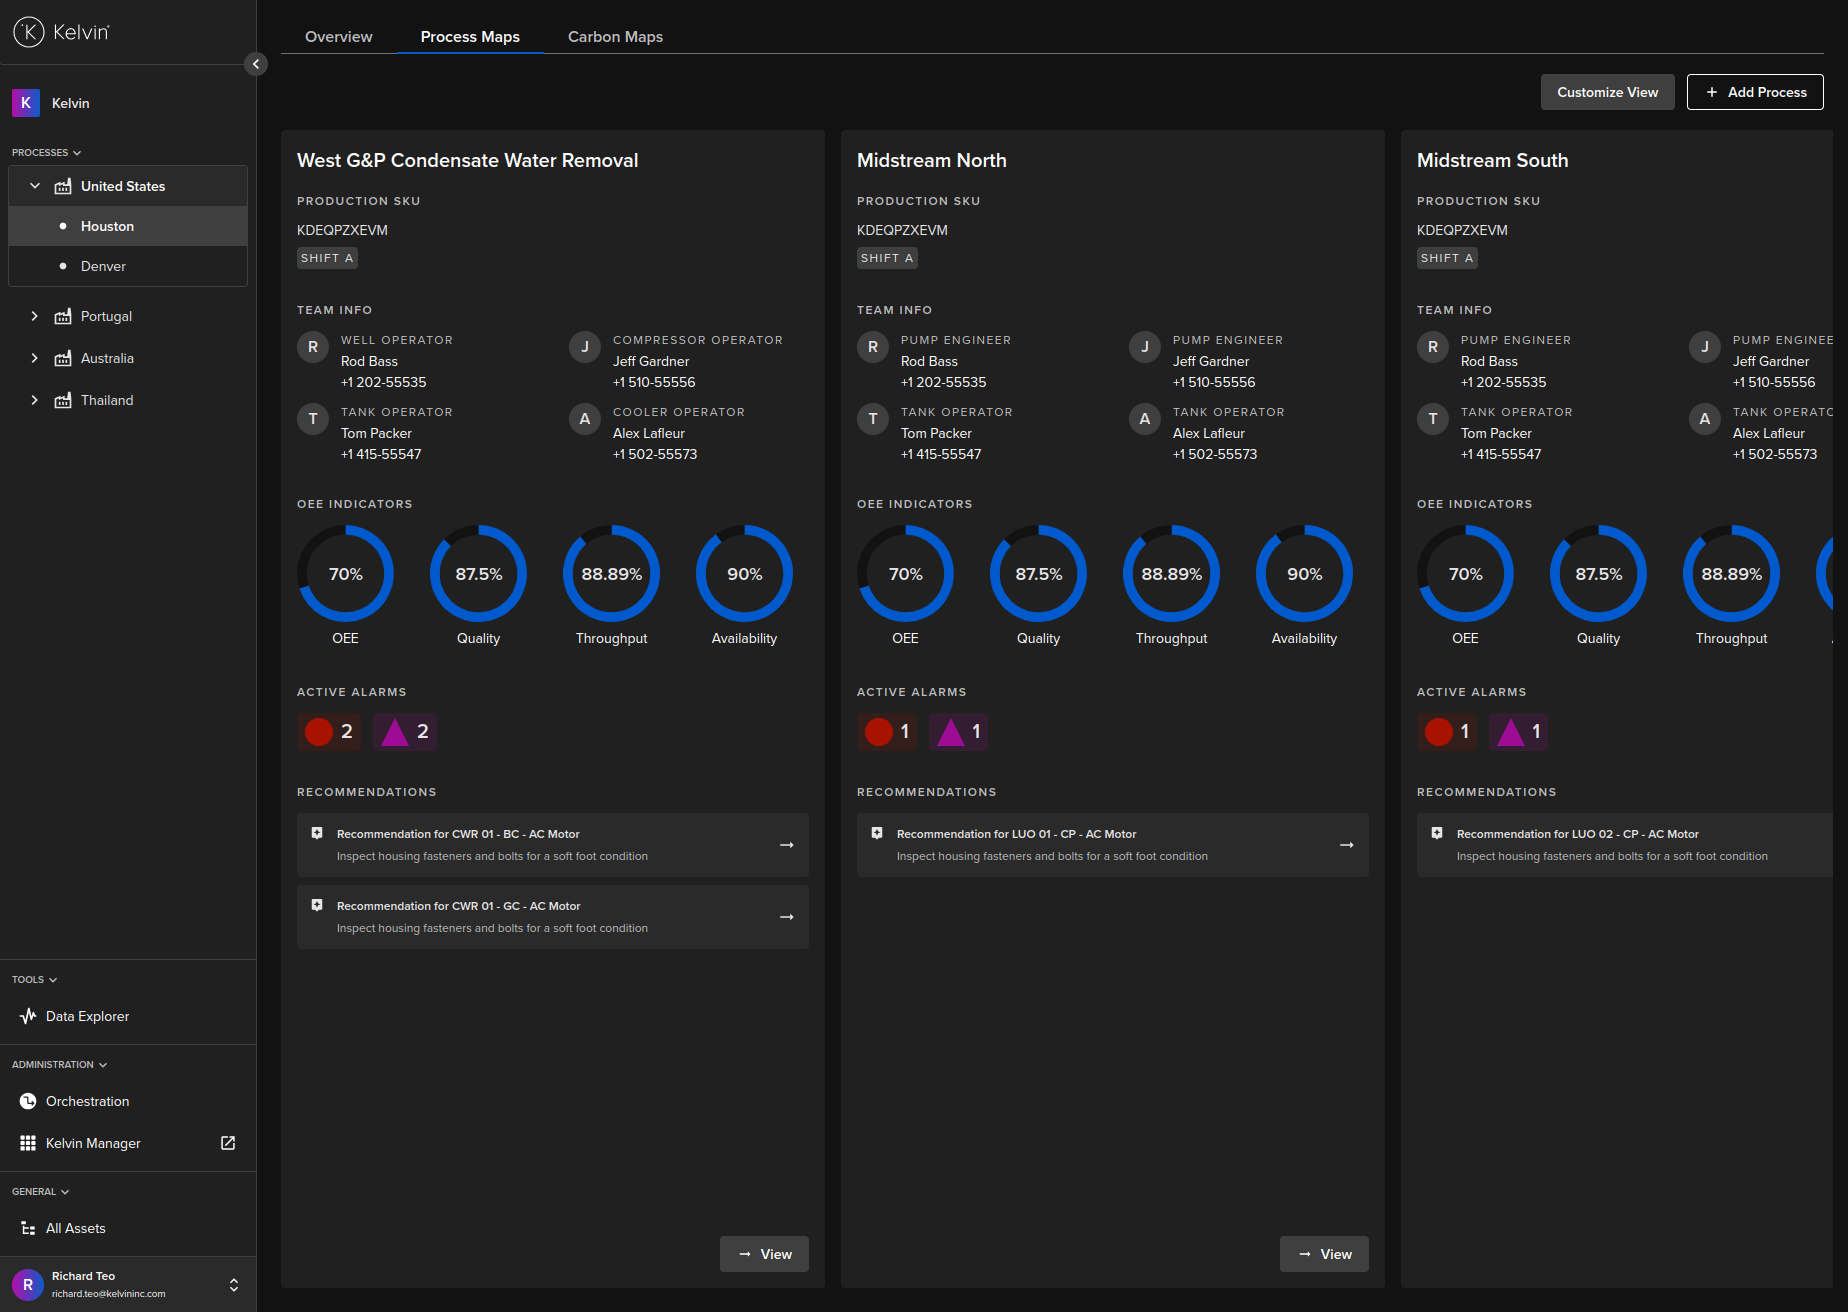
You can either select a Process Map for an overview of all metrics;
Or Zoom into one Process such as a production, a well or machine component.
From here you can zoom into an individual Kelvin Asset by click on the asset itself. In this view you will get information on the alarms on the asset and you can view the data viewer.
Edit Process Map Screen
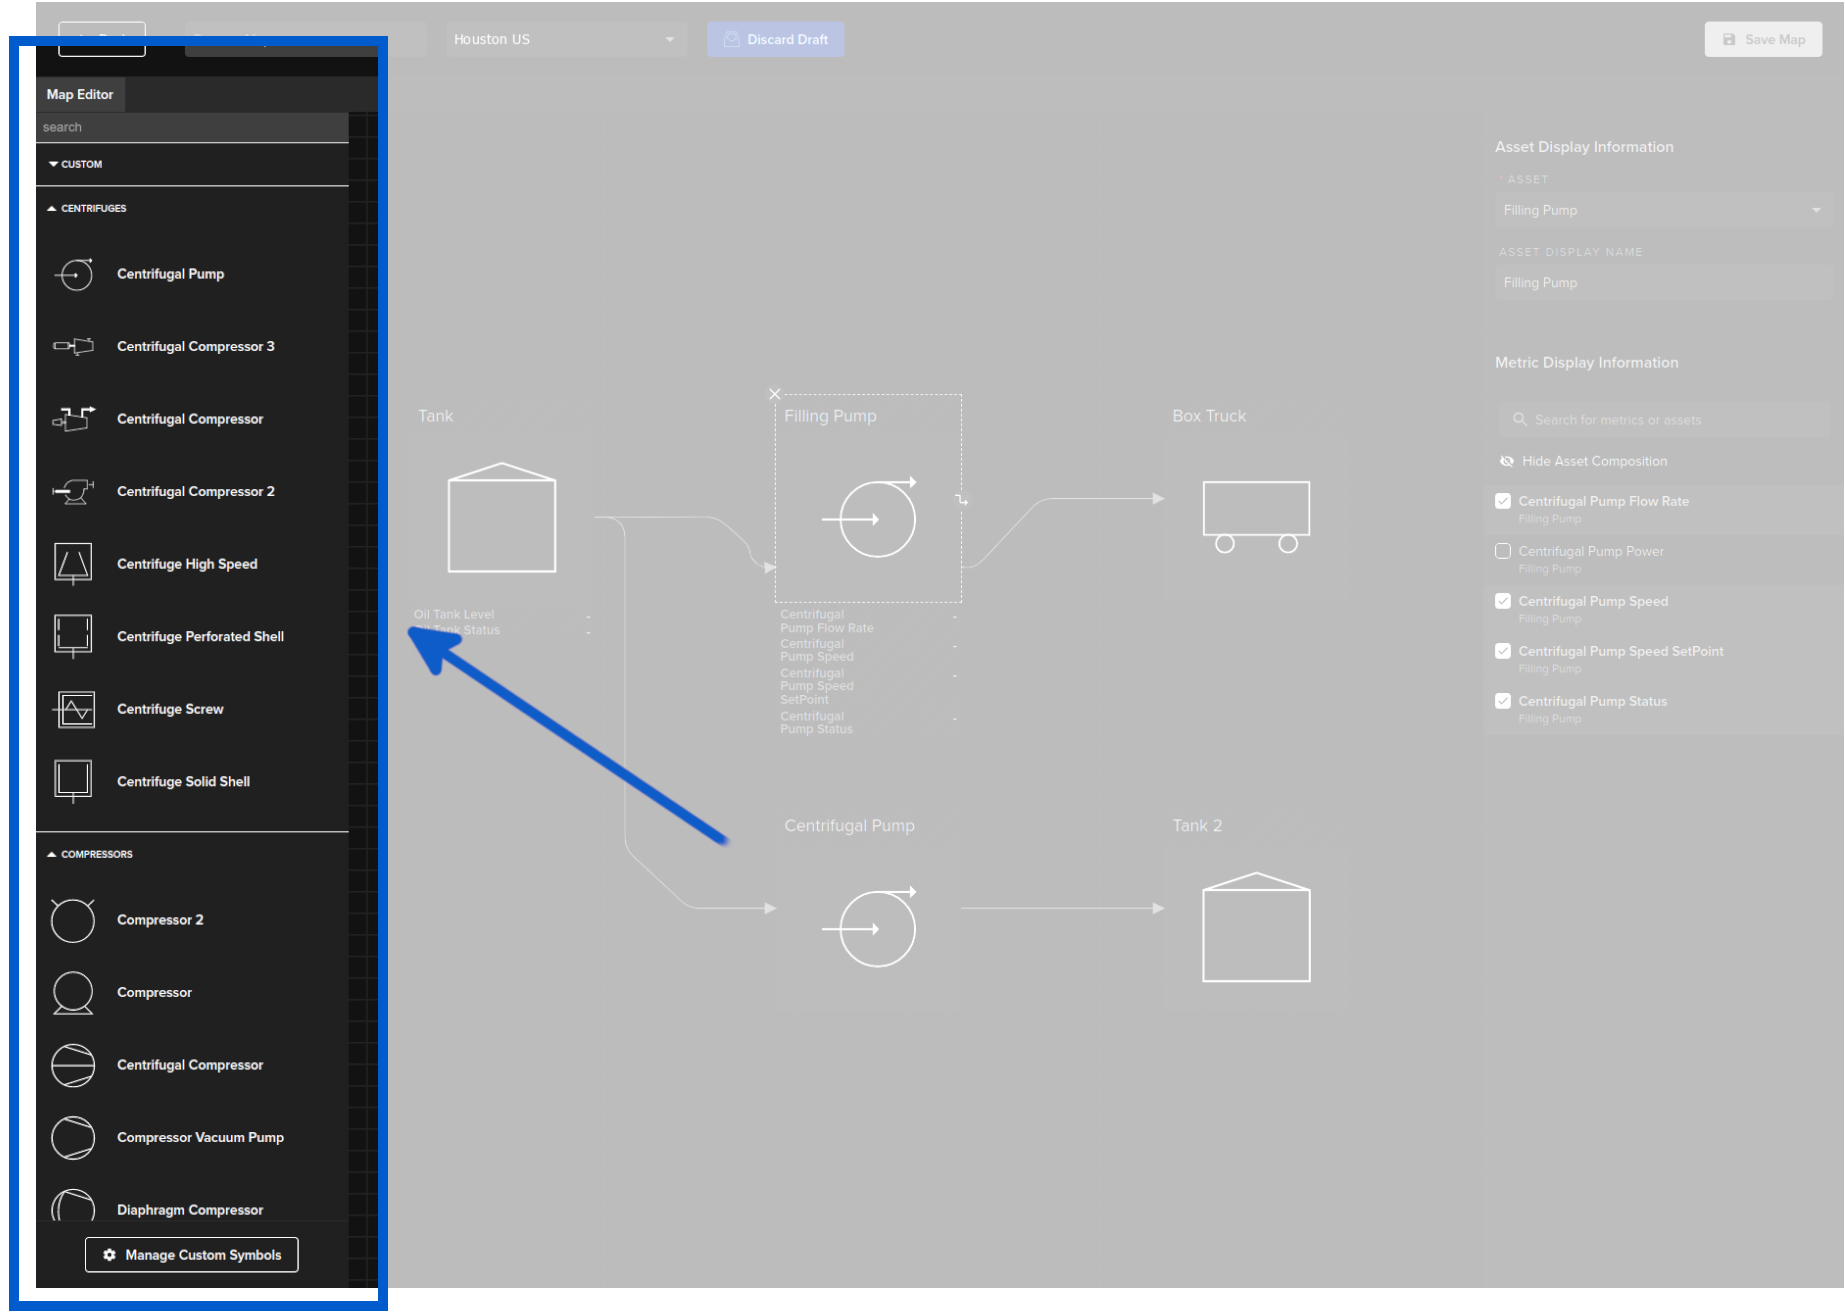
The incorporated Process Map editor allows you to quickly transfer your process flows and data maps into visualization screens.
If you add an asset but don't assign it to a Kelvin Asset then it will be automatically tagged as ![]() which means that this asset is not related to any physical asset.
which means that this asset is not related to any physical asset.
Processes are easily put together with the components library by dragging and dropping. Components can be connected together to create the process flow. The interactive screens act like nodes and can be easily constructed through drag and drop actions.

Then the asset can be attached to an existing Kelvin Asset and multiple Kelvin Metrics from Kelvin Core.
Editing can be done live and production processes can be maintained by authorized operation teams themselves. All edits are immediately updated on all screens ensuring that the full process is consistent across all users.
All versions of a process are saved in the history so if there is any issue with the process view you can easily reload an older version.
There are over 210 asset icons you can choose from on the left hand side. The out-of-the-box asset icons all comply with the ISA standards for P\&ID drawings.
You can also create your own custom assets.
Check out Documentation -> Kelvin Maps -> Kelvin Maps Line Editor for a full list of asset diagrams available.
Rules (Control & Alarms)
Each of your assets normally are controlled with a PLC or dedicated controller. But when the logic has to span multiple assets the traditional method is to do direct communications between each asset and program the two PLC's to talk to each other.
This solutions has a number of limitations such as;
- This is point to point communications, so if 3 assets have to coordinate together, this becomes a complex task
- Usually different assets are delivered by different suppliers, so coordinating the logic control between the three developers already is a hard task at installation and even harder once all the suppliers have finished and left site.
- If you add new assets and want to link this into the inter-asset logic flow, this presents many challenges to implement.
Kelvin (Main UX) is design to be Process Control not an Asset Control. Each Asset continues to control itself directly and only connects to Kelvin (Main UX). Kelvin (Main UX) will then handle all the higher level logic to ensure all assets work together seamlessly.
Any new assets that are added only have to be connected to Kelvin (Main UX). Then any logic or alarms can be programmed centrally.
The advantage is that each asset does not need to be aware of other assets. Kelvin (Main UX) will ensure that each assets has the right commands or set-points to work independently without affecting other assets in the process.
As a bonus it also becomes possible to easily add your MES or Corporate database information into your rules based process. For example you may want to link sales data directly to the operational speed of your production line, so you connect your SAP sales forecast data directly to Kelvin (Main UX) as part of the Rules in Kelvin Maps Process.
Edit Rules Screen
The rules page allows you to quickly create simple or complex formulae to trigger two types of activities;
- Create a new Kelvin Alarm on Cloud Server.
- Create an immediate control change to a Kelvin Metric which is transferred to the asset. The Kelvin Metric does not need to sit on the same asset and can be located on any asset connected to the Cloud Server.
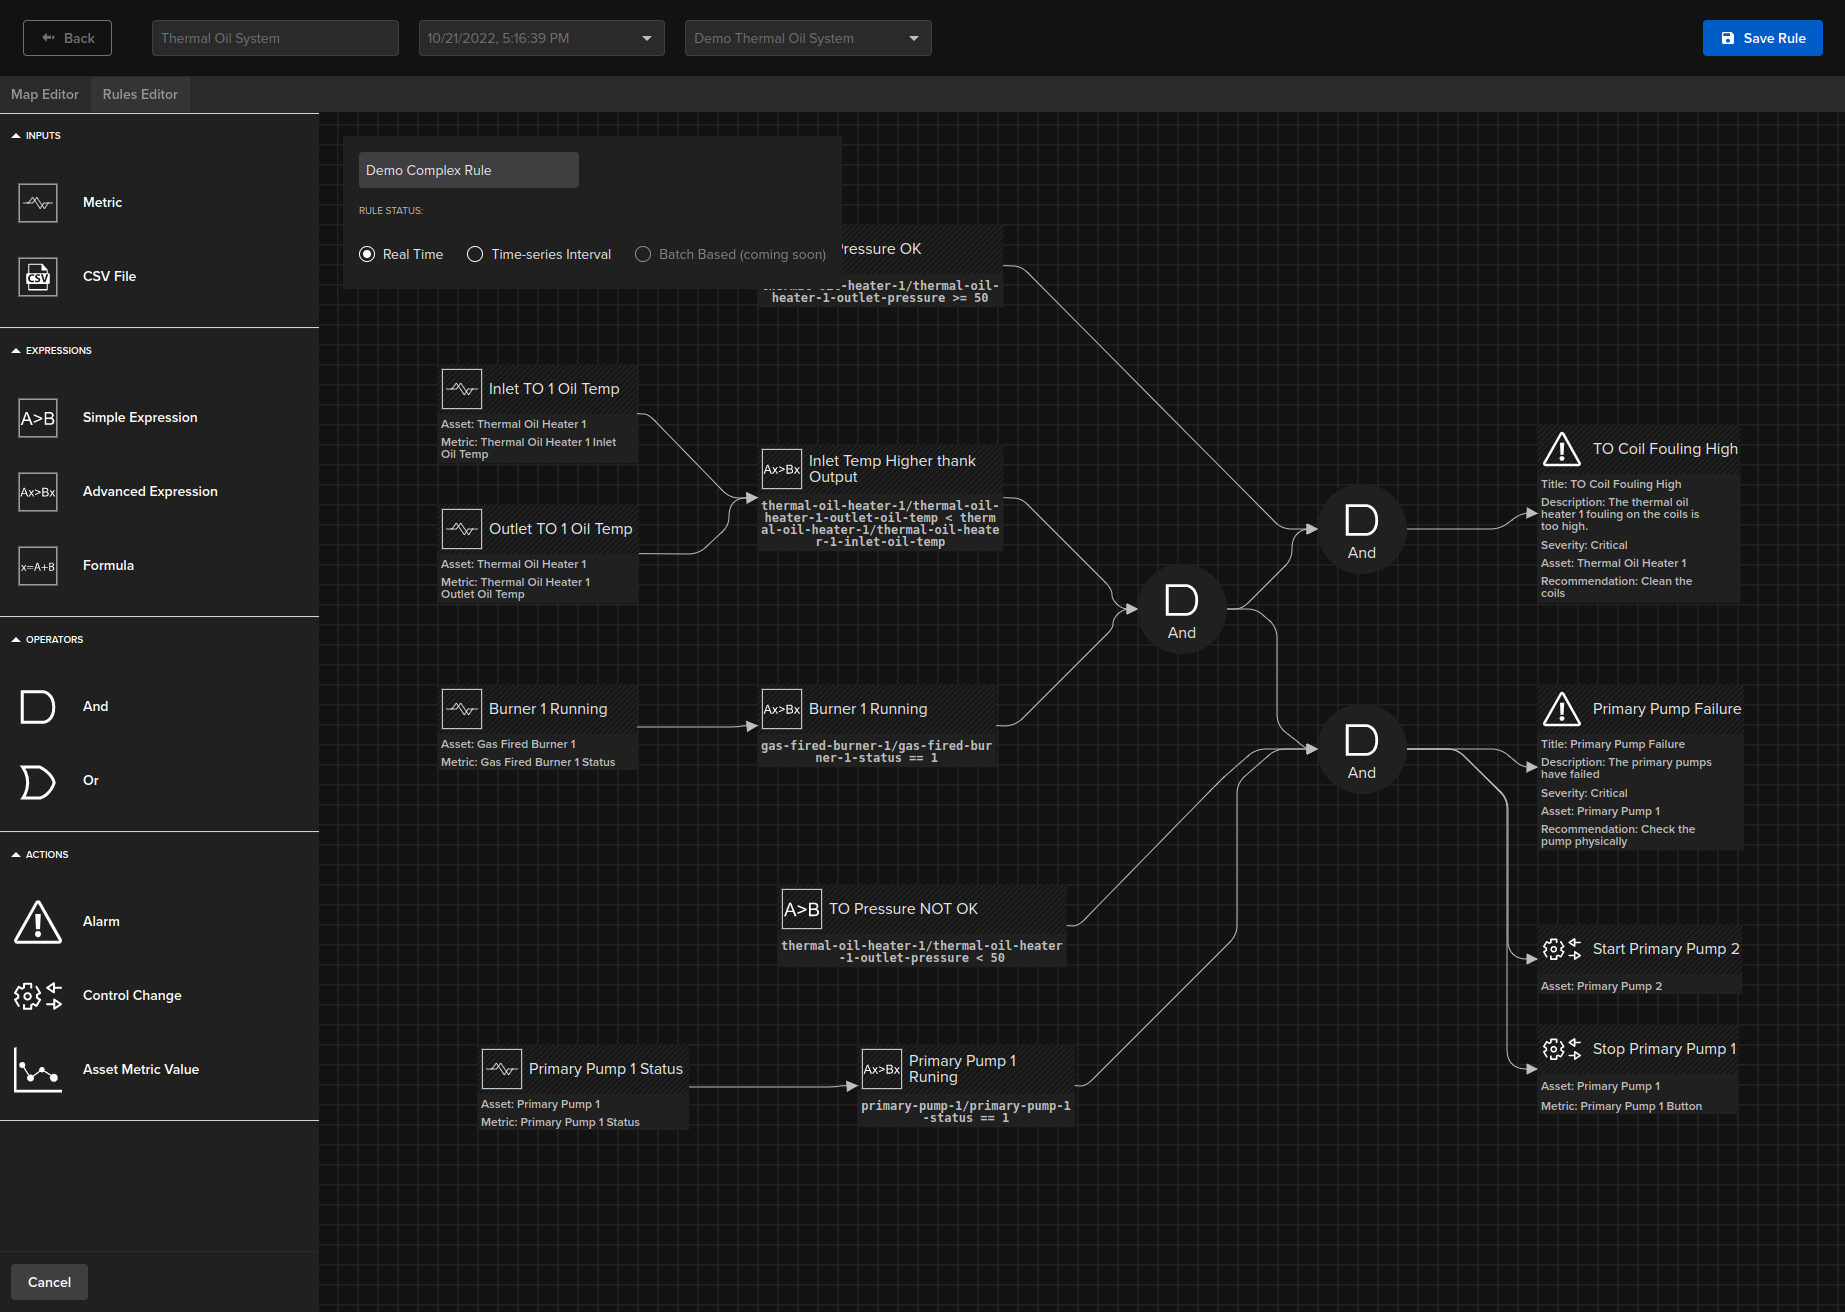
Like with Kelvin Process Map, each version is saved separately and you can revert to a previous version at any time.
All nodes are drag and drop and easily connected together.
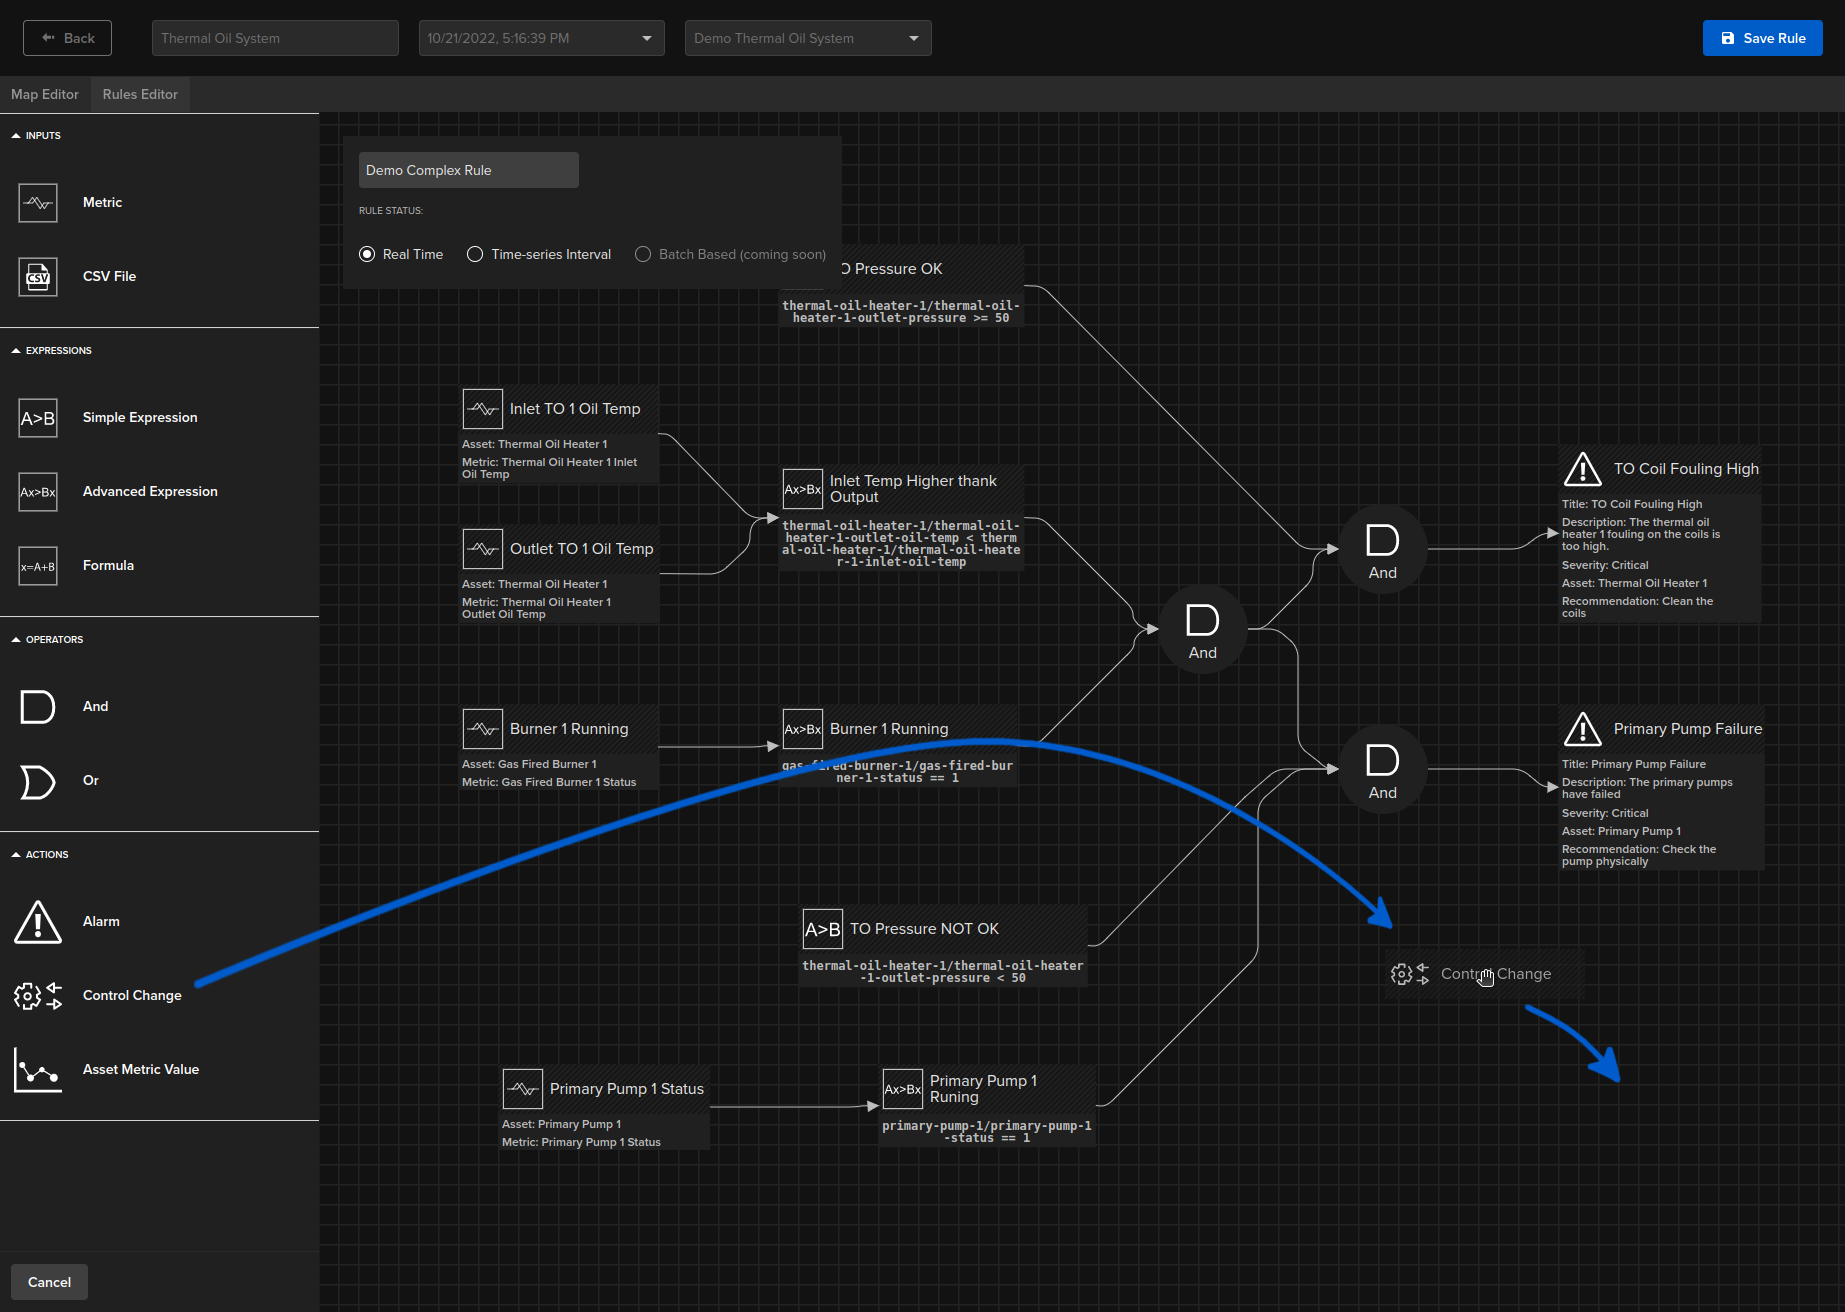
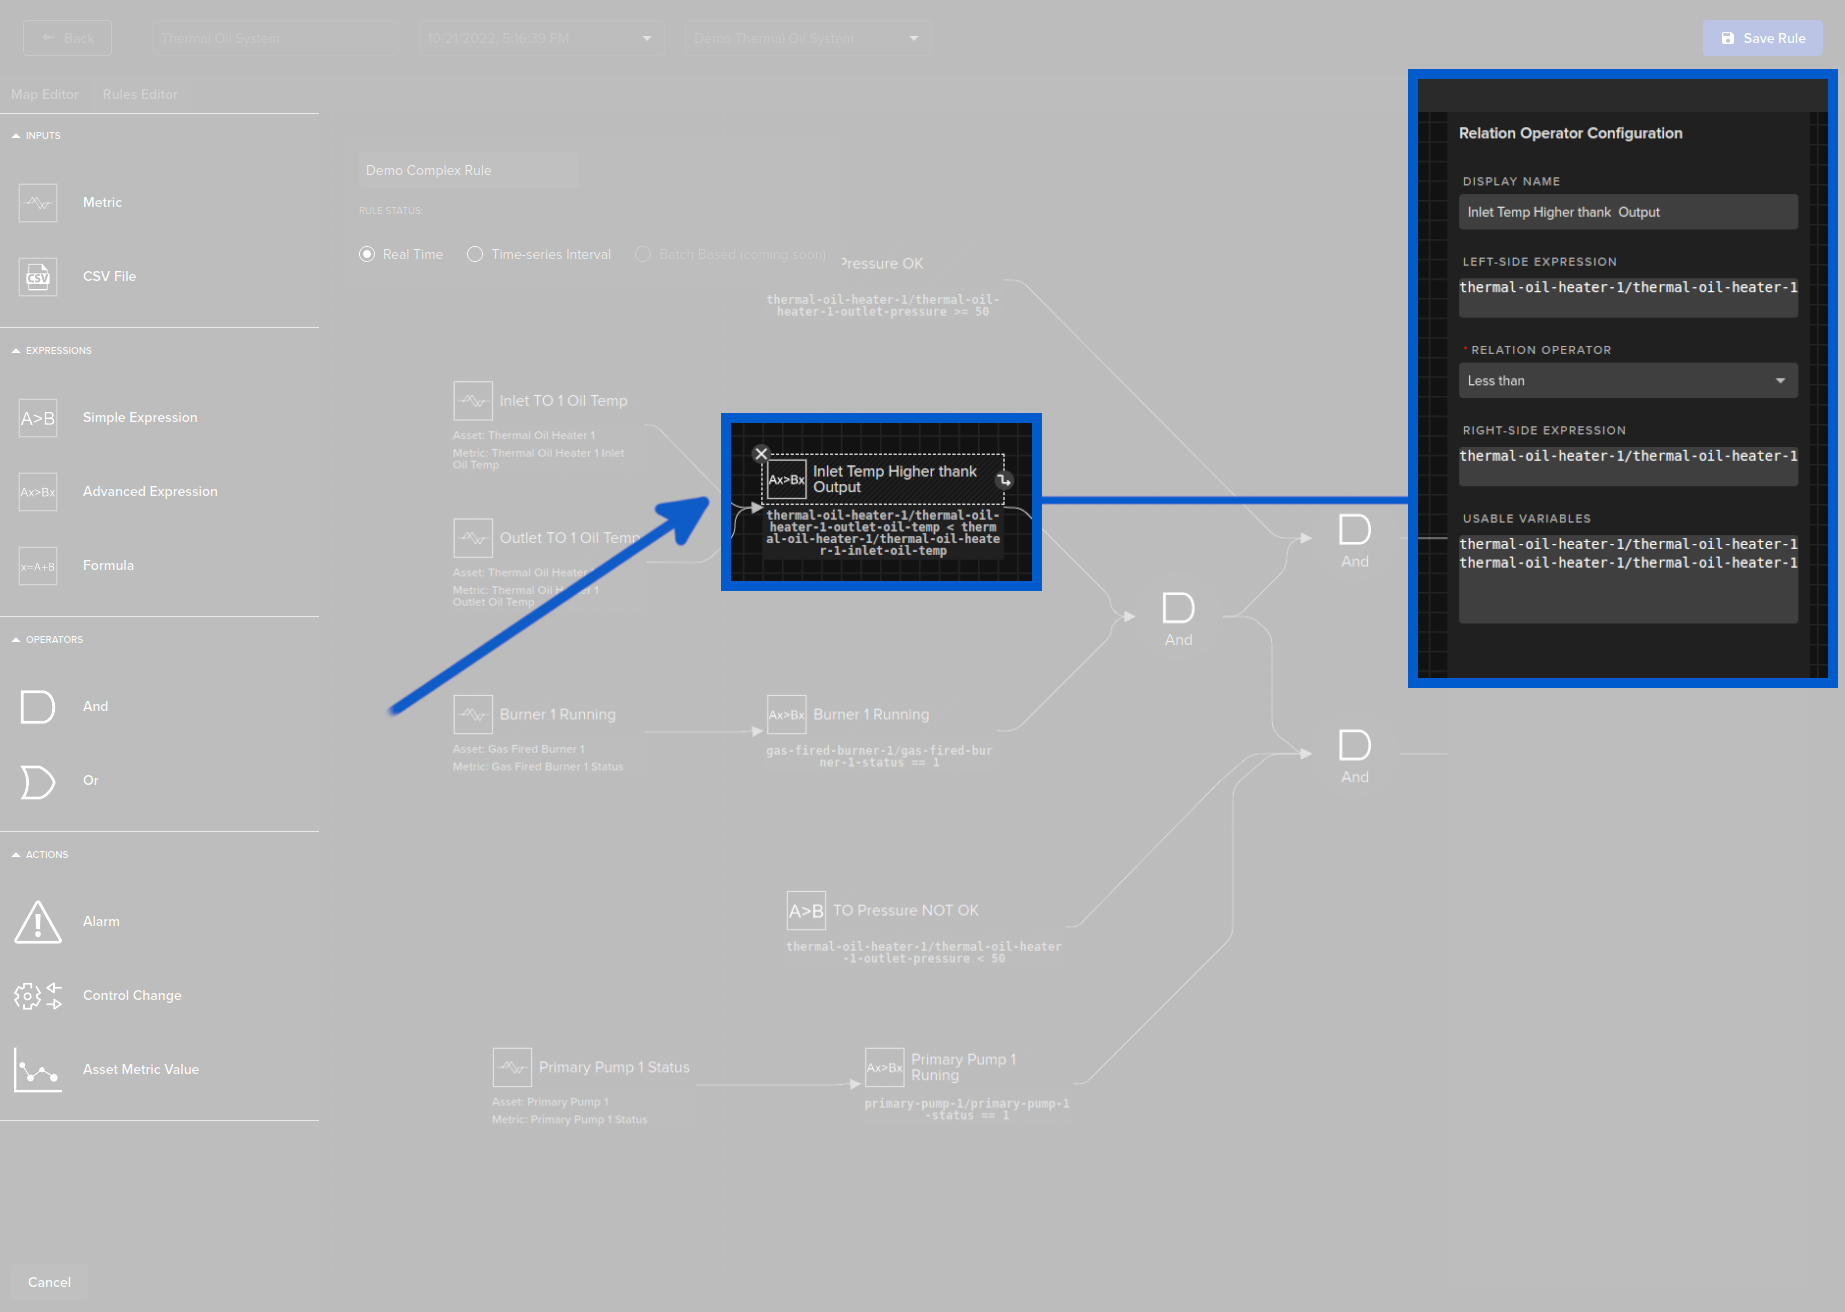
And each node is configurable depending on its function.
Advanced Metrics
Kelvin Maps comes with a number of out-of-the-box advance metrics such as OEE and Carbon Maps calculations. The OEE calculations are be done on your complete process or on selected sub-process.
Get a full explanation at Kelvin Overview -> Kelvin Maps -> OEE in Kelvin and Kelvin Overview -> Kelvin Maps -> Carbon Maps.
Communications
Kelvin (Main UX) is designed to be able to allow teams to communicate effectively in real time between each other.
More than just a communications tool, it will also allow sharing of contextual information and the workflow distribution for maintenance or problem solving.
You can link in any person in your organization using the "@" in front of their name. This will trigger an email with your comments to that recipient.
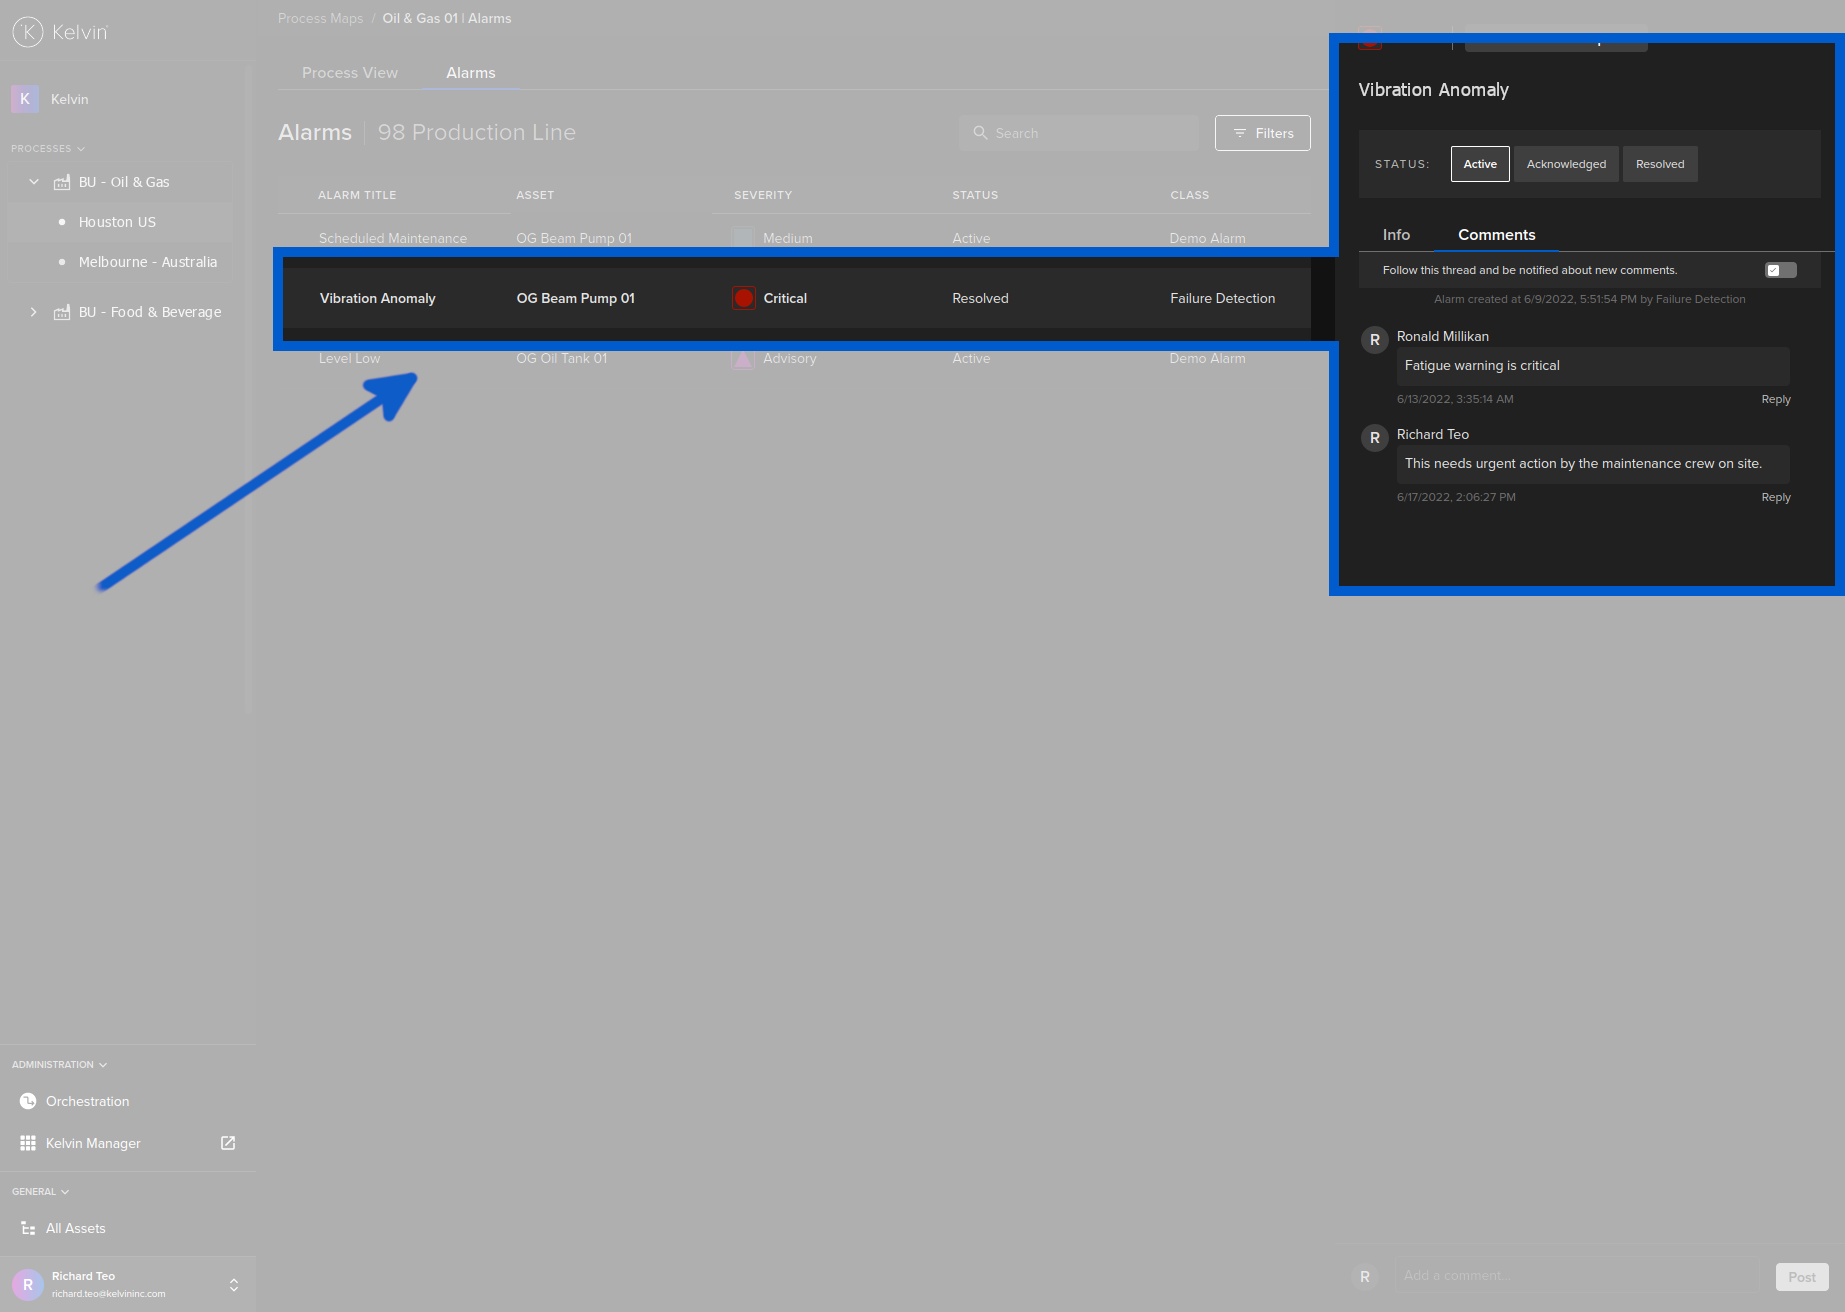
When you click on the Comments tab when viewing a Kelvin Alarm either in the alarm page or the detailed asset view page, you can also see a full history of all discussions related to this alarm event. You can also add your own comments to the thread.
Follow the Thread
If you want to follow all the discussions happening on this thread, then activate the "Follow this thread and be notified about new comments" and you will be notified when any new comments are posted.
The notifications will be sent by email or SMS from your settings in the Notifications page inside Kelvin Manager UI.
Alert People in your Organization
Like many communication apps, you can also directly alert any one in your organisation with an email or SMS by mentioning their handle in the post.
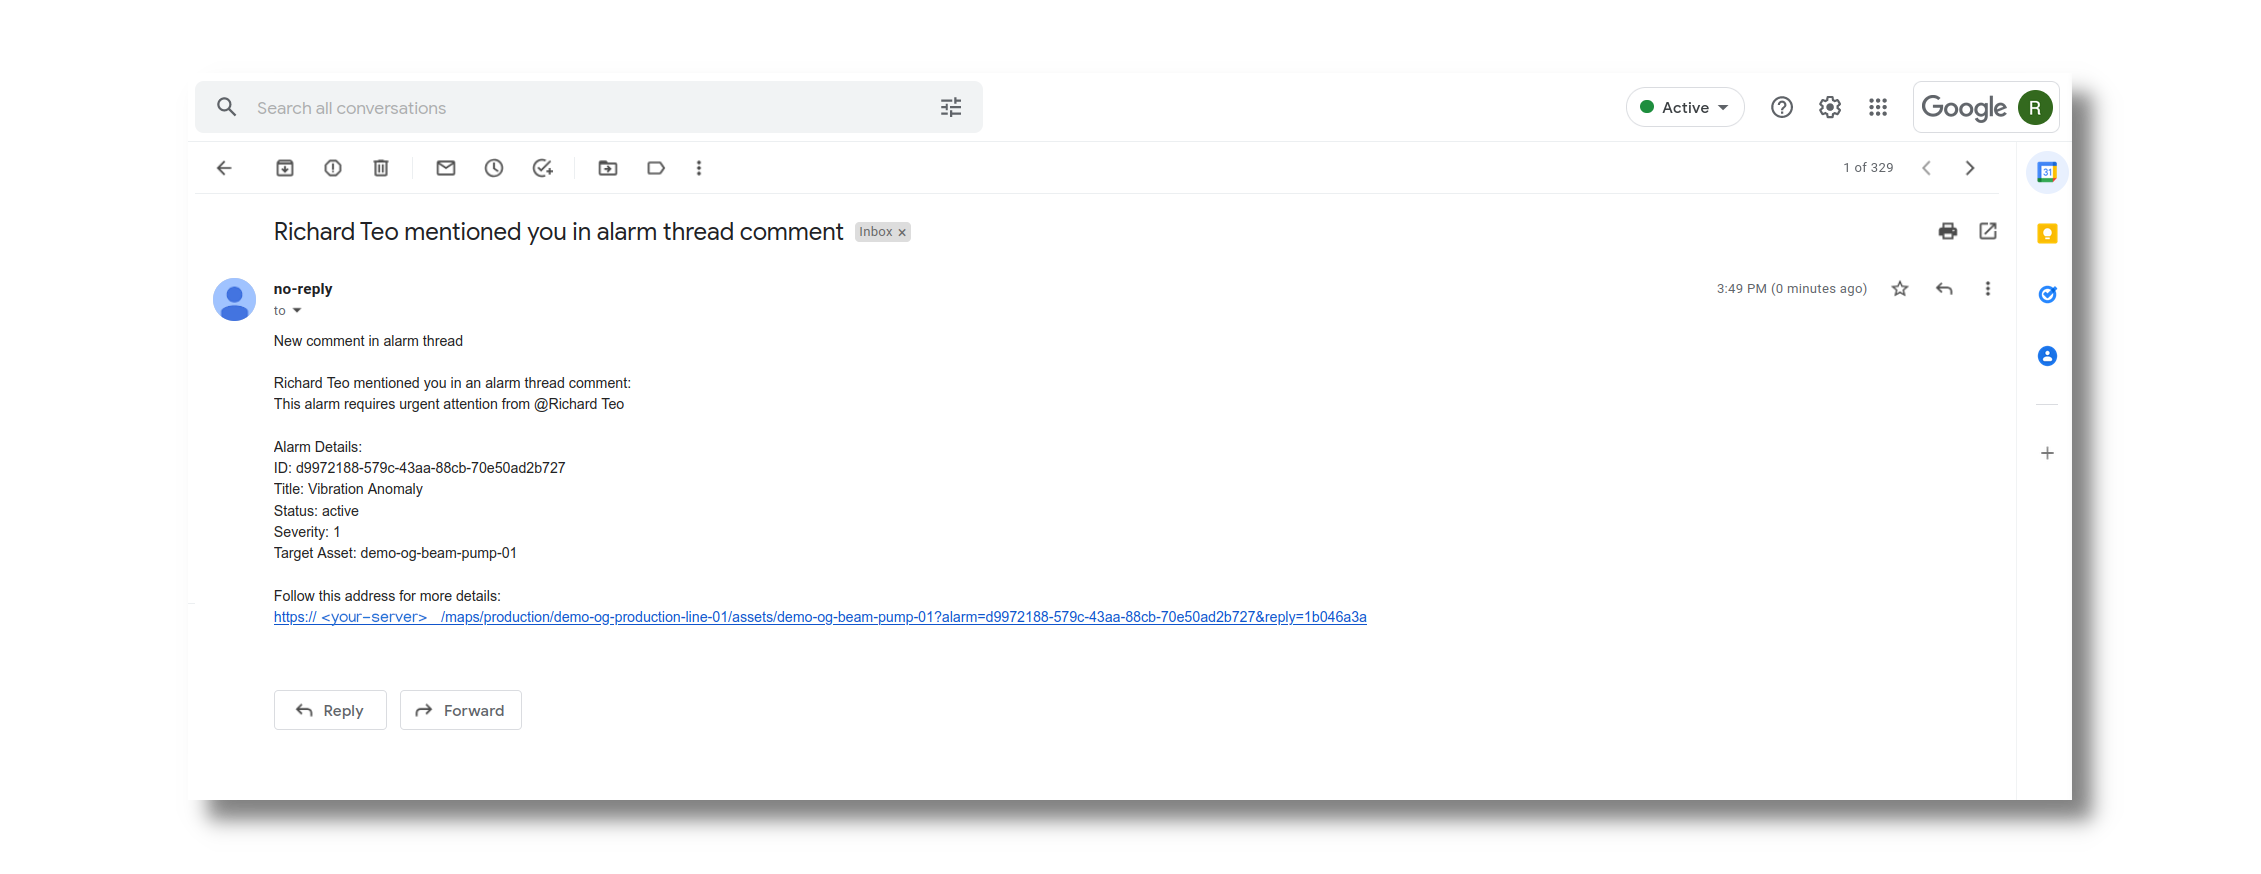
To alert someone, simply type "@" and a list of all people in your organisation will appear and you can select the person you want to alert. Alerting multiple people in one post is possible.
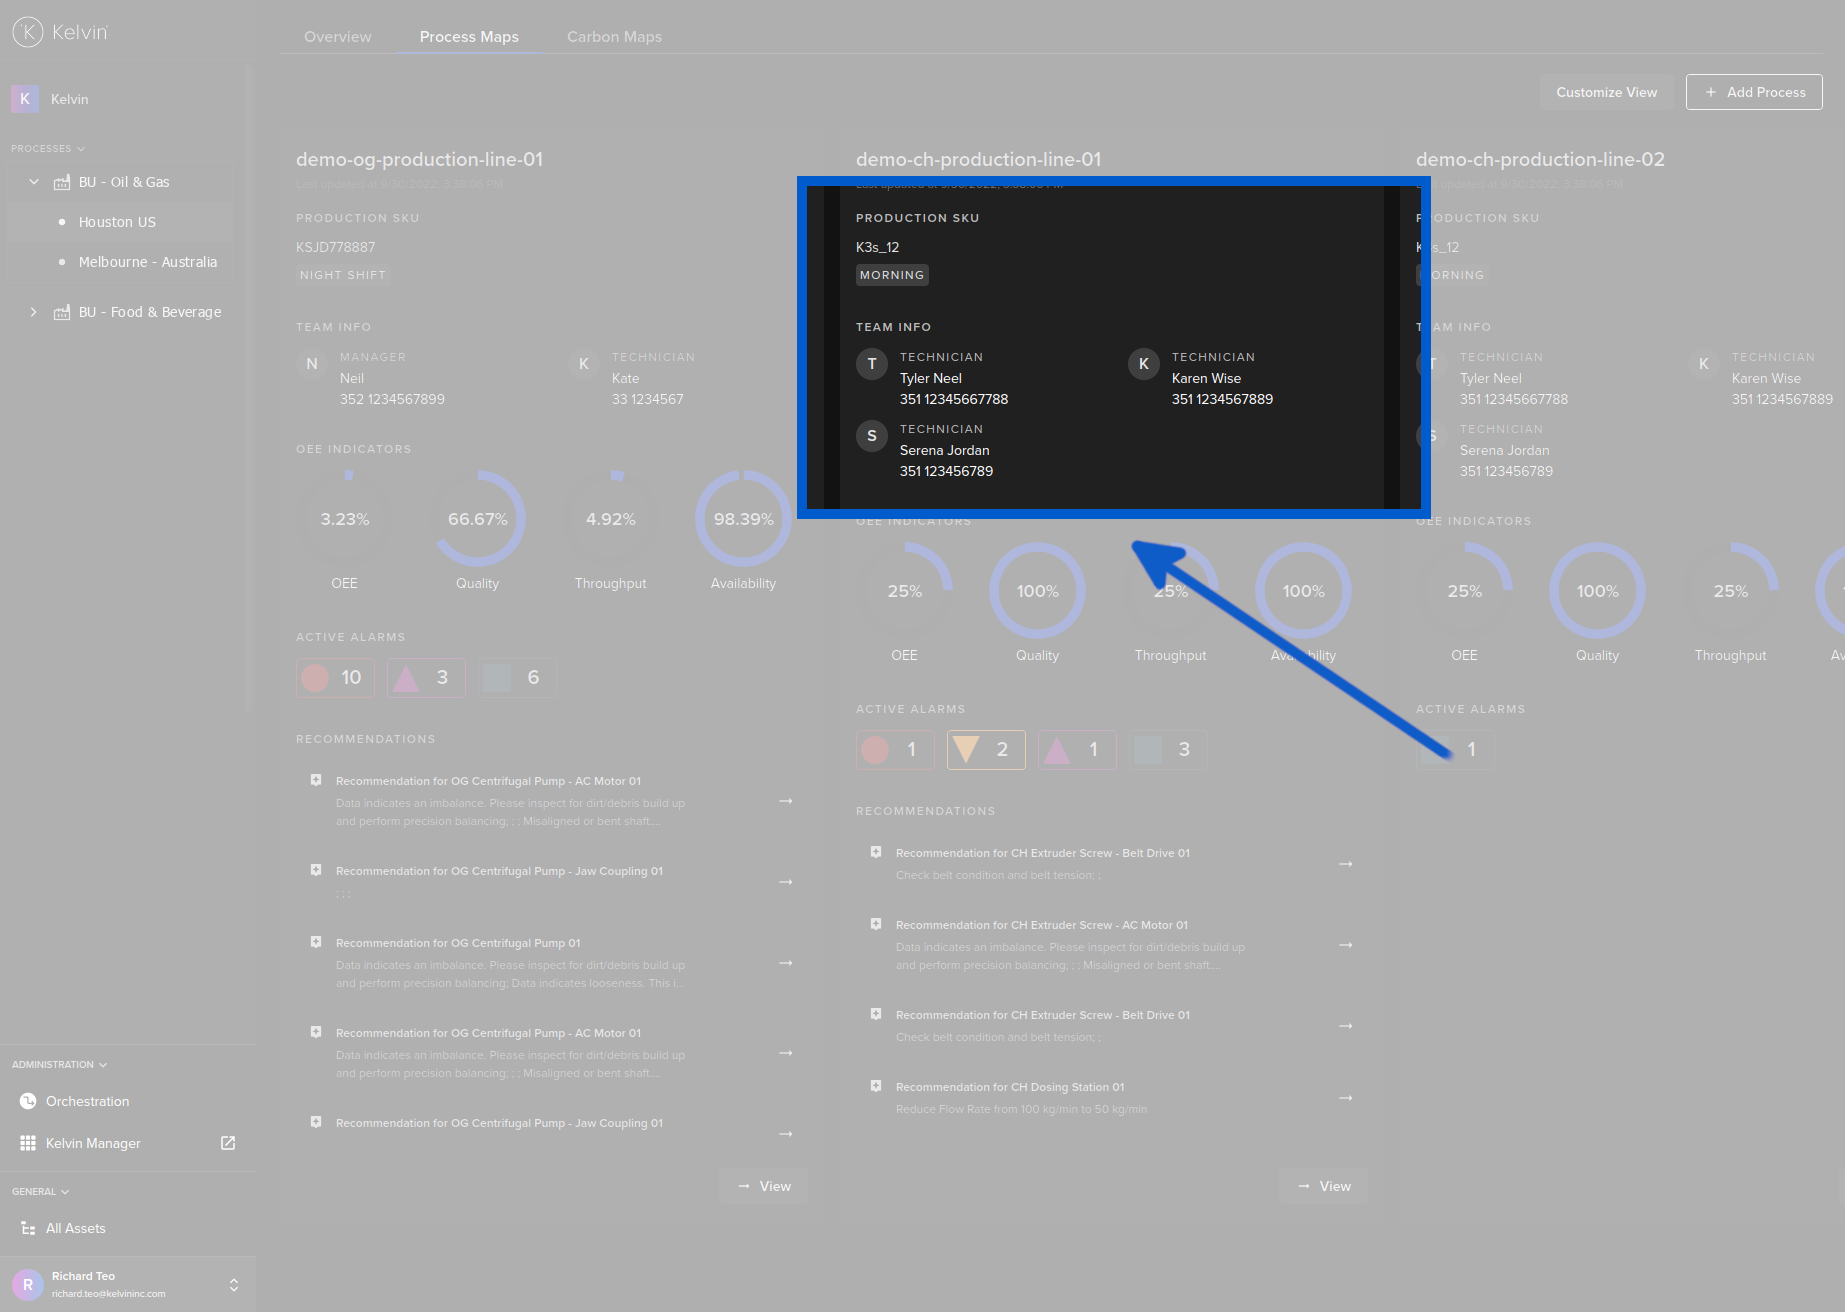
Shift Contact Details
On many of the screens you will also see the contact details of the current team stationed at each process.
Machine Learning Models
In Kelvin (Main UX) many of the assets in a process flow come with built-in machine learning failure detection. This near real-time monitoring ML will provide unsupervised anomaly detection allowing teams to plan for asset maintenance during planned shutdowns.
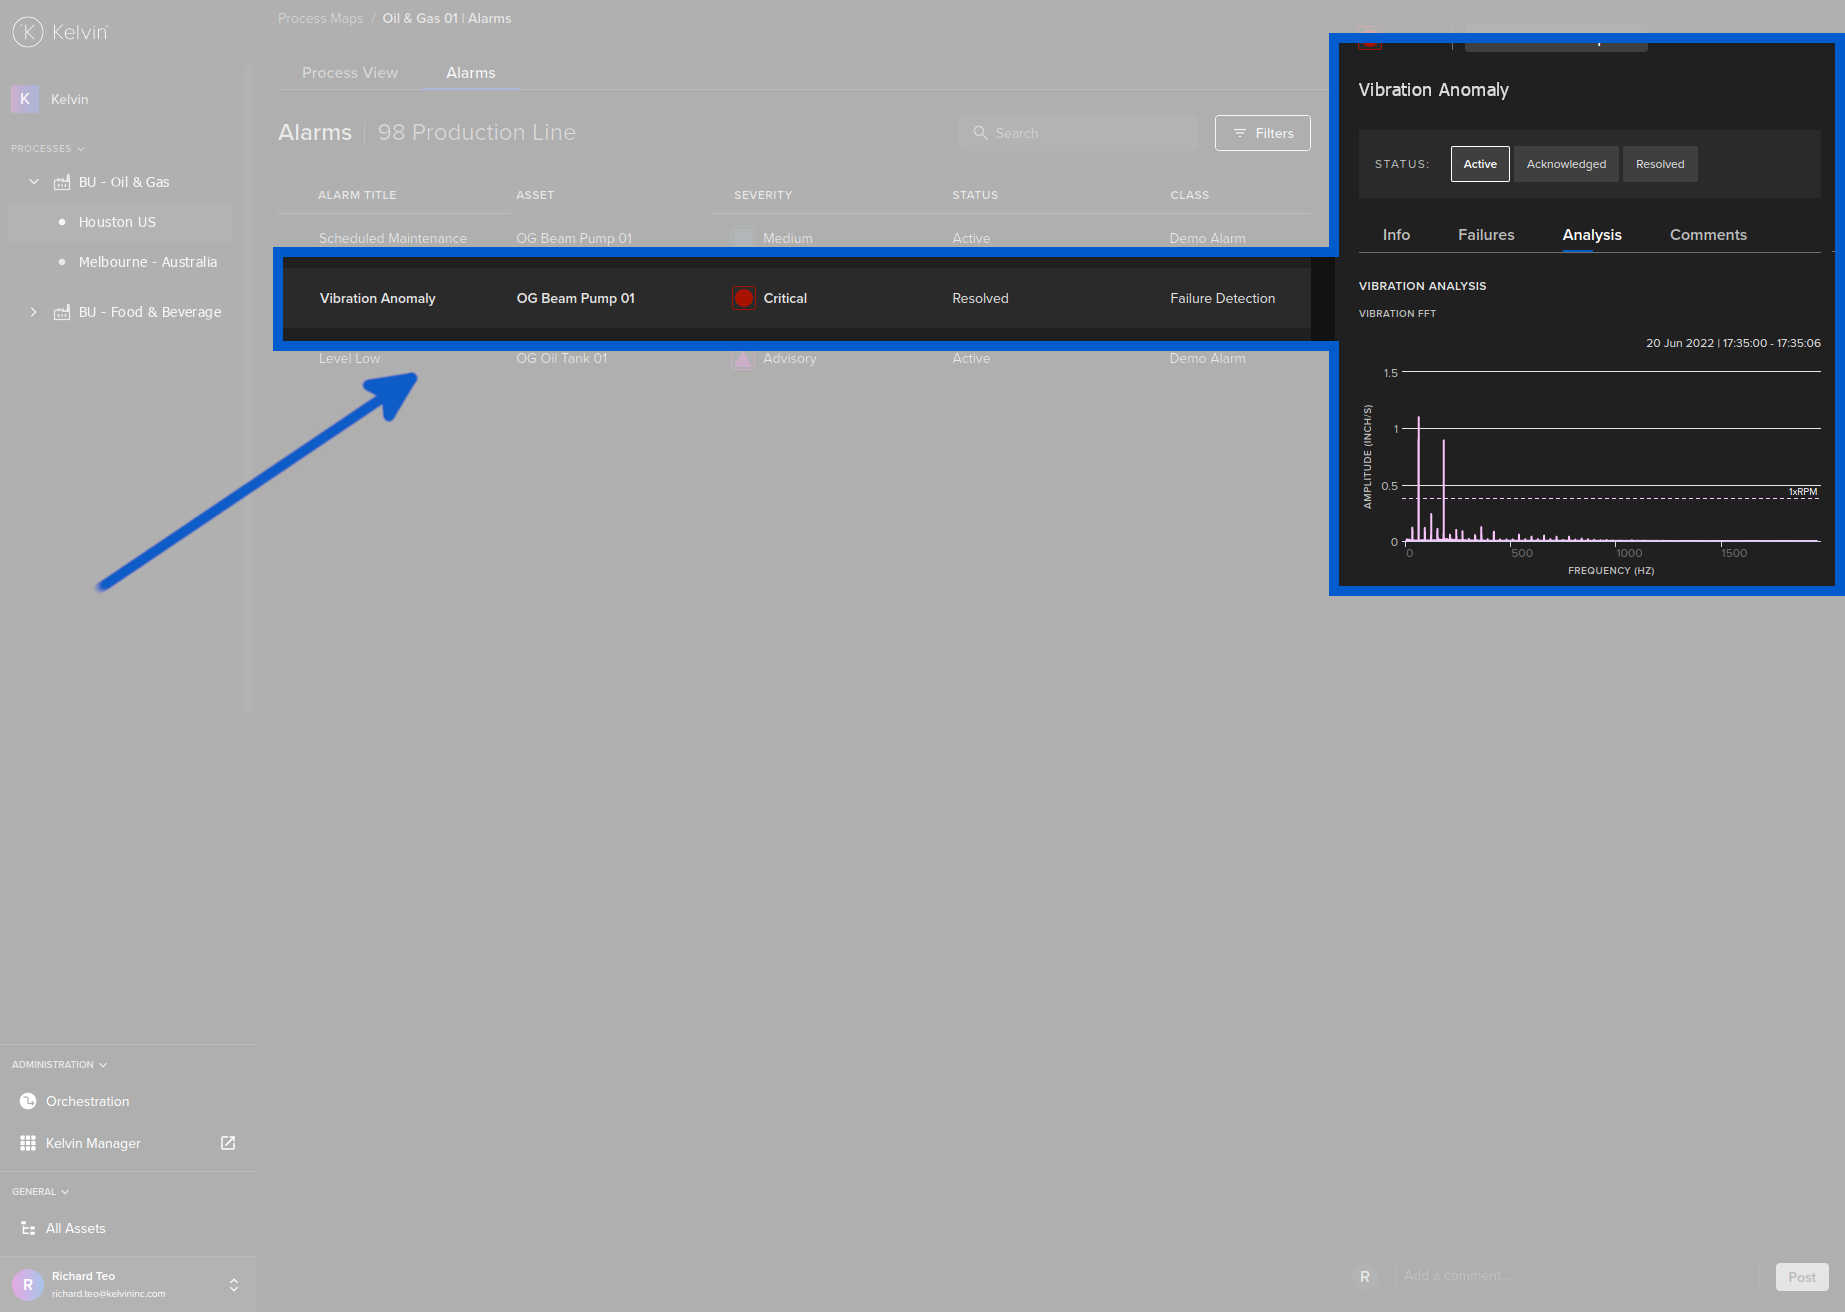
The machine learning models are ready out-of-the-box and do not need any training. The models have been created and trained using decades worth of industrial data on many different types of asset brands and operations. The more information you can give about your assets, the more accurate the machine learning models will perform.
Simulation and Offline Data
Kelvin (Main UX) incorporates a digital twin to allow for simulation or import of offline data.
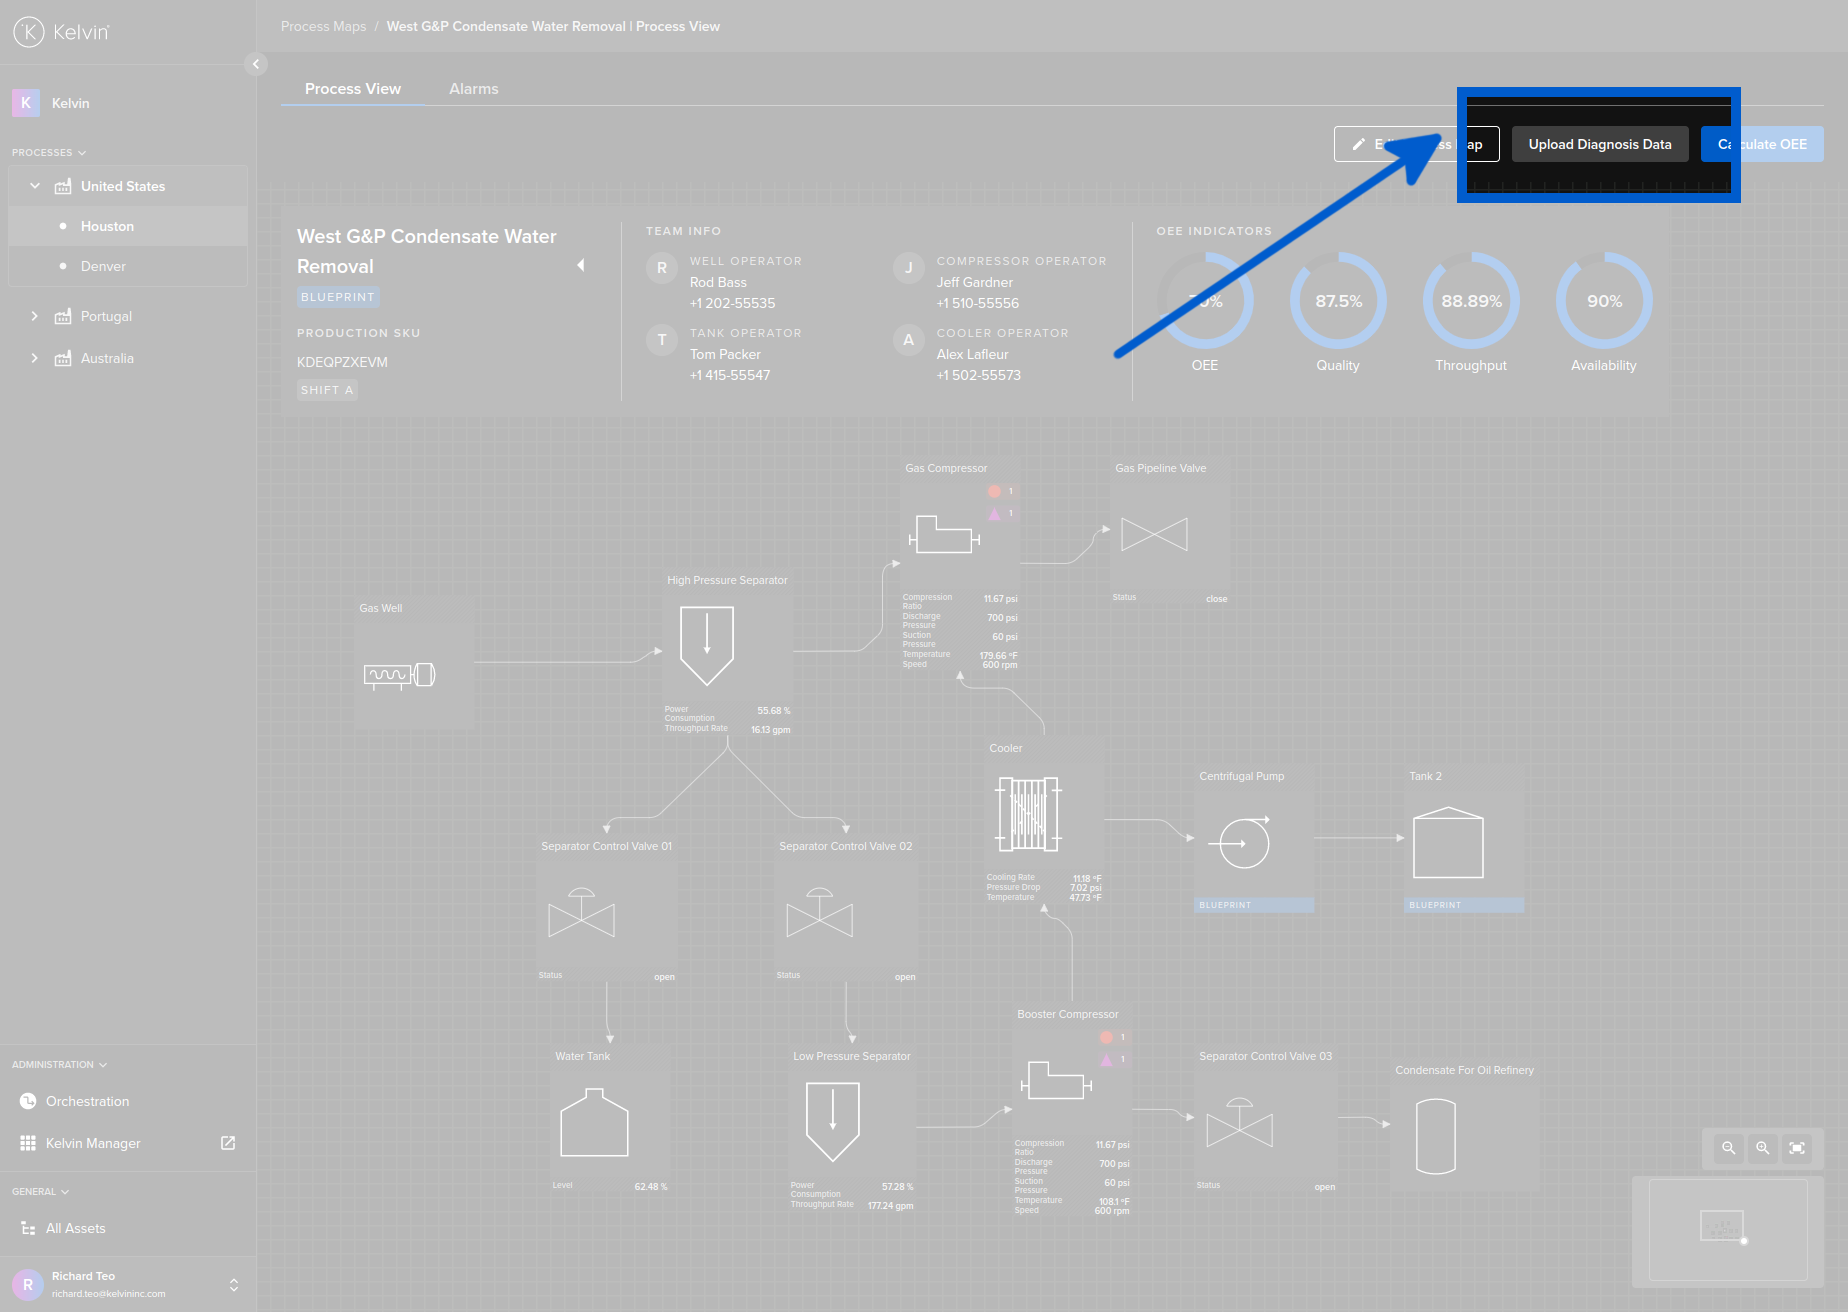
By adding in your own data you can monitor the process flows and see which data is optimal for your overall process flow.
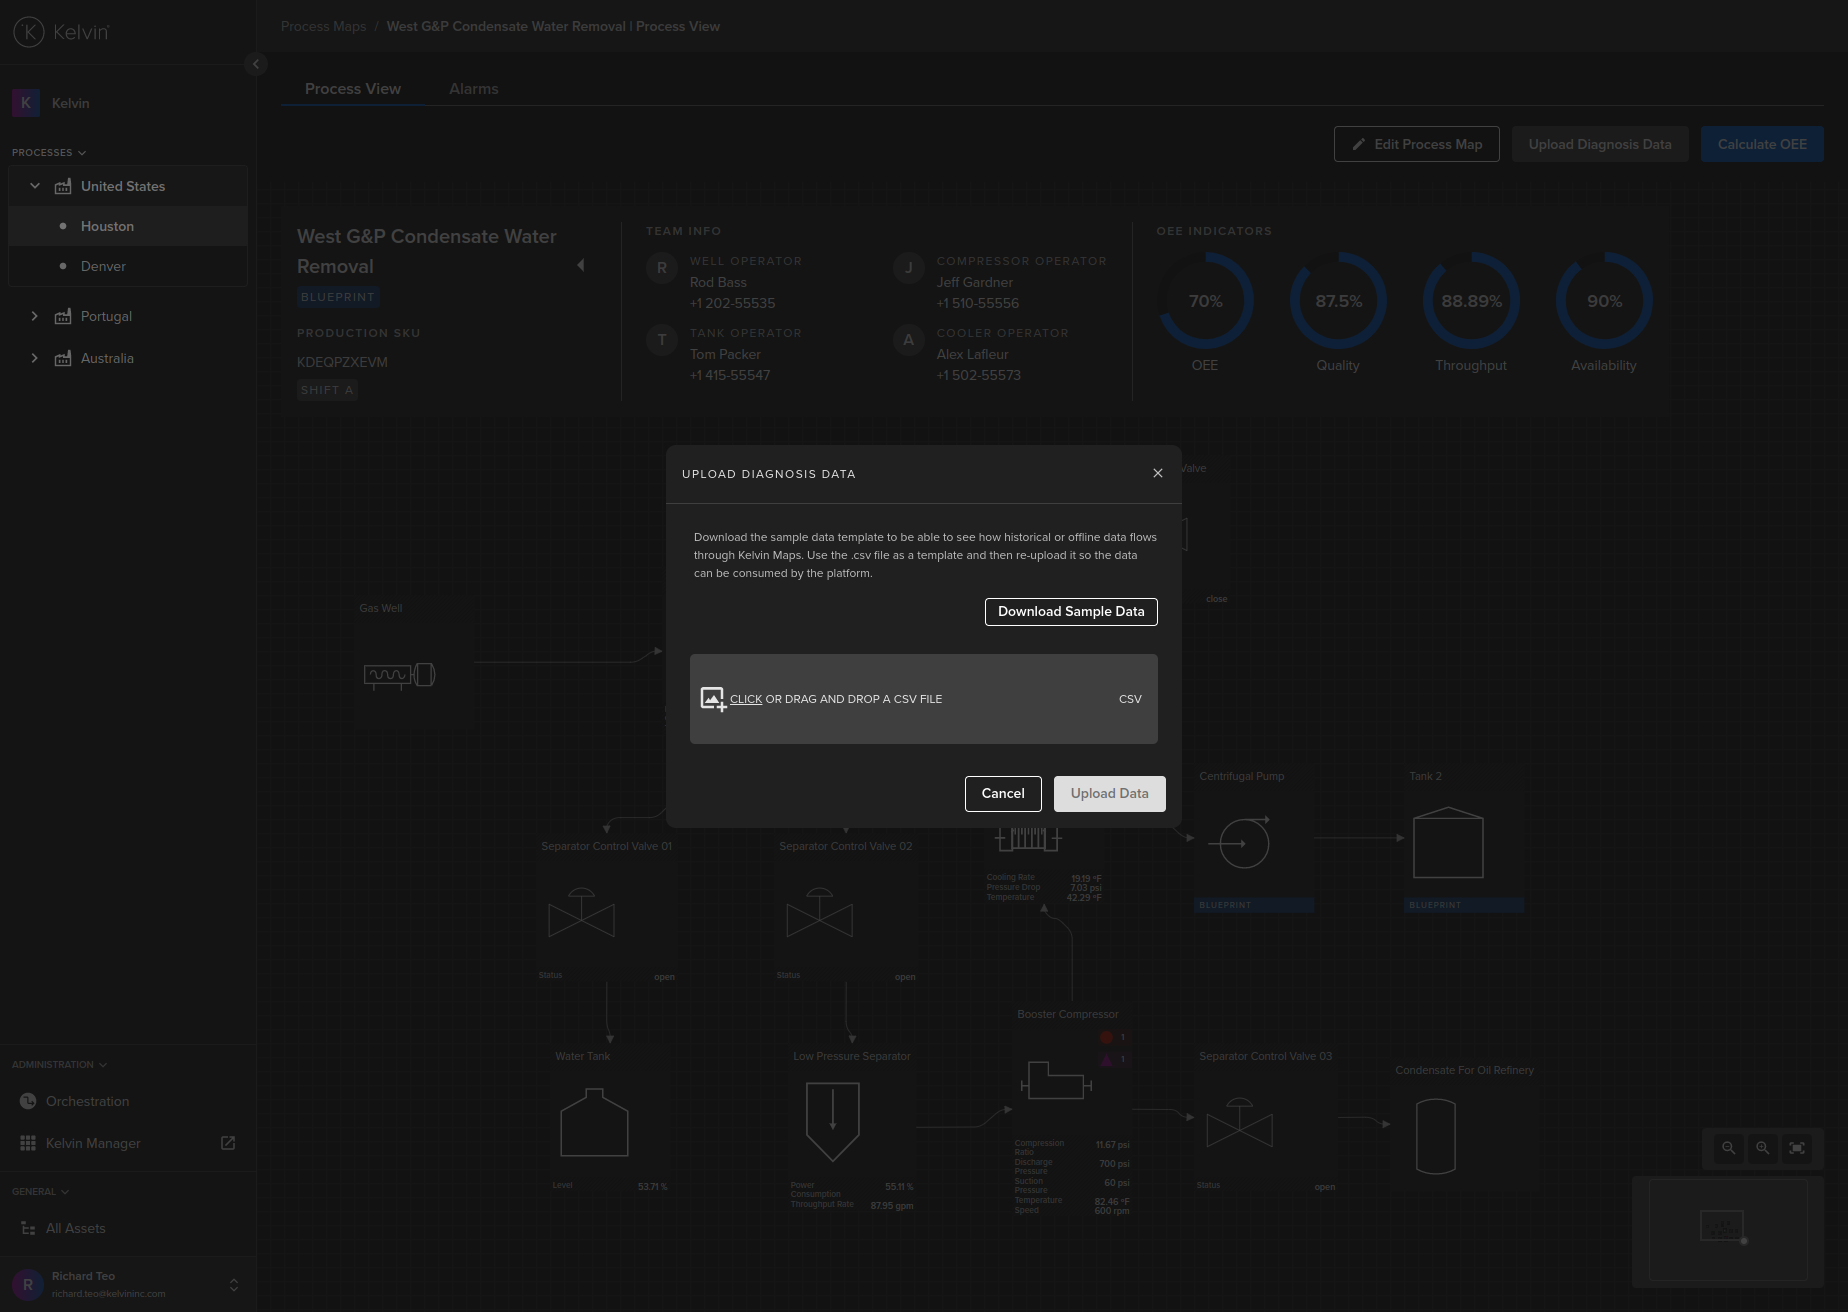
There are two distinct uses for this;
- Upload simulation data to see the effects of modified data on your process flow.
- Upload data from an offline installation to view the process flow and failure detection with Kelvin (Main UX) without being connected with the installation.
Other Related Links
- Kelvin Overview -> Overview
- Kelvin Overview -> Kelvin Maps -> Carbon Maps
- Documentation -> Kelvin Maps -> Kelvin Maps Overview
- Documentation -> Kelvin Maps -> Kelvin Maps Alarms
Last Modified
Last Modified on 29th May 2023
29th May 2023
* Updated all infographics with latest Administration menu
28th February 2022
* Updated the Kelvin Maps Data Explorer with new features and screens
16th February 2022
* Updated Kelvin Asset Alarm views
13th December 2022
* Updated Kelvin Rules screenshots
27th October 2022
* Added documentation for the Rules Editor in Kelvin Maps
10th October 2022
* Updated Infographic of Kelvin Maps
7th October 2022
* Major update of the text and infographics for v4.7 release
28th September 2022
* Updated Kelvin Alarm description and limitations in the 2D/3D view
26th September 2022
* Update Carbon Maps with Configure Options
* Added the Simulation Tag information
19th September 2022
* Update infographics for Kelvin Maps
24th August 2022
* Started new detailed last modified section
Kelvin Documentation AI Support
Hi. My name is KevDocBot. How can I help you?