Kelvin Maps Alarms
On this page you will learn to use all the features about Alarms in Kelvin Maps. We will pay particular attention to the Kelvin Alarms Page.
Kelvin Alarms
There are two types of Kelvin Alarms;
- Failure Detection Alarms - These are alarms that are generated by the Kelvin Failure Detection AI monitor. These are developed by Kelvin Development Team.
- Client Generated Alarms - These are alarms that can be generated by client's own programs or from their Kelvin Apps and are triggered through the Kelvin REST API.
Kelvin Failure Detection Alarms
Kelvin Failure Detection are machine learning models create by the Kelvin data scientists to monitor the data recorded from Kelvin Assets.
You can setup the Failure Detection options when creating or editing a Kelvin Asset. You can read more on how to do this here.
Client Generated Alarms
You can create your own Kelvin Alarms through the Kelvin REST API. You can read more on how to do this here.
At the moment you can not create any alarms through the Kelvin Manager UI, except through setting up the Kelvin Failure Detection alarms in Assets.
To test the REST API command through a Linux command terminal, you can use this code below (make sure curl is installed).
curl --request POST 'https://<url>/api/v4/alarms/create' --header "Content-Type: applic
Alarm Severity
Kelvin Alarms have 5 levels of alarms classified as severity from low to critical.
The alarm symbols follow the ISA international standards.
| Icon | Severity | Description |
|---|---|---|
| Low | Normally this is informational for maintenance or check on inspection round. | |
| Medium | ||
| Advisory | ||
| Urgent | ||
| Critical | Normally this is a safety failure that requires immediate action to avoid |
The number of the right hand side indicate the number of active alarms at that severity.
Viewing Alarms
The alarms are display as summaries in each Kelvin Maps page. There are three main screens which will give you varying degrees of alarm information. The most detailed page is the Alarms page which lists all alarms in detail.
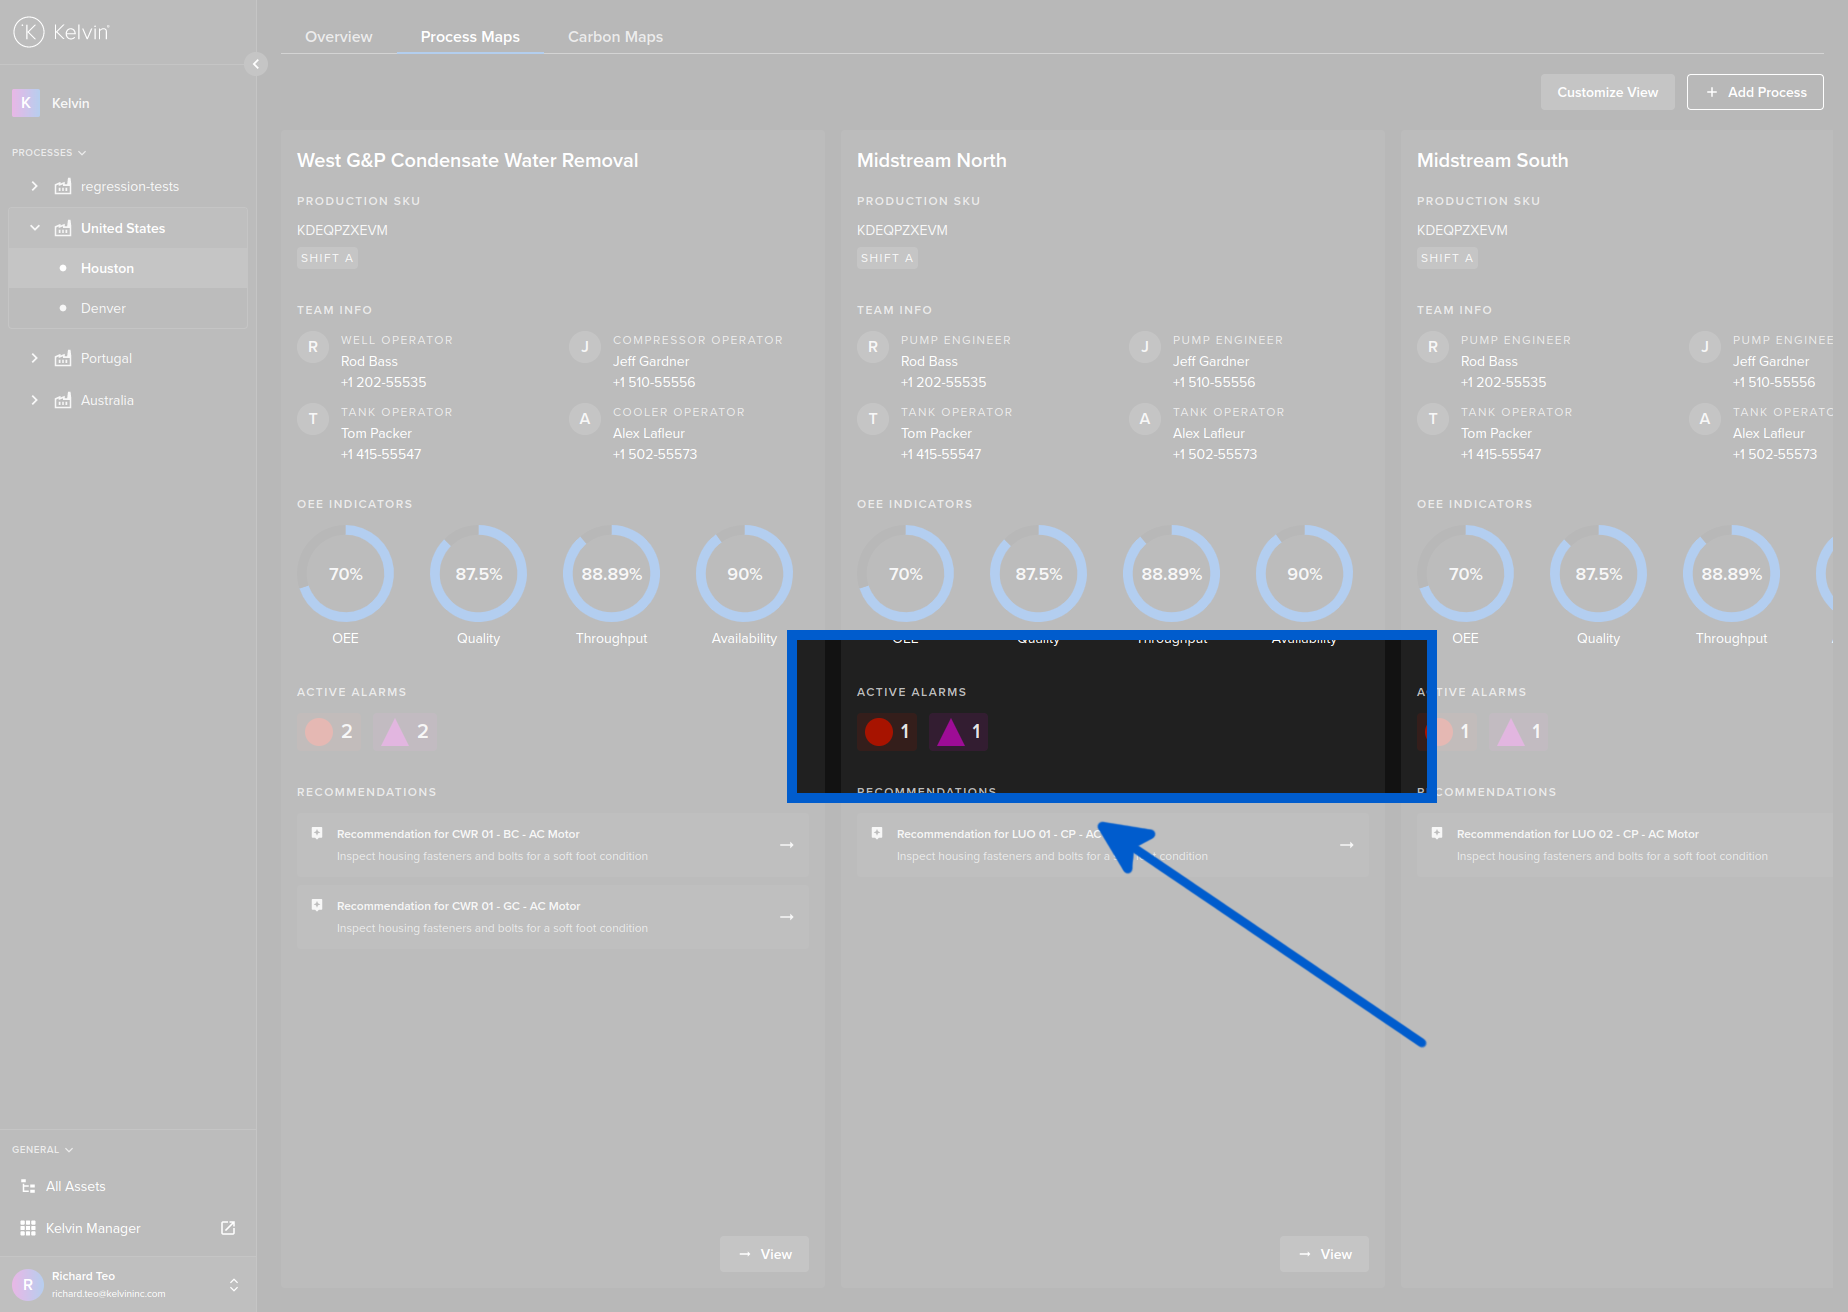
Maps Overview Page
This summary only shows all alarms per area (in this example is per production line) the severity of alarm (low to critical) and the count of alarms currently active in each severity.
Details View Alarm
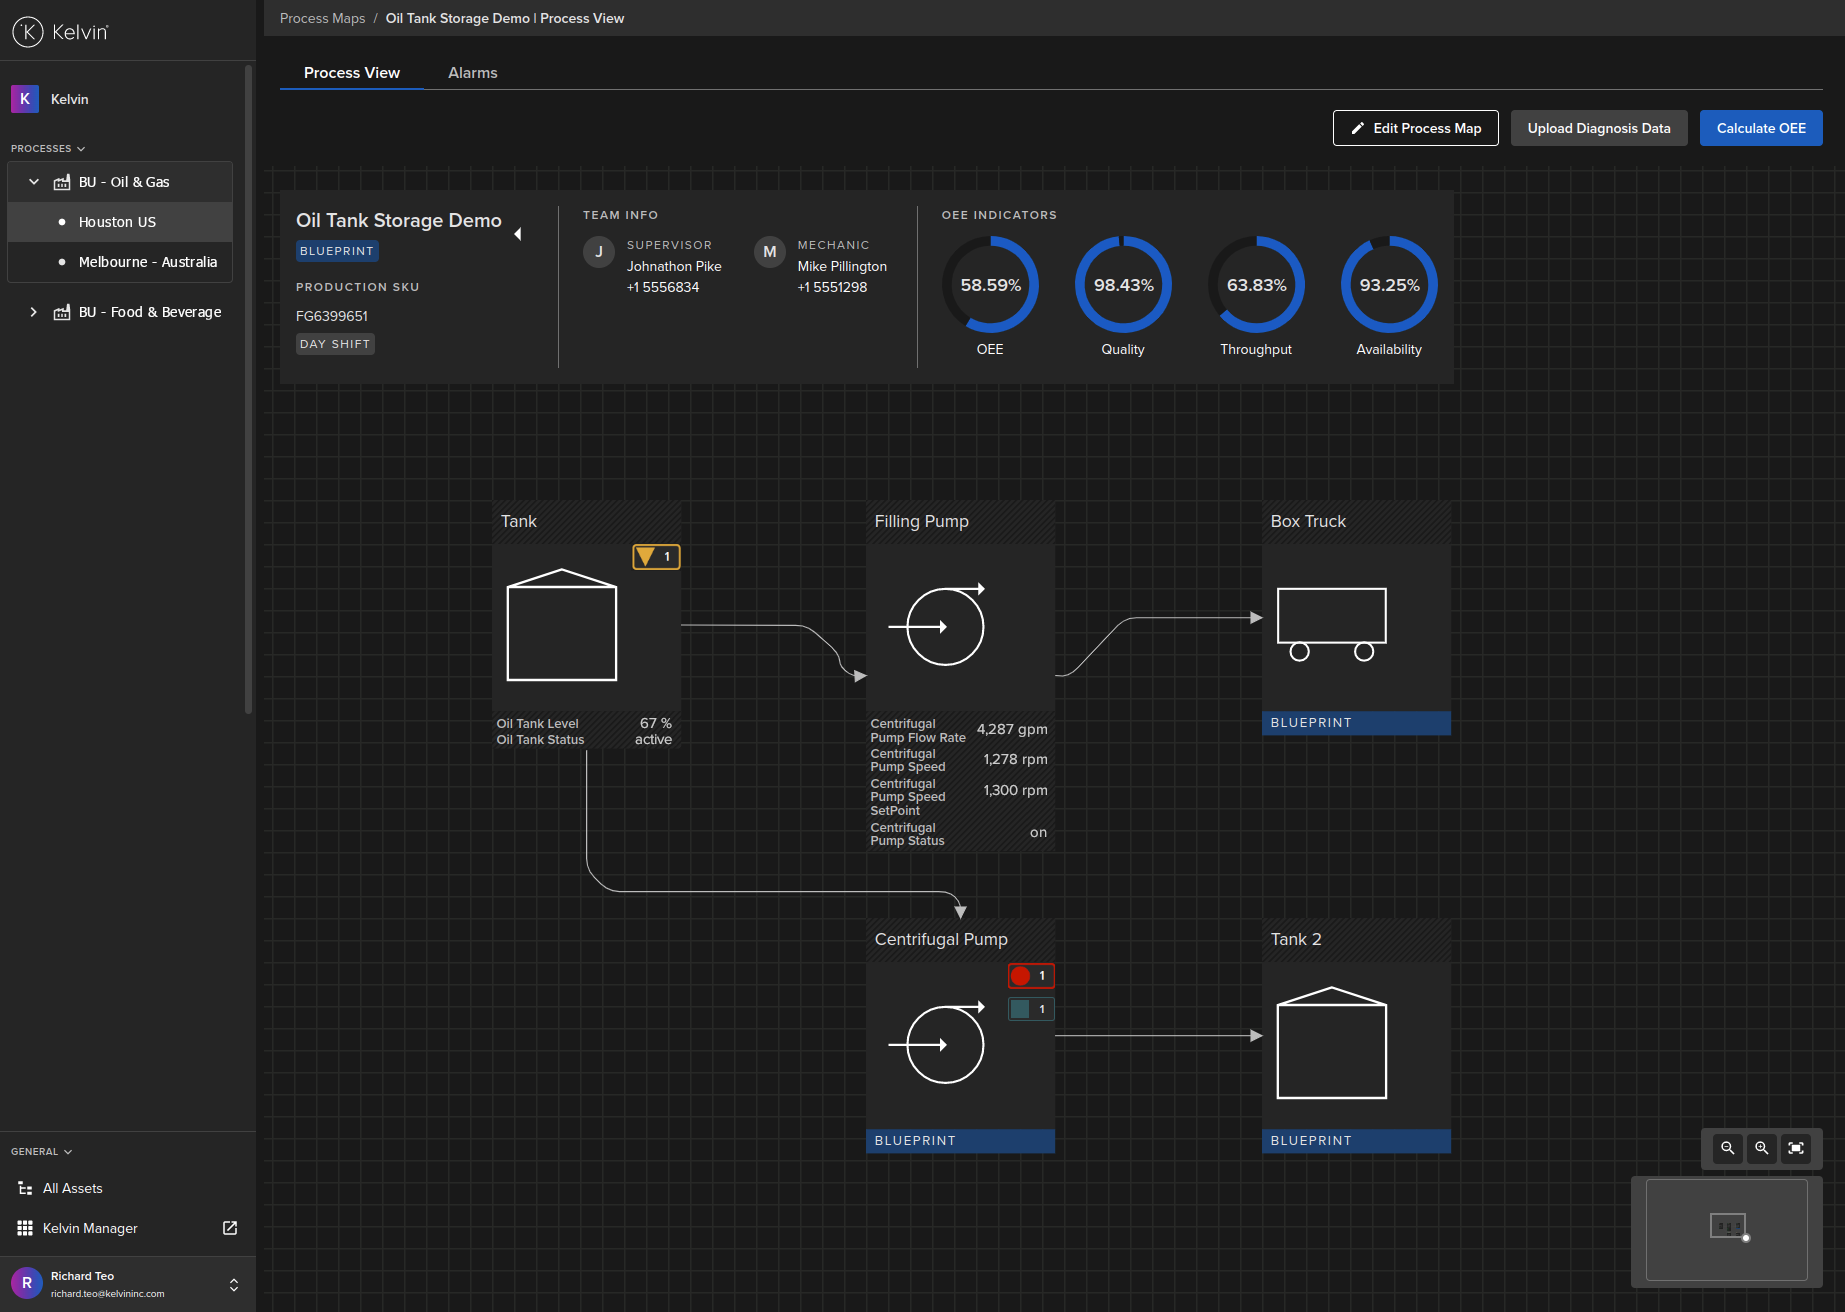
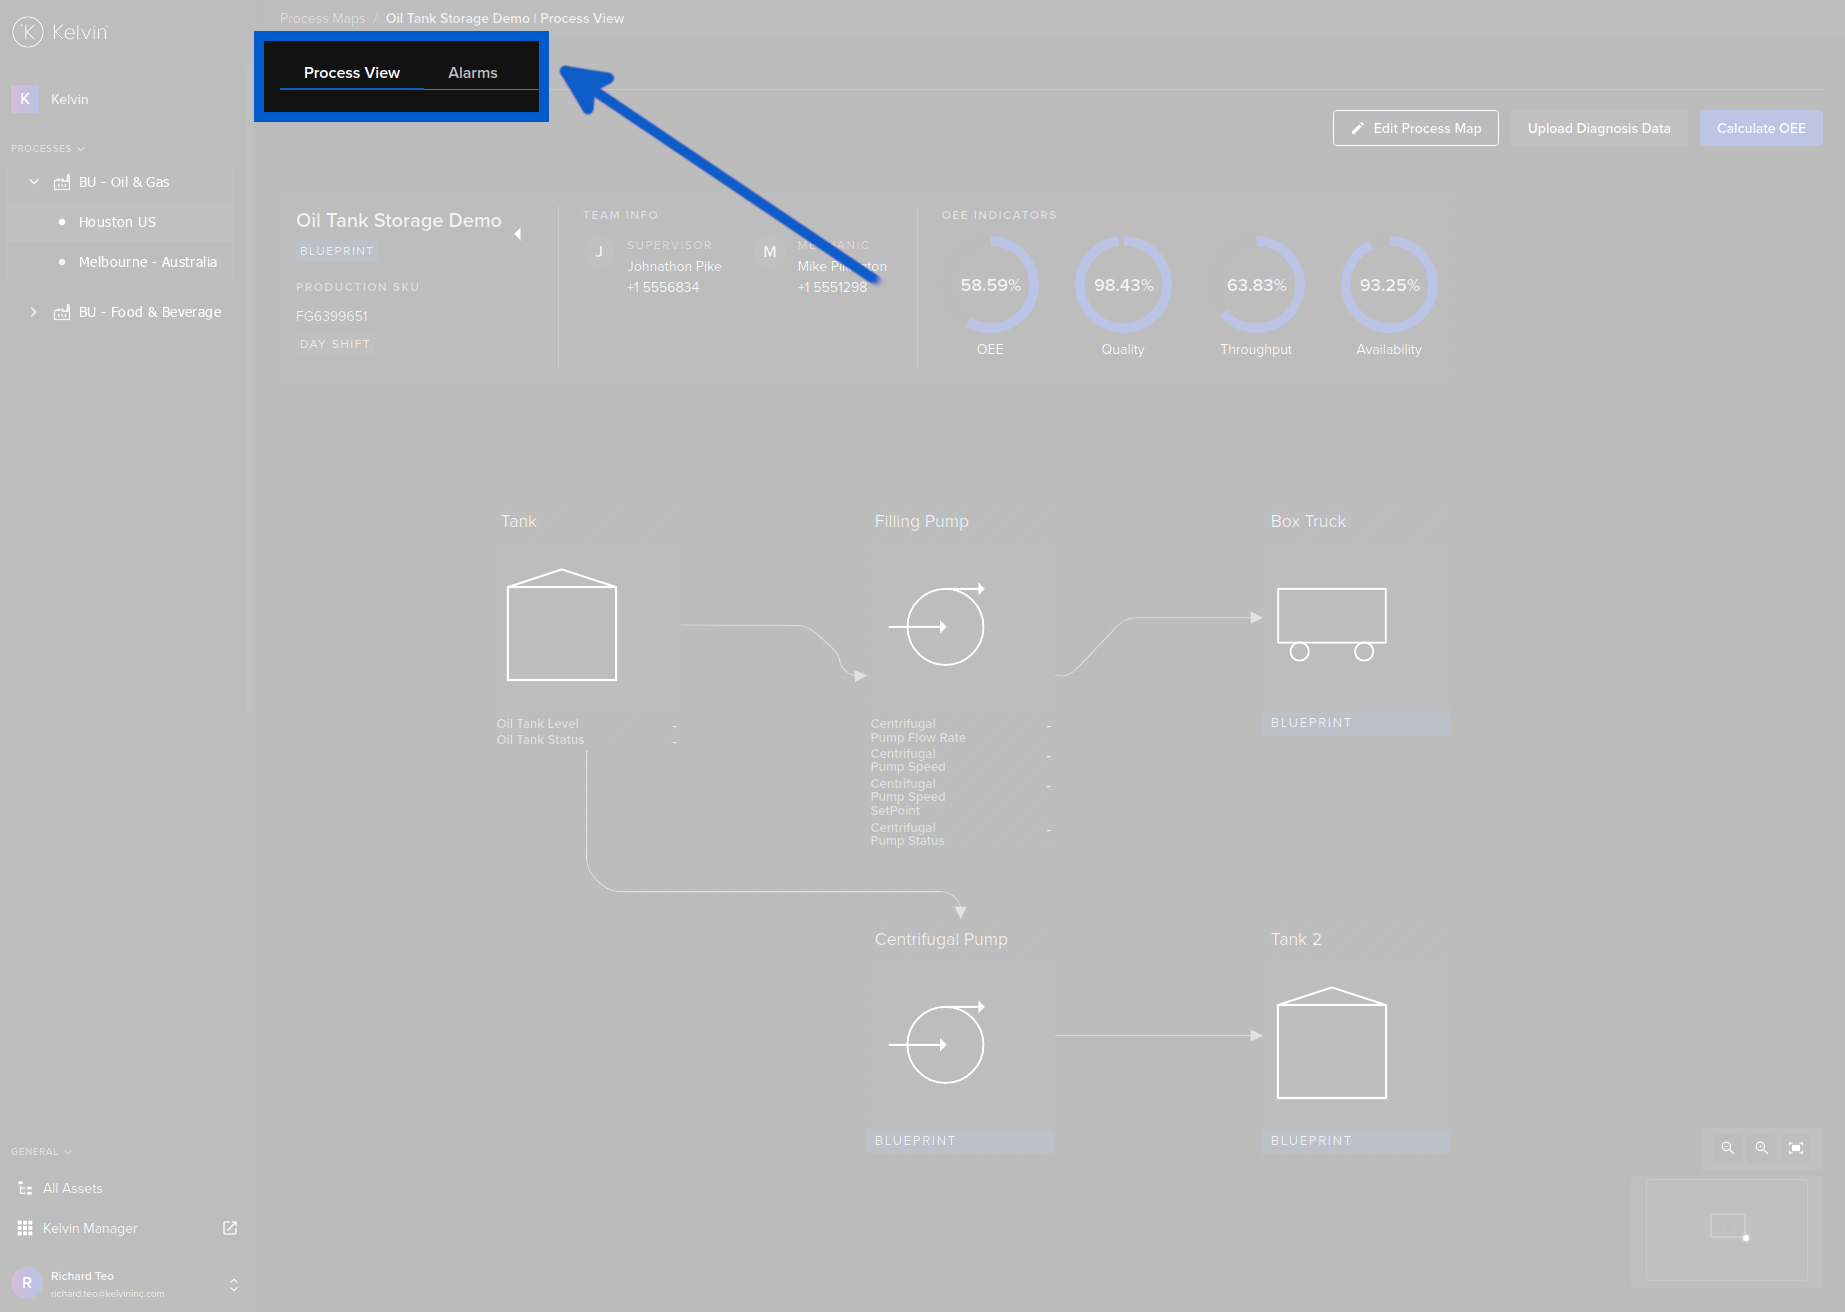
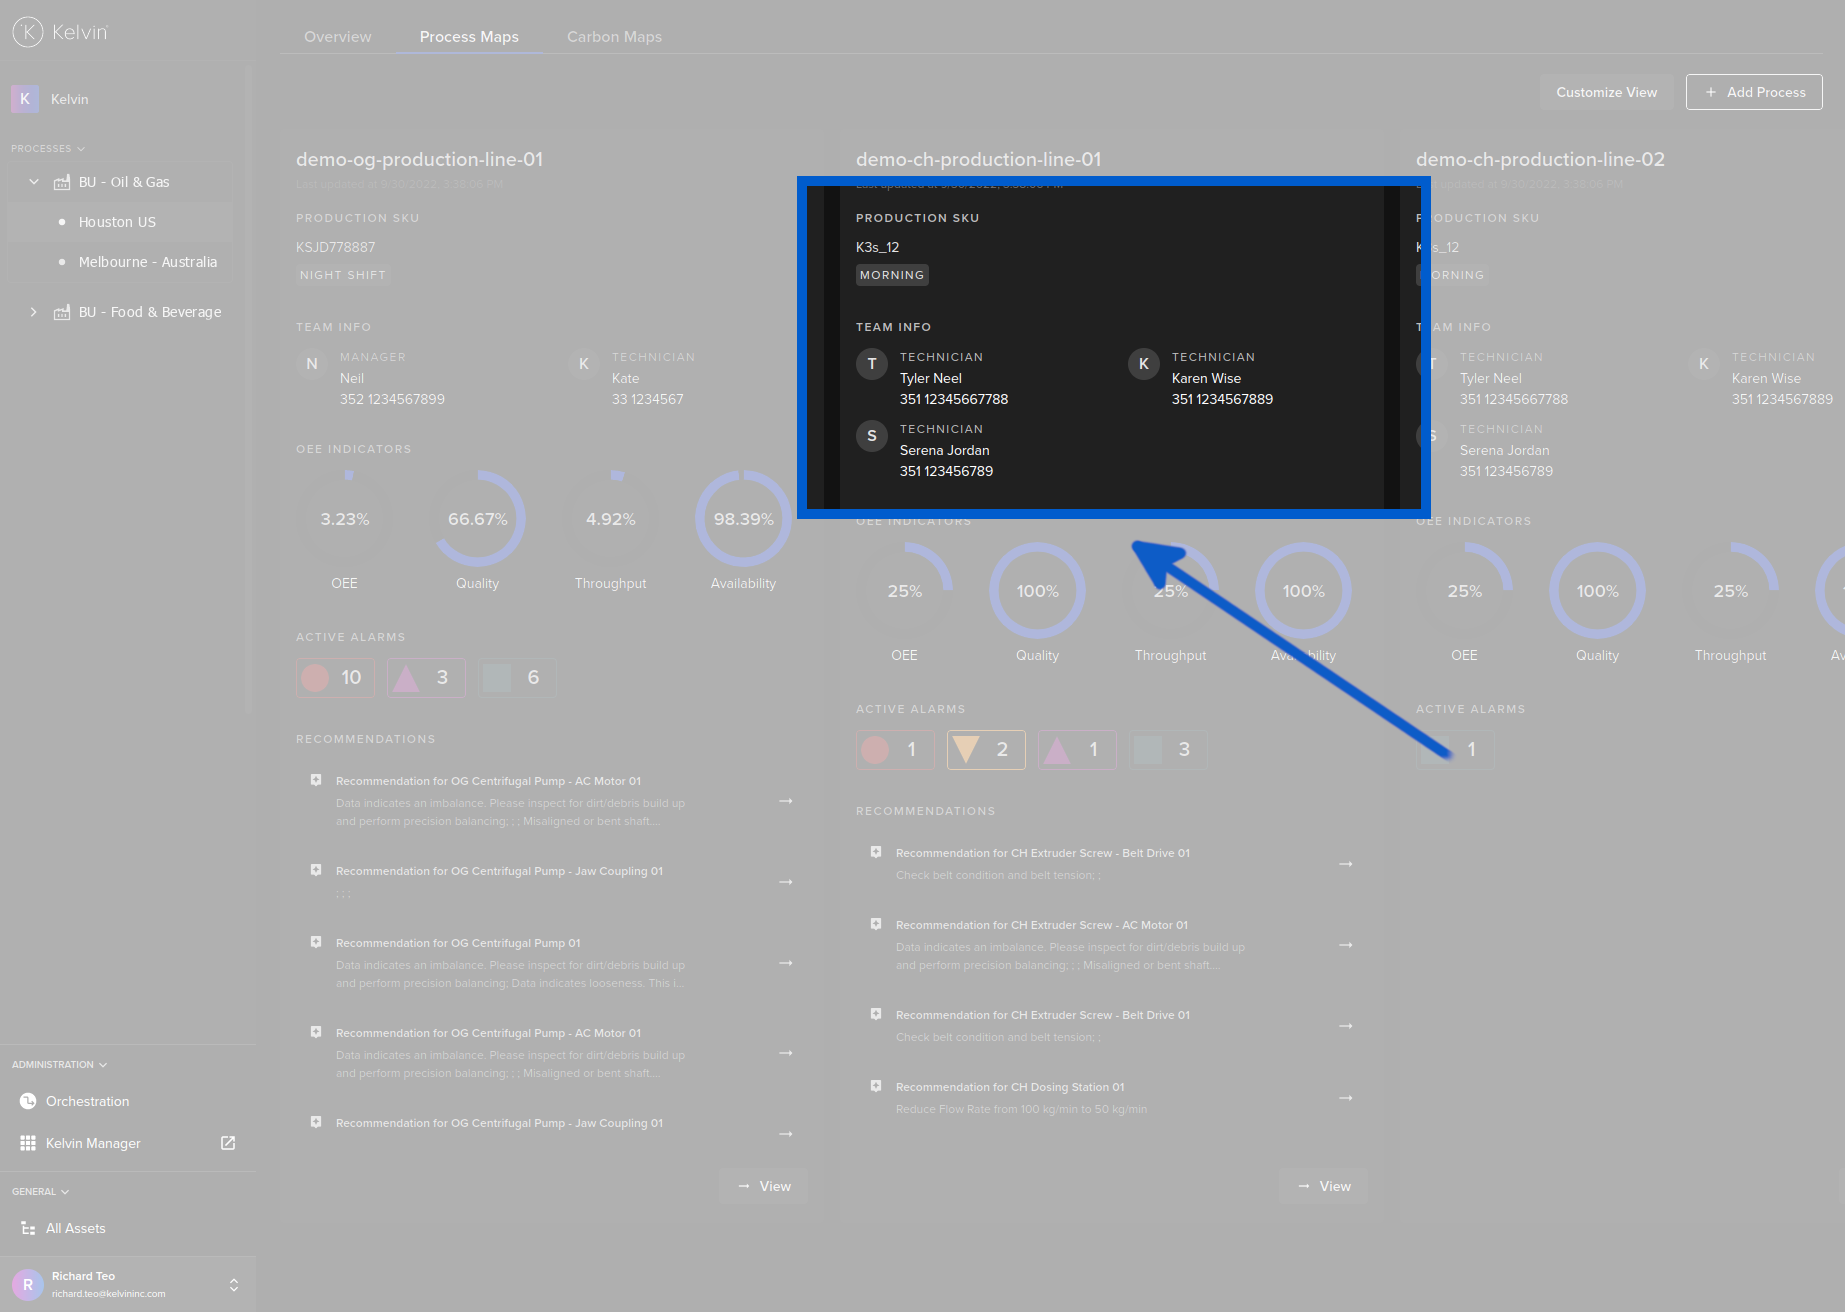
While the Dashboard gives you a good overview, to get a detailed analysis of one process you can click on the -> View button located at the bottom of each process to go to the Process View.
In here you will get more granular breakdown of where the alarms are occurring. Depending on how you have setup your process view, you will see a summary of your alarms per component.
In this example you can see that you have multiple alarms at two components and no alarms at the others.
Asset Details Alarm Sidebar
When you click on one of the Kelvin Assets shown in the Kelvin Maps Process View, a list of all Kelvin Alarms for the Kelvin Assets will be shown on the right hand side bar.
If you see an ![]() icon in the Kelvin Alarm description, this means the alarm is related to the inefficiency calculations in the Carbon Maps section and the Kelvin Asset is marked as inefficient.
icon in the Kelvin Alarm description, this means the alarm is related to the inefficiency calculations in the Carbon Maps section and the Kelvin Asset is marked as inefficient.
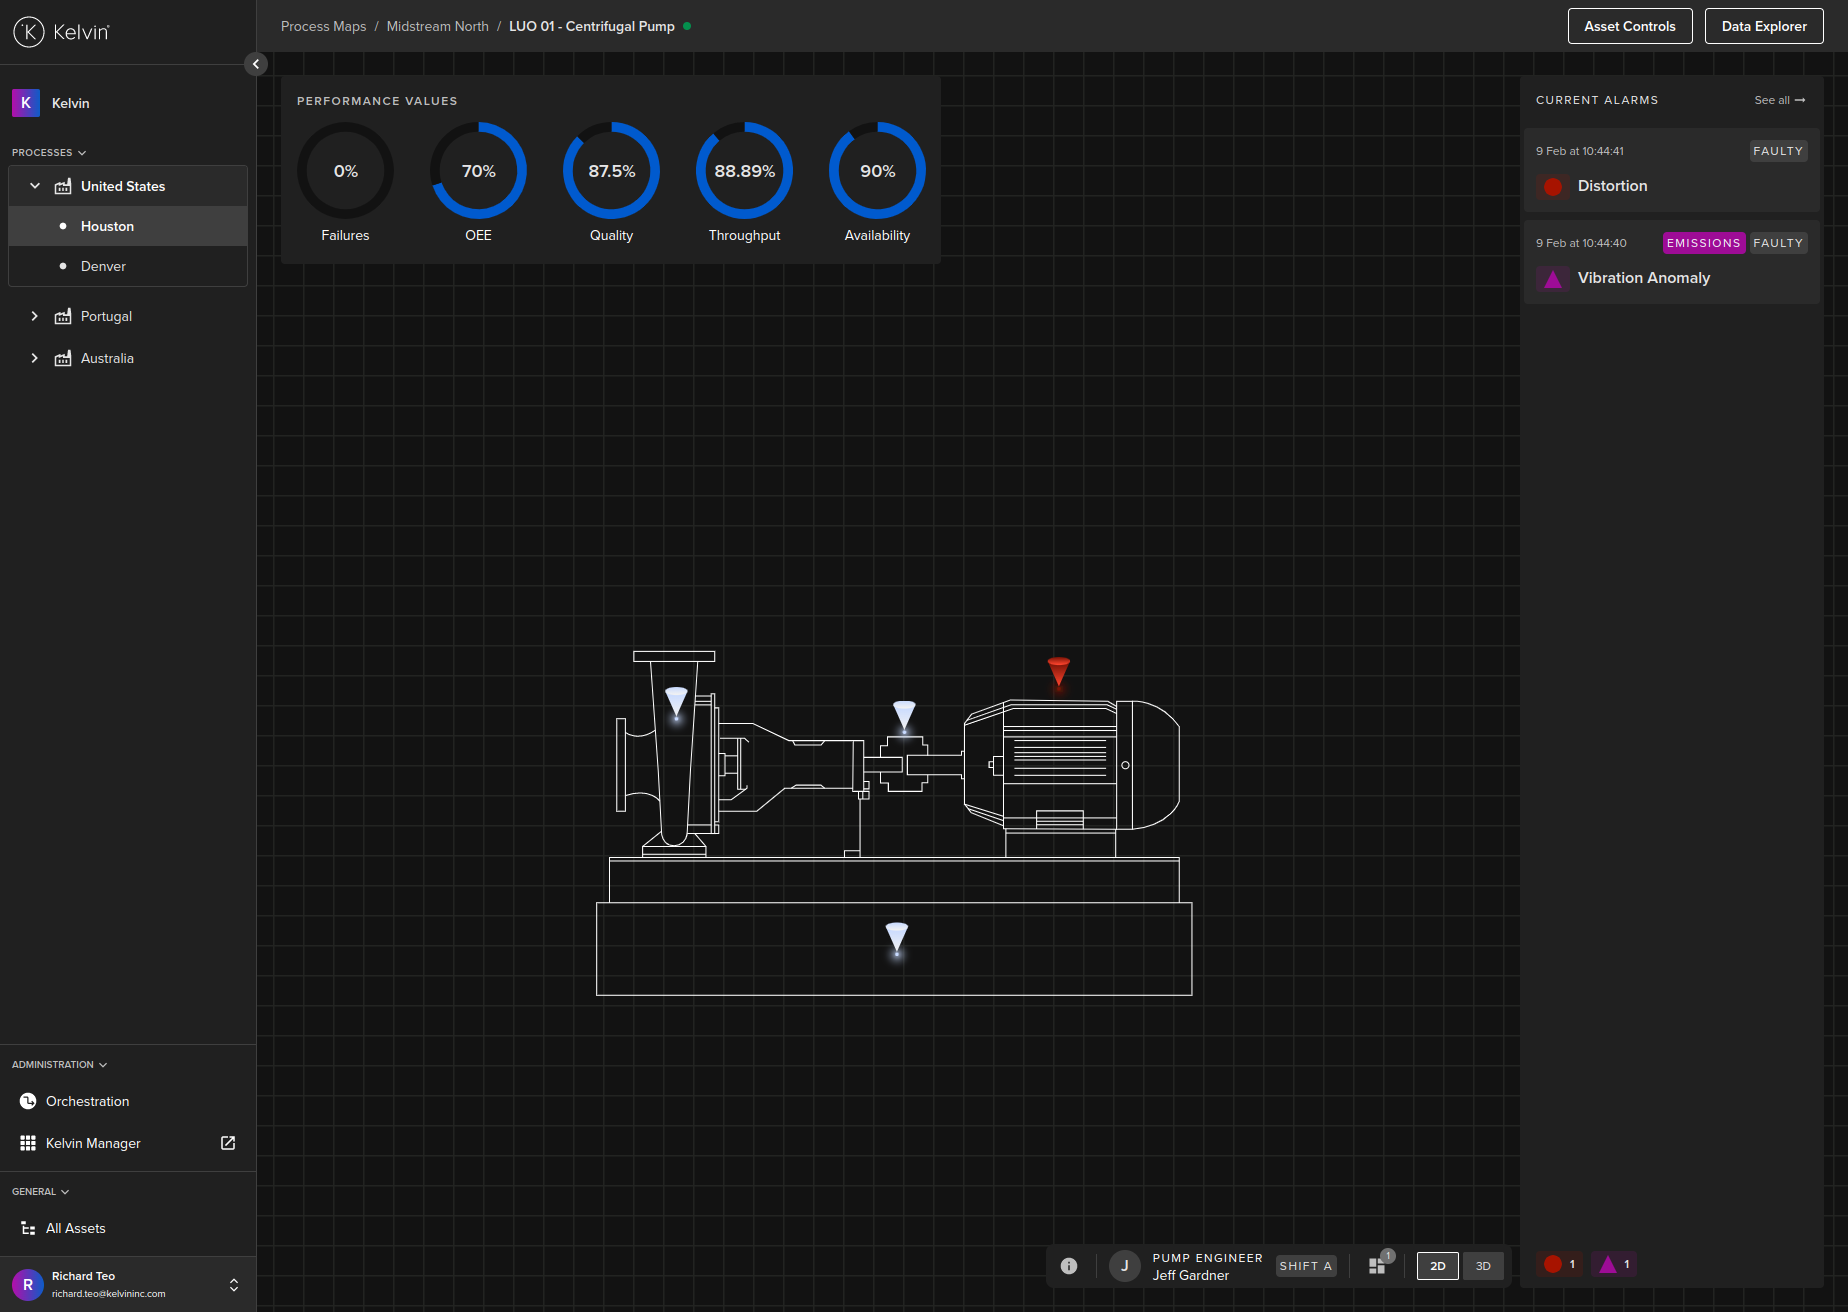
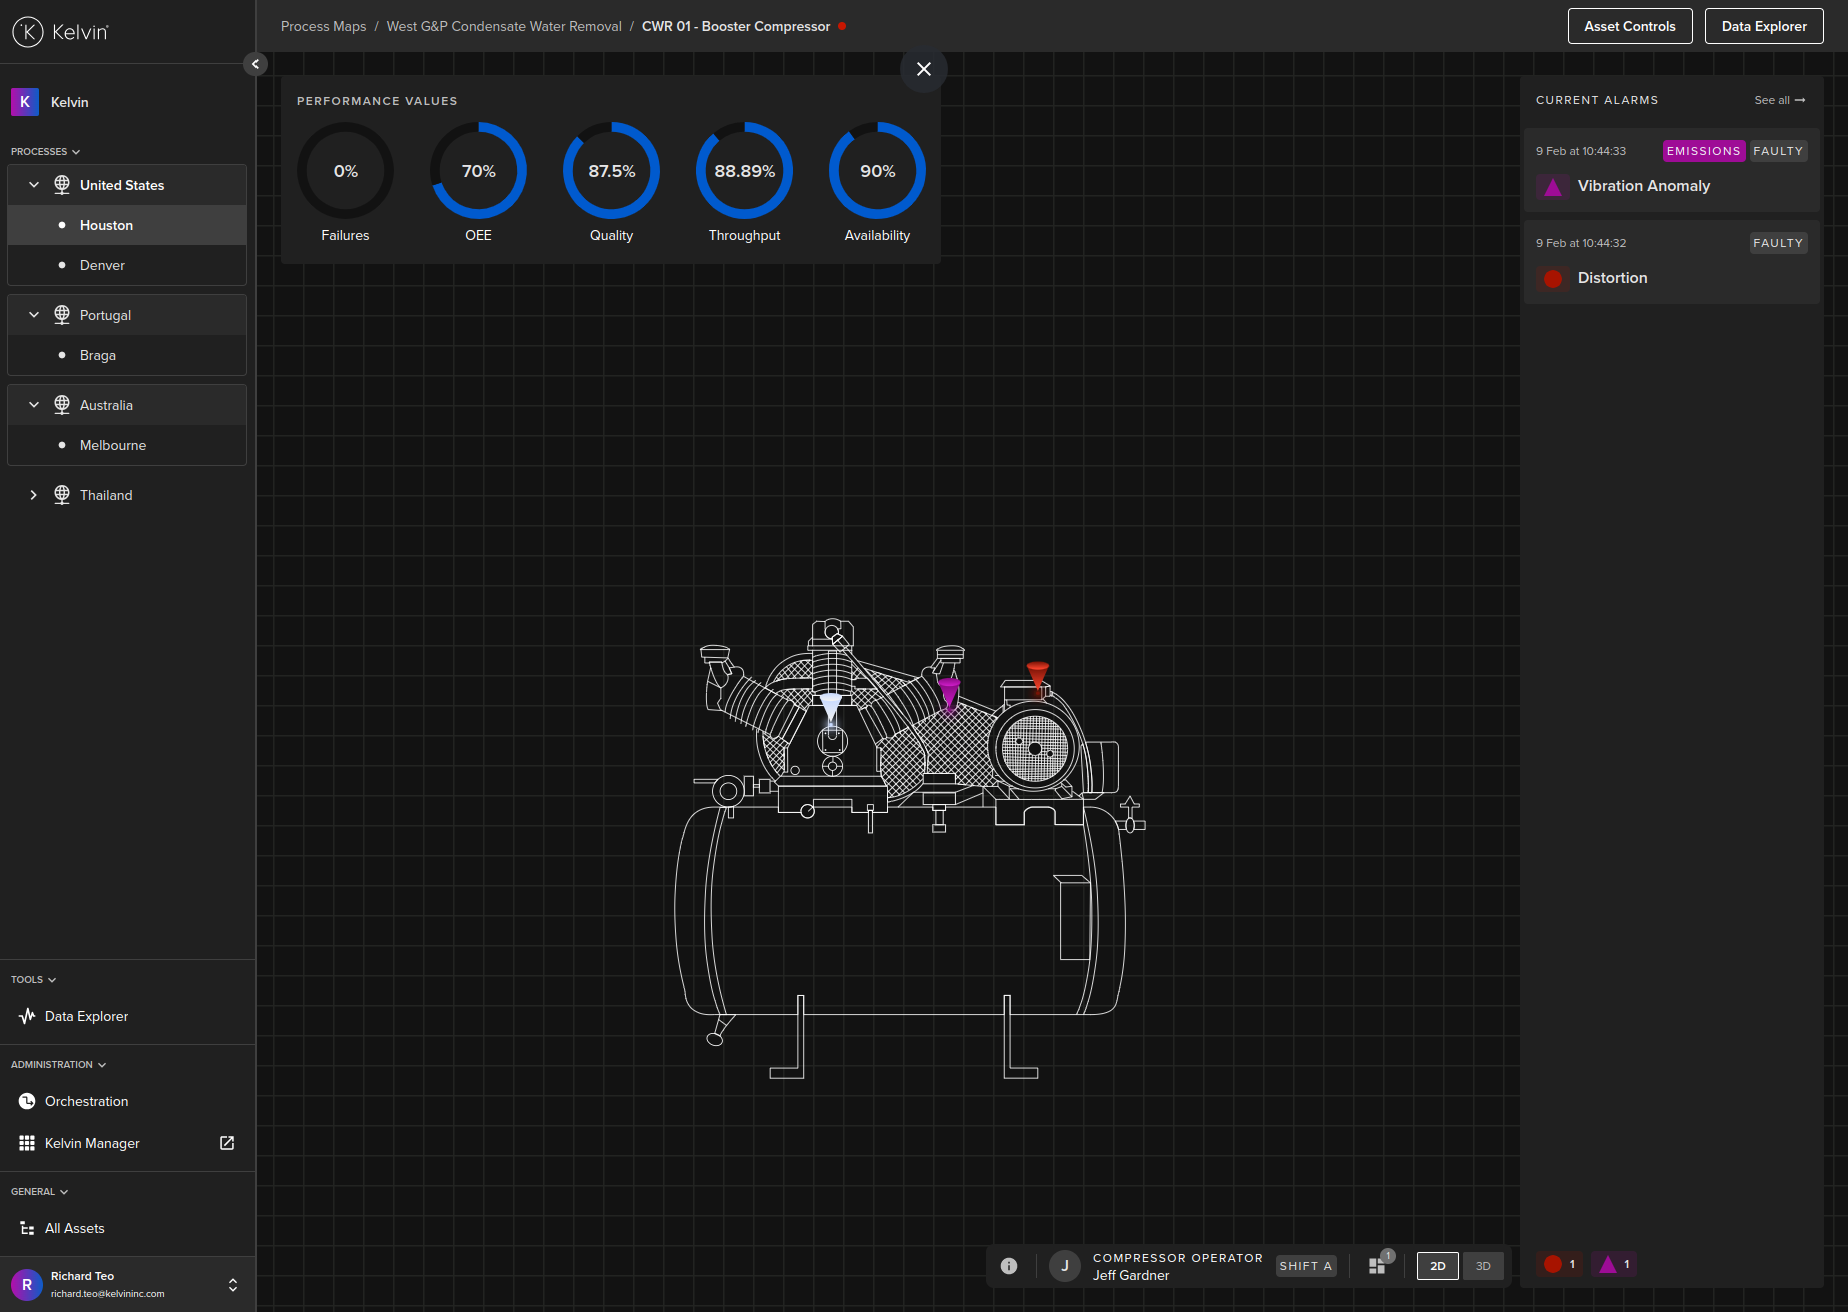
The color of the pins on the asset model represent the severity of the Kelvin Alarm. If it is white, then it means that there is no alarm at this monitoring Kelvin Component.
To identify which alarm in the left hand side bar is represented on the 2D or 3D model, simply click on the alarm and the corresponding pin will start bouncing.
Alarms List View
To see the details of the alarms in the Kelvin Maps Process Maps, click on the Alarms tab at the top;
You will then see a full list of all the alarms in this process view.
This uses the new Asset-centric table which give much more flexibility to the users in customizing the dashboard to their requirements. Learn more about this feature at Getting Started Guides -> GSG Common Features -> GSG Asset-centric Tables.
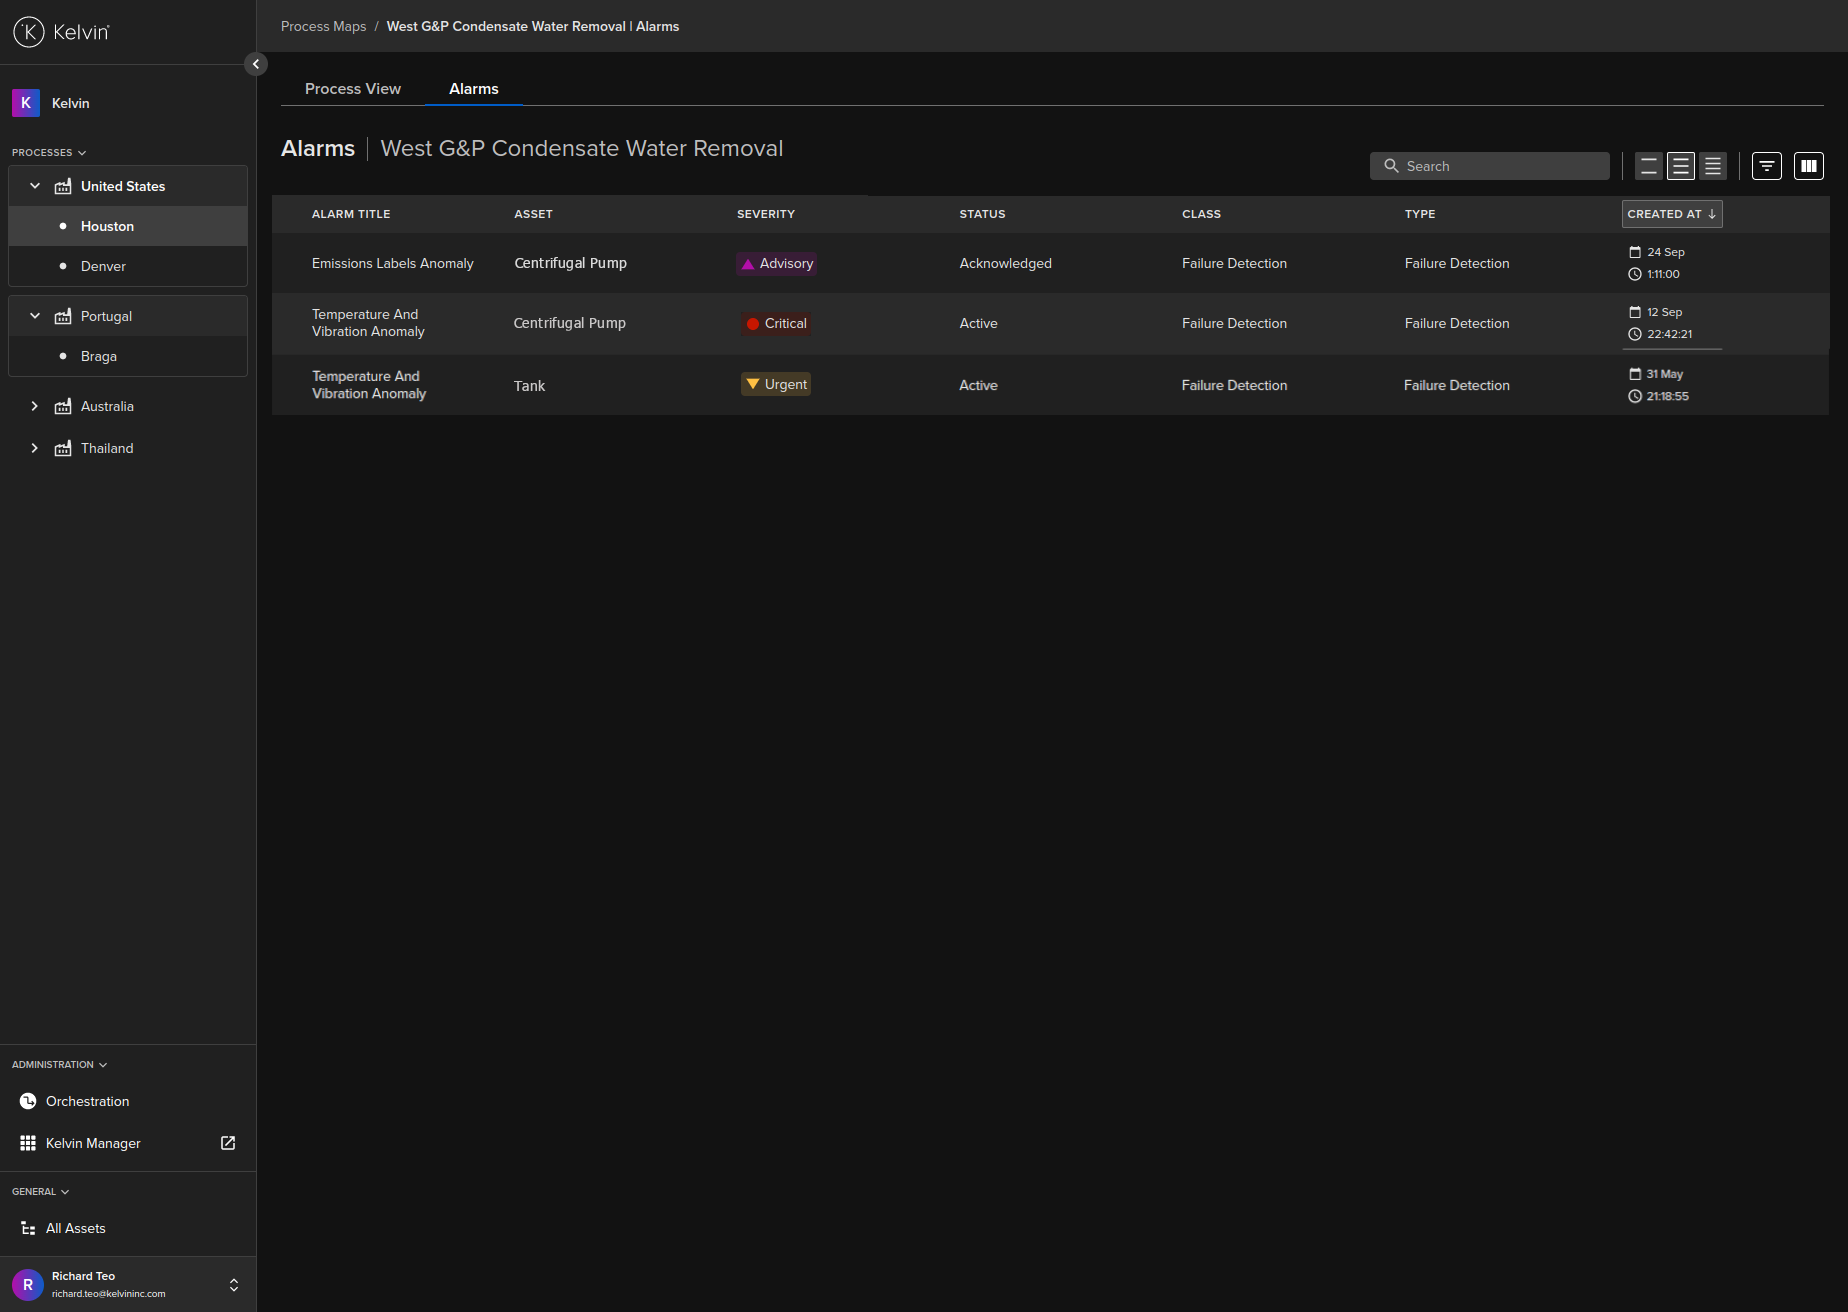
You have all the alarm details in rows of all equipment within the one process view.
| Header | Source | Description |
|---|---|---|
| Alarm Title | Defined in Kelvin Alarms | This is the alarm title |
| Asset | Created in Kelvin Assets | This is the Kelvin Asset where the alarm has been detected |
| Severity | Defined in Kelvin Alarms | This is defined when making a Kelvin Alarm on the severity of this Alarm from P1 to P5. |
| Status | From Kelvin Alarms | This is the current status whether Active, Acknowledged or Resolved. |
| Class | Defined in Kelvin Alarms | This is the Kelvin Alarm Class defined when the alarm is first defined |
| Type | Defined in Kelvin Alarms | This is the Kelvin Alarm Type defined when the alarm is first defined |
| Created At | From Kelvin Metrics | This is when the alarm is first activated |
Alarm List Overview
The alarm list overview has a number of useful features for moving around Kelvin Maps quickly and to quickly isolate the alarms most interesting to you.
Searching Alarms
At the top right corner you can quickly and dynamically search the Alarm Title and Asset columns.
Like all searches in the Kelvin Collaborative Control Platform, the search is dynamic and will start searching while you are typing. The search will look for any matches of the word you type. The word does not need to start at the beginning of the Alarm Title or Asset. For example if you type Demo, then the search will find Asset Classes named "Demo 98" and also "Asset Demo".
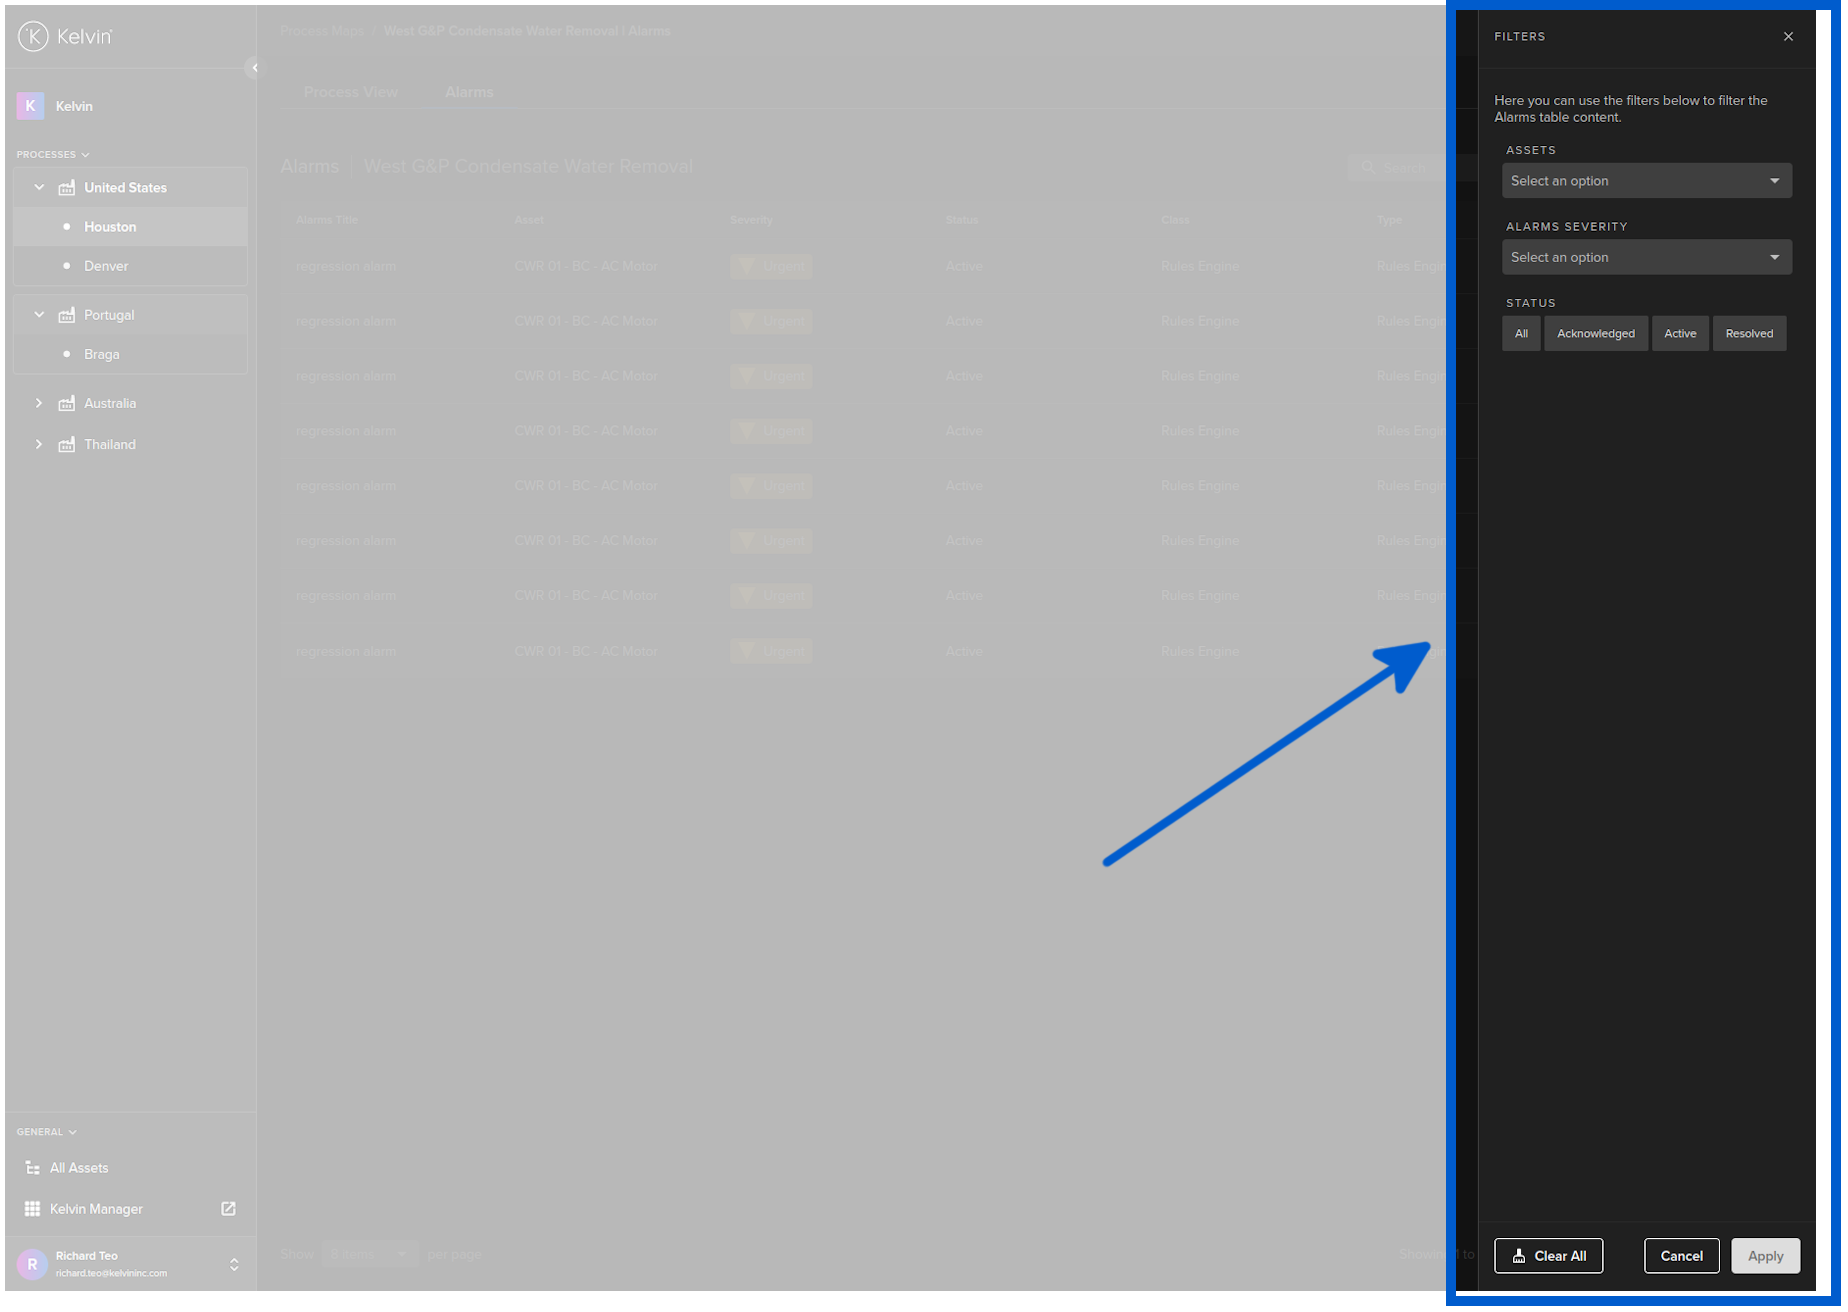
Filtering Alarms
You are able to filter on a combination of three different columns; Assets, Severity and Status.
You can use a combination of filtering and searching to find what you are looking for.
Manage Table Columns
You also have the ability to manage the table columns and to freeze columns on the left and right to keep important information always in view for tables that are wider than the screen.
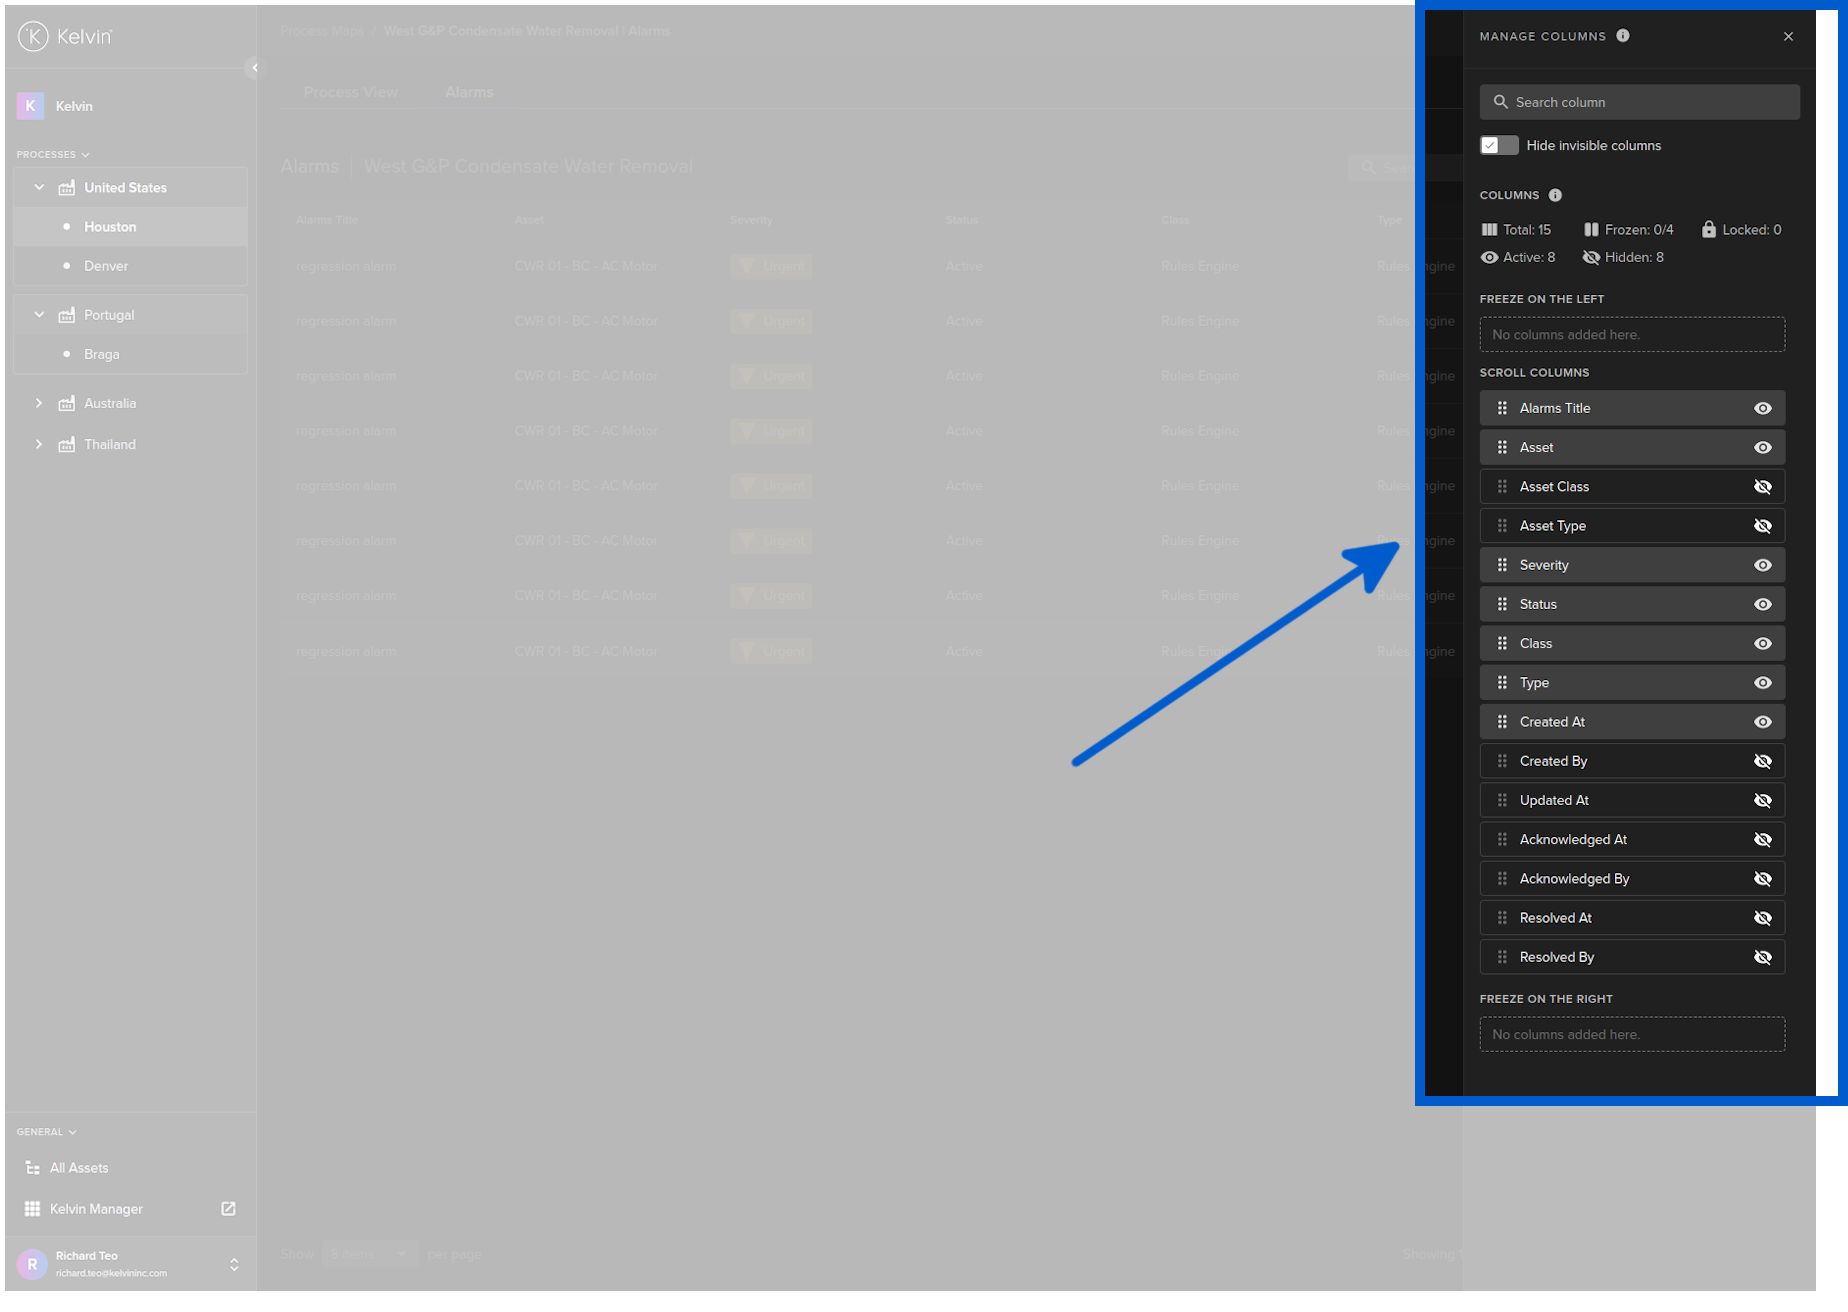
Except for the fixed list of columns available (no custom columns), all the features are explained in detailed in our Getting Started Guide on Asset-centric tables. Read more about it here; Getting Started Guide -> GSG Common Features -> GSG Asset-centric Tables.
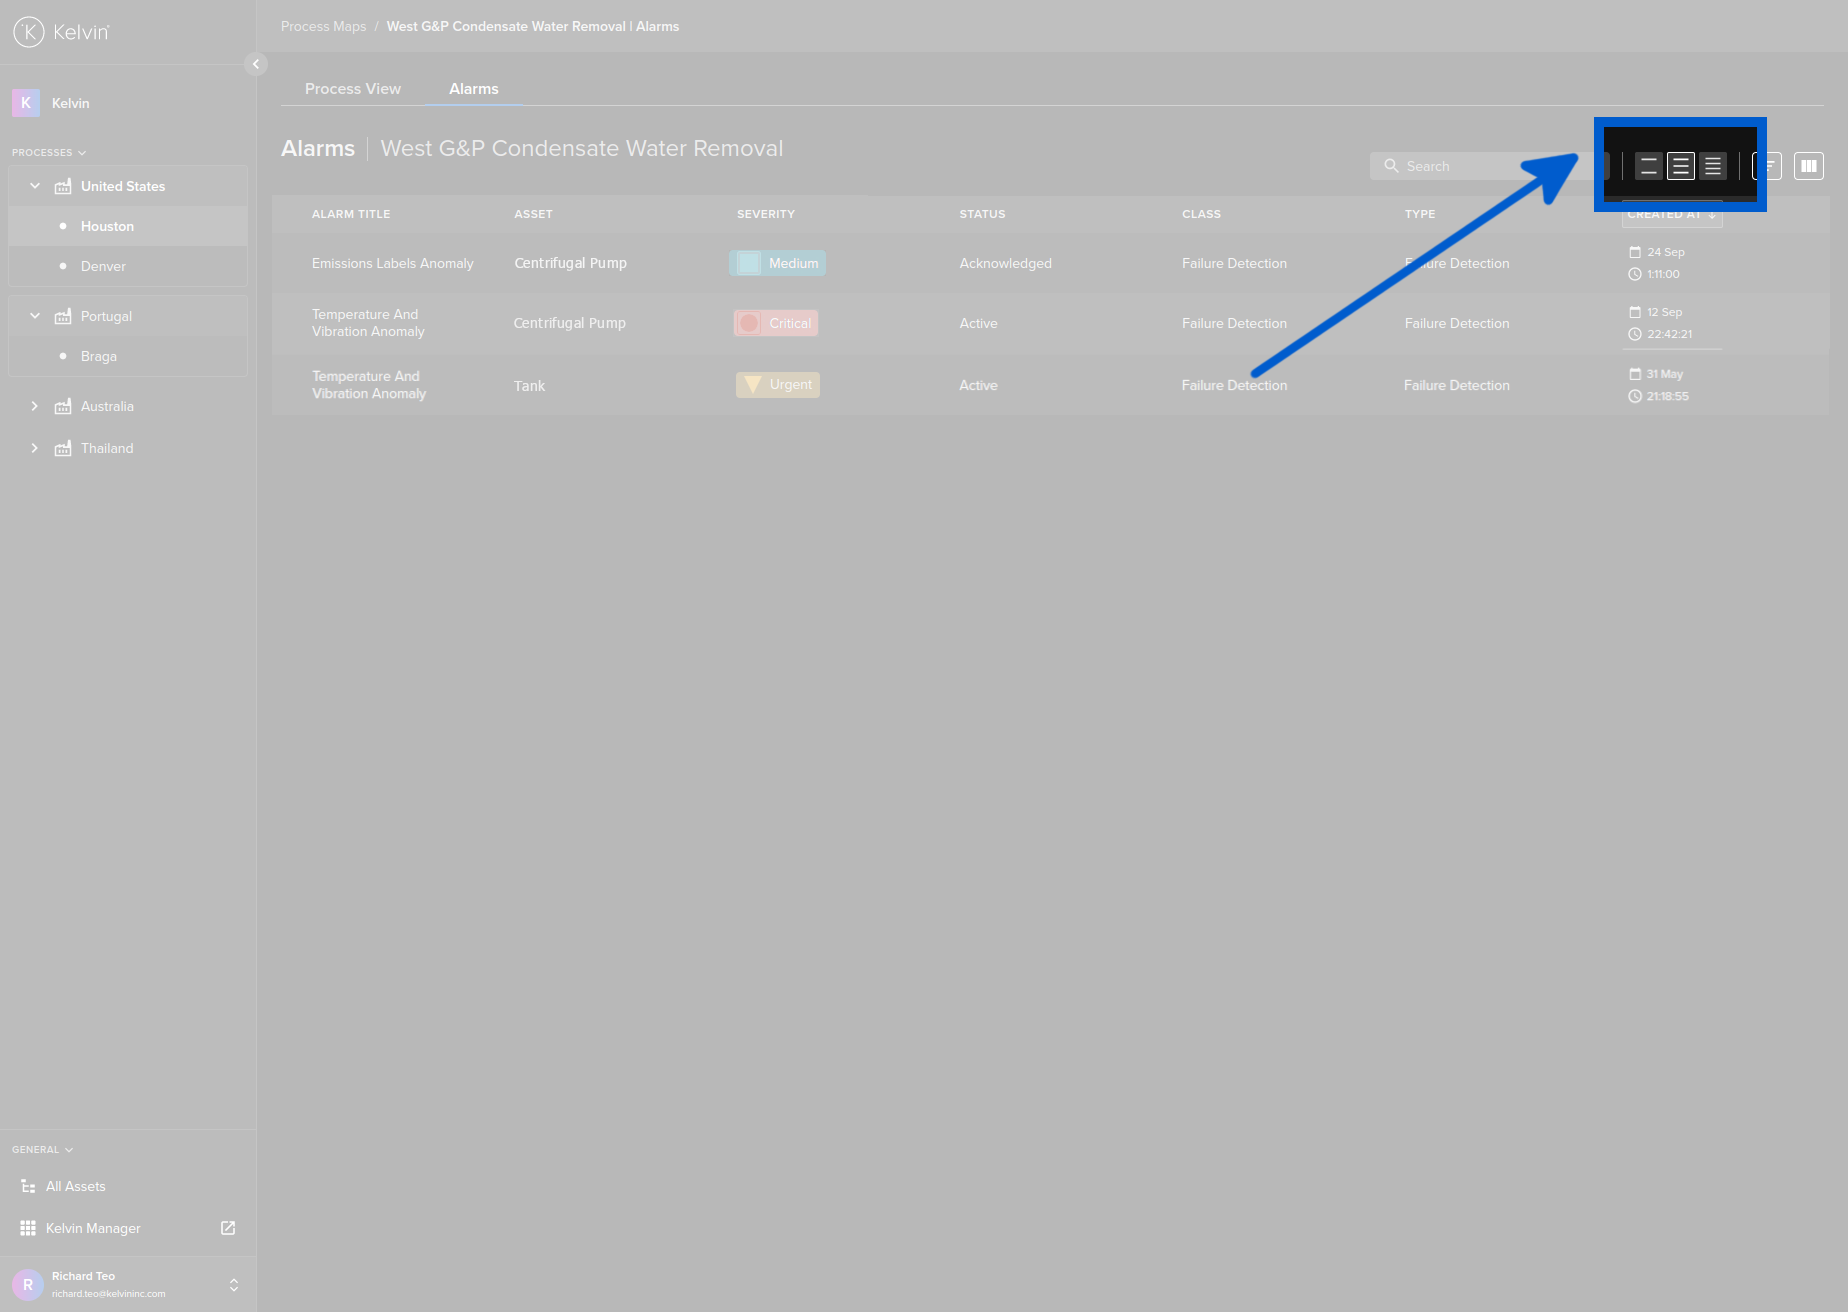
Row Height
You can select the row height to suit you.
Alarm Details
When you click on one of the alarms in the alarm list on the right hand sidebar, a new right hand sidebar will appear with full details on the alarm.
The Alarm Details page has many details and links to help you quickly identify and resolve the alarm.
With Failure Detection Alarm, you will also see at the bottom a graph with details of the analytics. The type of graphs will depend on the sensor that produced the alarm. For example, the vibration sensor uses FFT analytics.

Kelvin Failure Detection AI
If the alarm has been generated by the built-in Kelvin Failure Detection AI, then there are two additional tabs, failures and analysis, which provide greater detail about the detected failures and some analysis data showing the severity of the problem.
The Alarm Details side bar will look like this;

Failures Tab
The failures tab gives detailed information about the possible inferred causes that the Kelvin Failure Detection AI system has calculated from the available sensors.
In the example above the vibration signatures point to a possible loose footing of the extraction machine and it recommends to check the nuts and bolts fastening the machine to the supporting structure.
Analysis Tab
The analysis tab gives you a more detailed view of the data used by the Kelvin Failure Detection AI to model the possible failures.
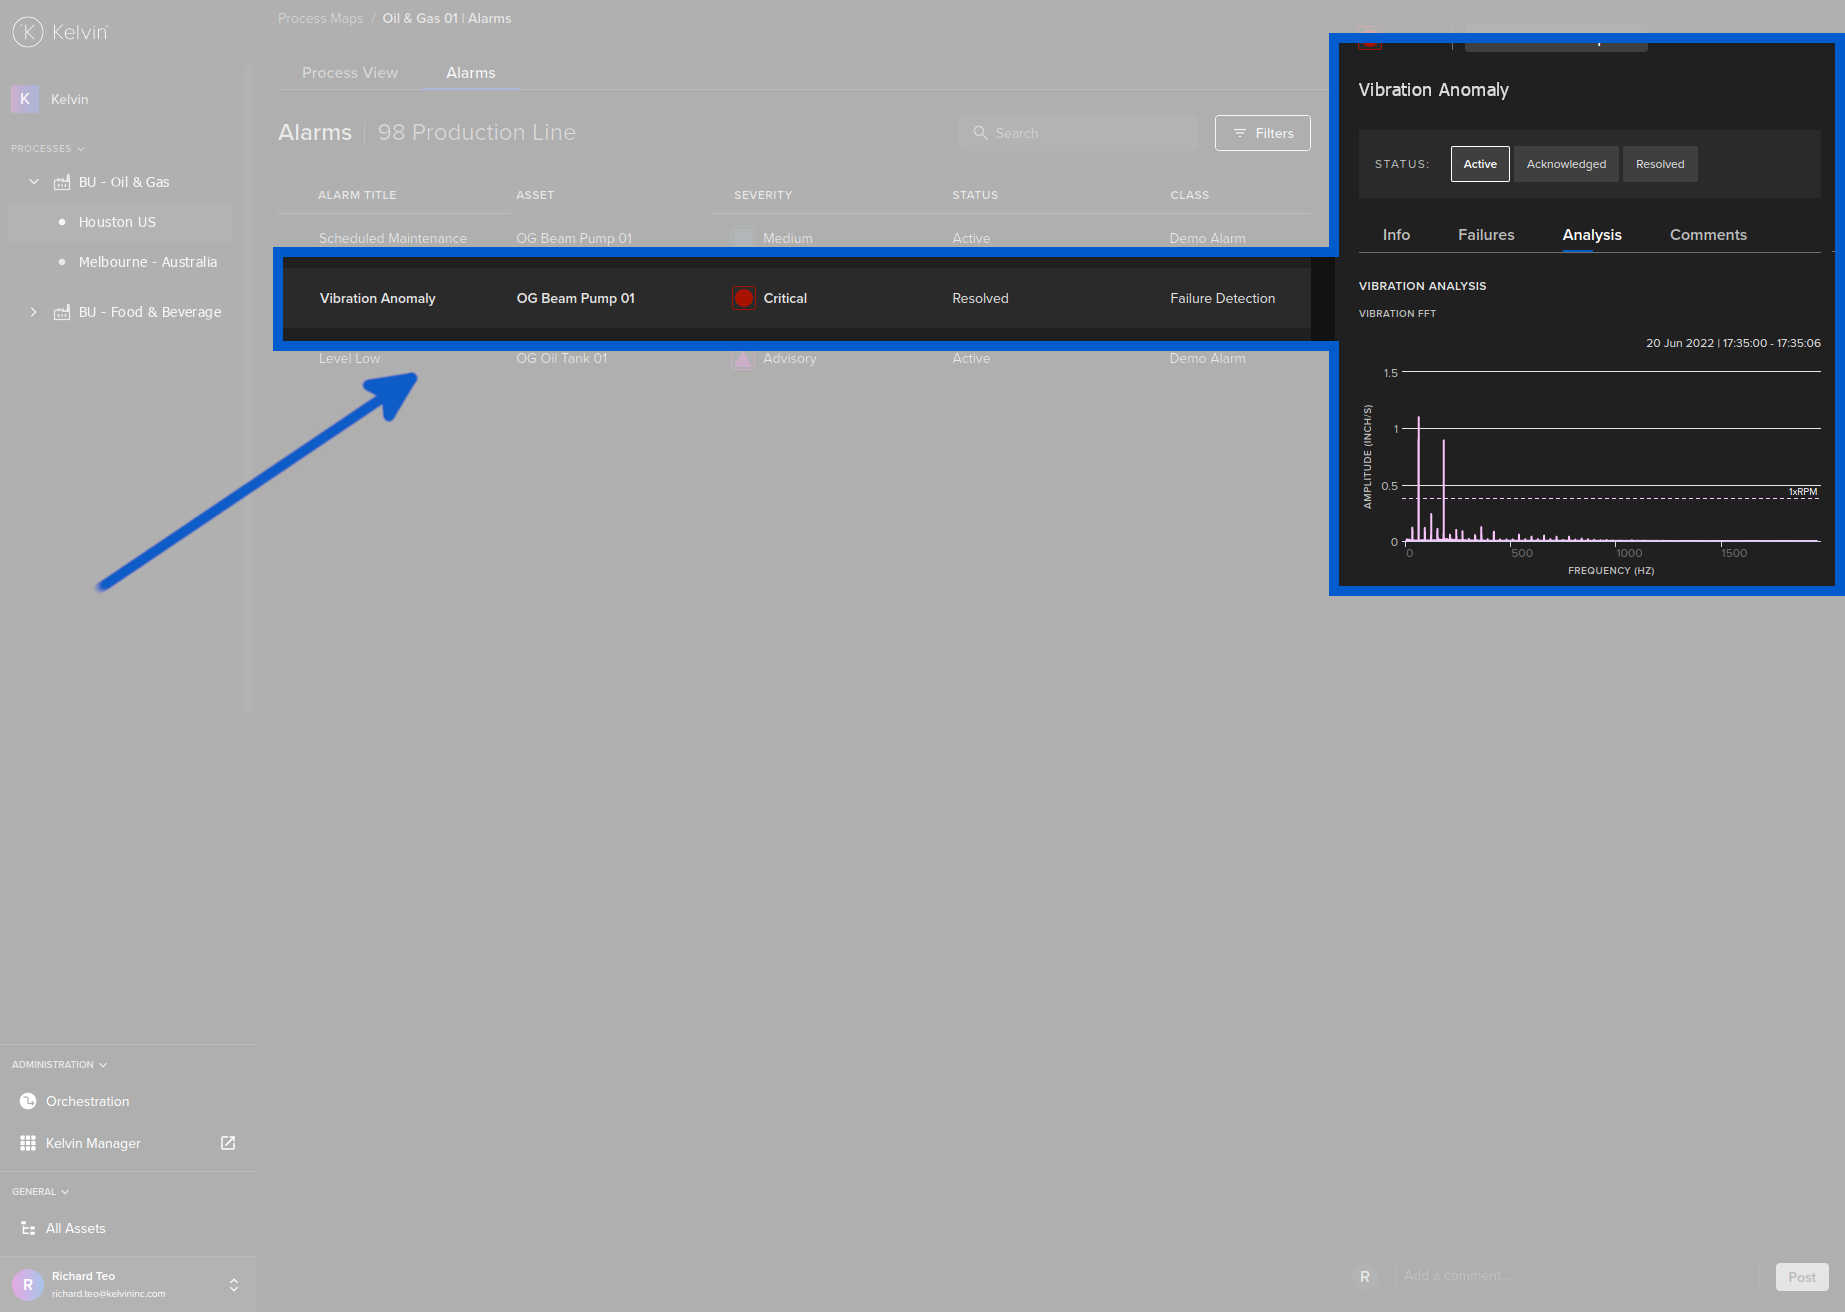
The analysis can help you evaluate the severity of the issue and gain insights into the Kelvin Failure Detection AI decision process.
Assets Links
In the Alarms Details page you can see which Asset, Component, Sensor or Part triggered the Alarm. You can click on the link to go over to the Assets Monitoring Page.
With Failure Detection Alarm, you will only see either the Component or Part where the Kelvin analytics have detected the anomaly.

Actions
Actions allow you to change the status of the Alarm. Listed here are all the options available.
Not all options will be available on the drop down list. It will depend on the current status of the Alarm.
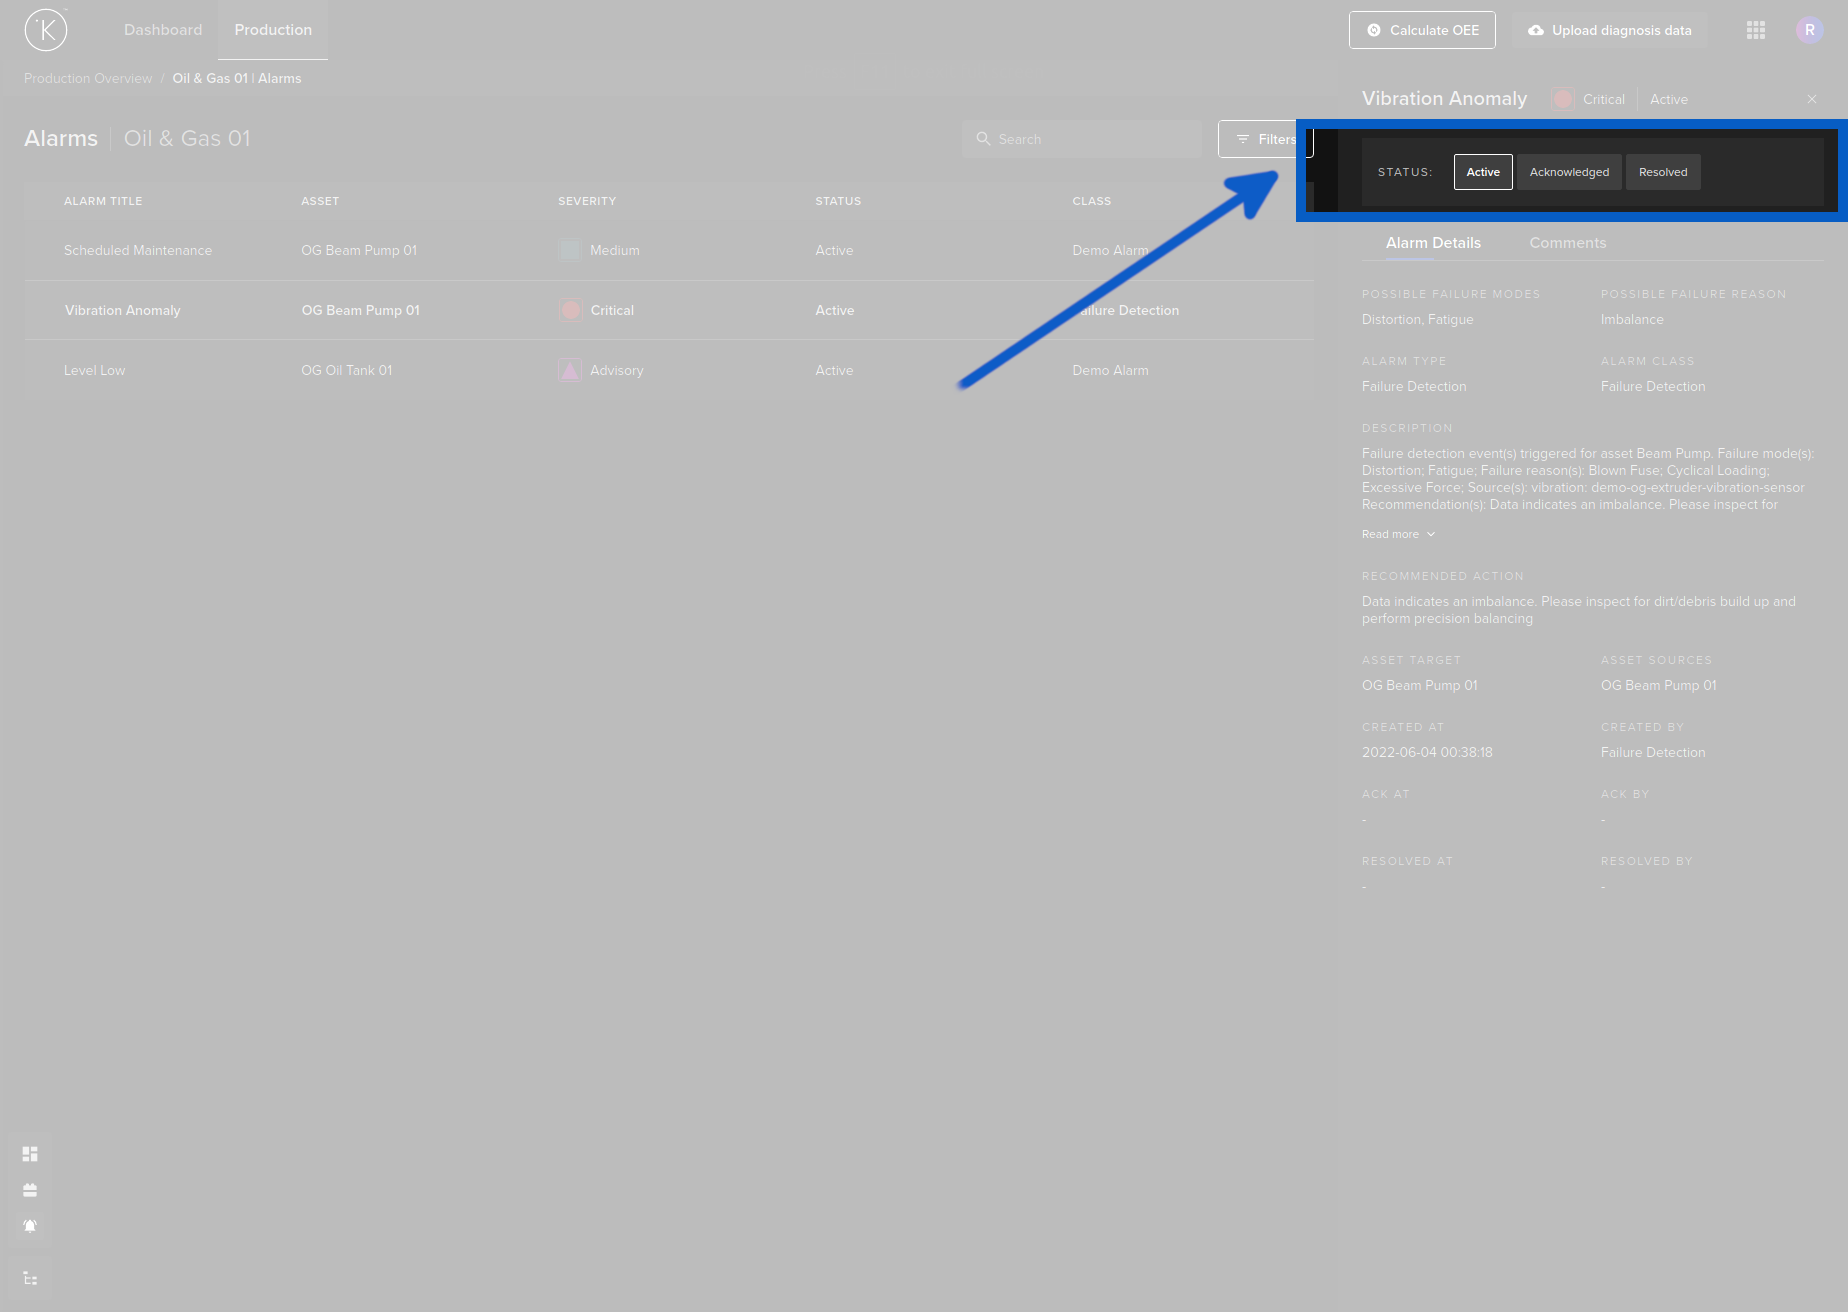
| Action | Description |
|---|---|
| Active | If the Acknowledge or Resolve status needs to be reversed, then you can re-activate the alarm. This will clear the Acknowledged an Resolved information for this alarm. |
| Acknowledge | This will change the alarm from active to acknowledged. |
| Resolve | When the problem has been fixed, you can change the alarm from Acknowledged to Resolved. |
With Failure Detection Alarms, when you click on Resolve this alarm, you will also be taken to a questionnaire feedback form. More information can be found further down under Failure Detection heading.
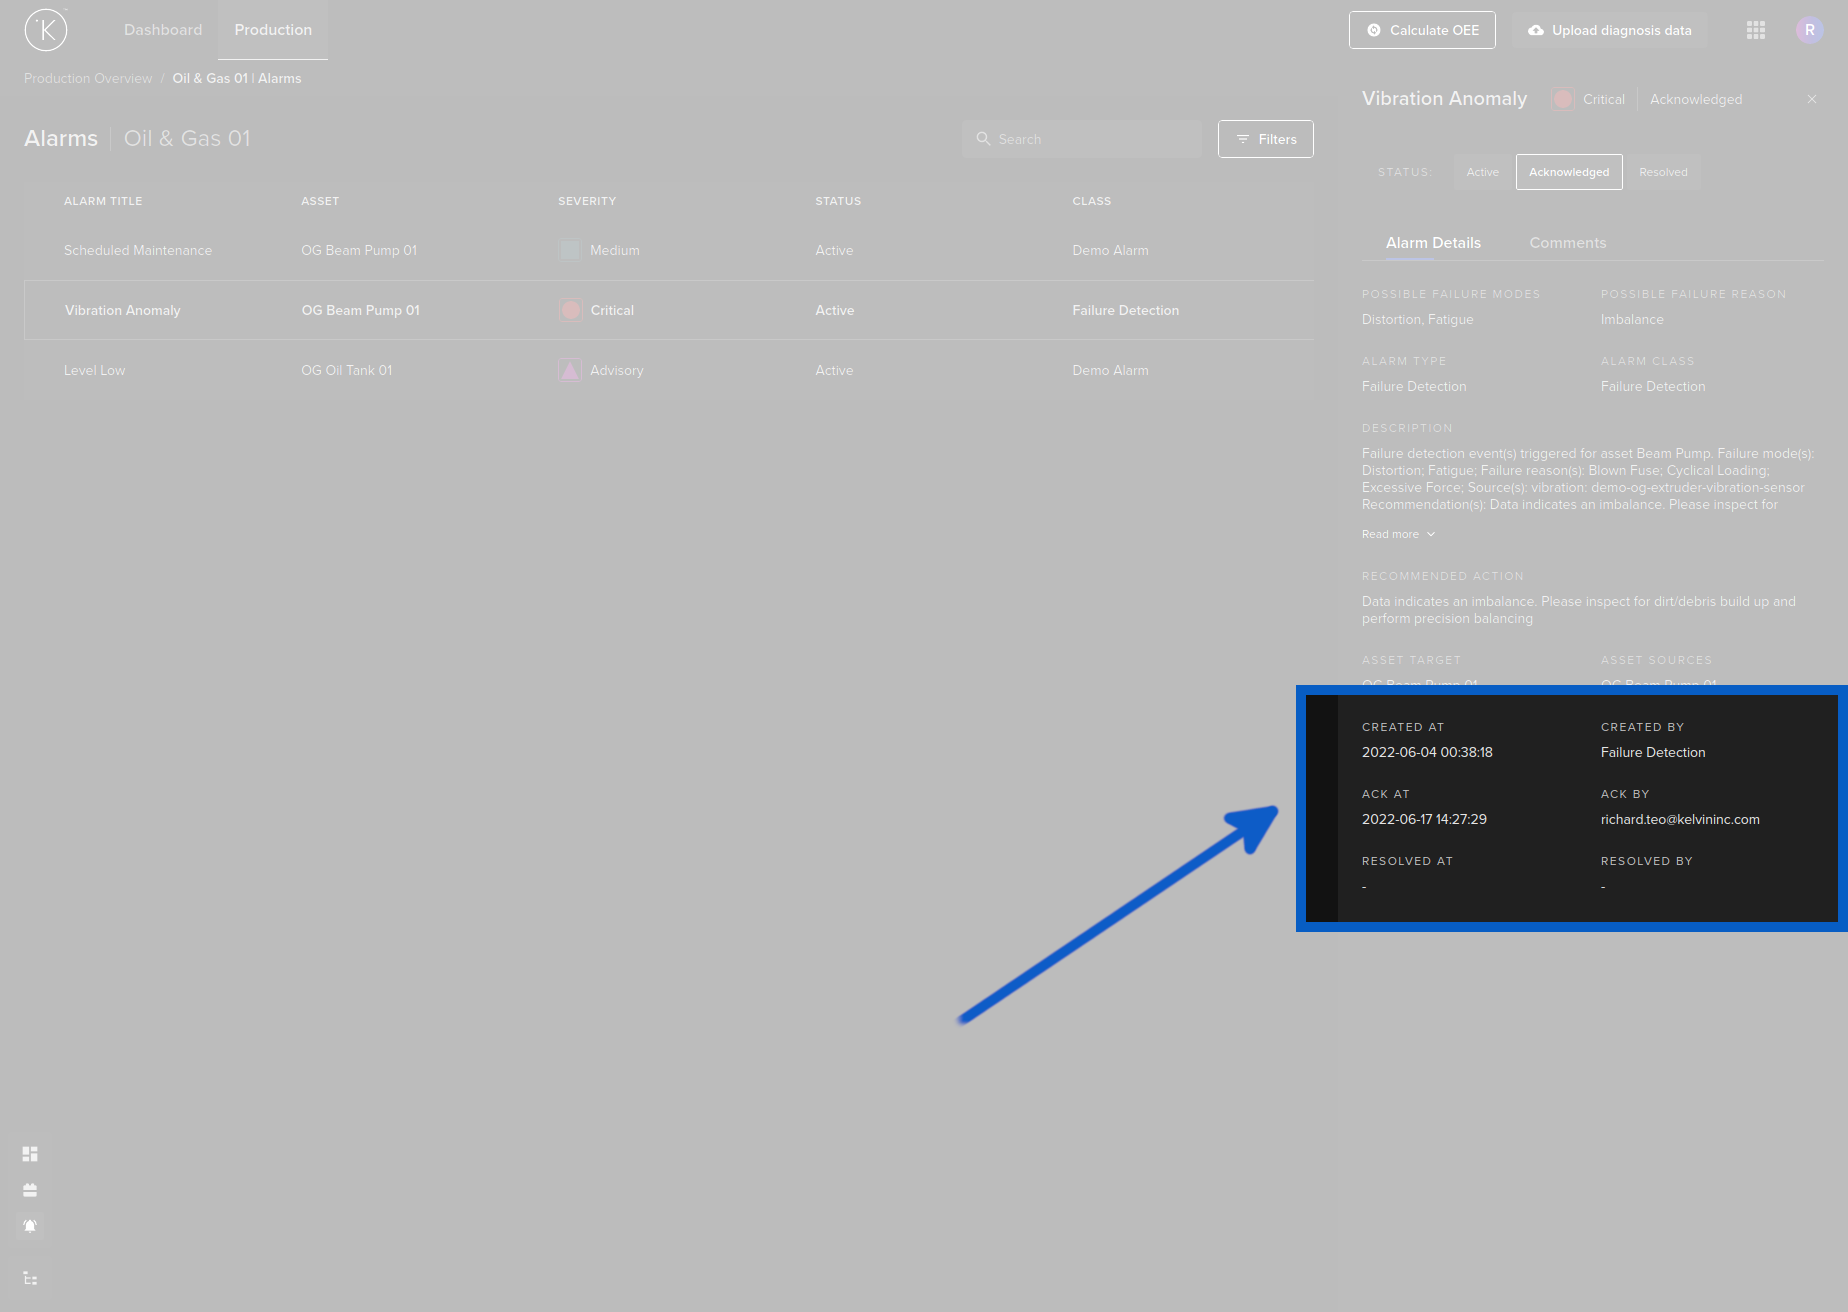
Alarm Active to Acknowledge
When you acknowledge an Alarm, the alarm status will change to Acknowledged and a time will be recorded when the action happened.
When you acknowledge, there will be no confirmation dialog. The Alarm will immediately turn to Acknowledged status. You can always reverse this action, see the instructions further down.
Alarm Acknowledged to Resolved
When you acknowledge an Alarm, the alarm status will change from Acknowledged to Resolved and a time will be recorded when the action happened.
When you change status from acknowledge to resolve, there will be no confirmation dialog. The Alarm will immediately turn to Resolved status. You can always reverse this action, see the instructions further down.

Rollback Actions
In some cases you may need to rollback your actions to Acknowledge or Active. But you must do this before moving on as you will not be able to see this alarm in the alarm list anymore !
If you roll back your actions, the timestamps on when an action was taken (for example when you Acknowledge an Alarm) will be deleted and is not recoverable. You will receive a warning before the roll-back is performed to confirm your rollback.
Types of Rollback
There are three types of rollback you can do depending on what is the status of the Alarm and what you want to do.
| Roll back | Description |
|---|---|
| Resolved to Acknowledged | This will change the status of the alarm to Acknowledged. The Resolved At and Resolved By information will be erased. The Ack At and Ack By information will not change. |
| Acknowledged to Active | This will change the status of the alarm to Active. The Ack At and Ack By information will be erased. The Created At and Created By information will not change. |
| Resolved to Active | This will change the status of the alarm to Active. The Ack At, Ack By, Resolved At and Resolved By information and will be erased. The Created At and Created By information will not change. |
Example Rollback
When the alarm starts as resolved and you click on Acknowledged or Active, you will first get a confirmation box like this;
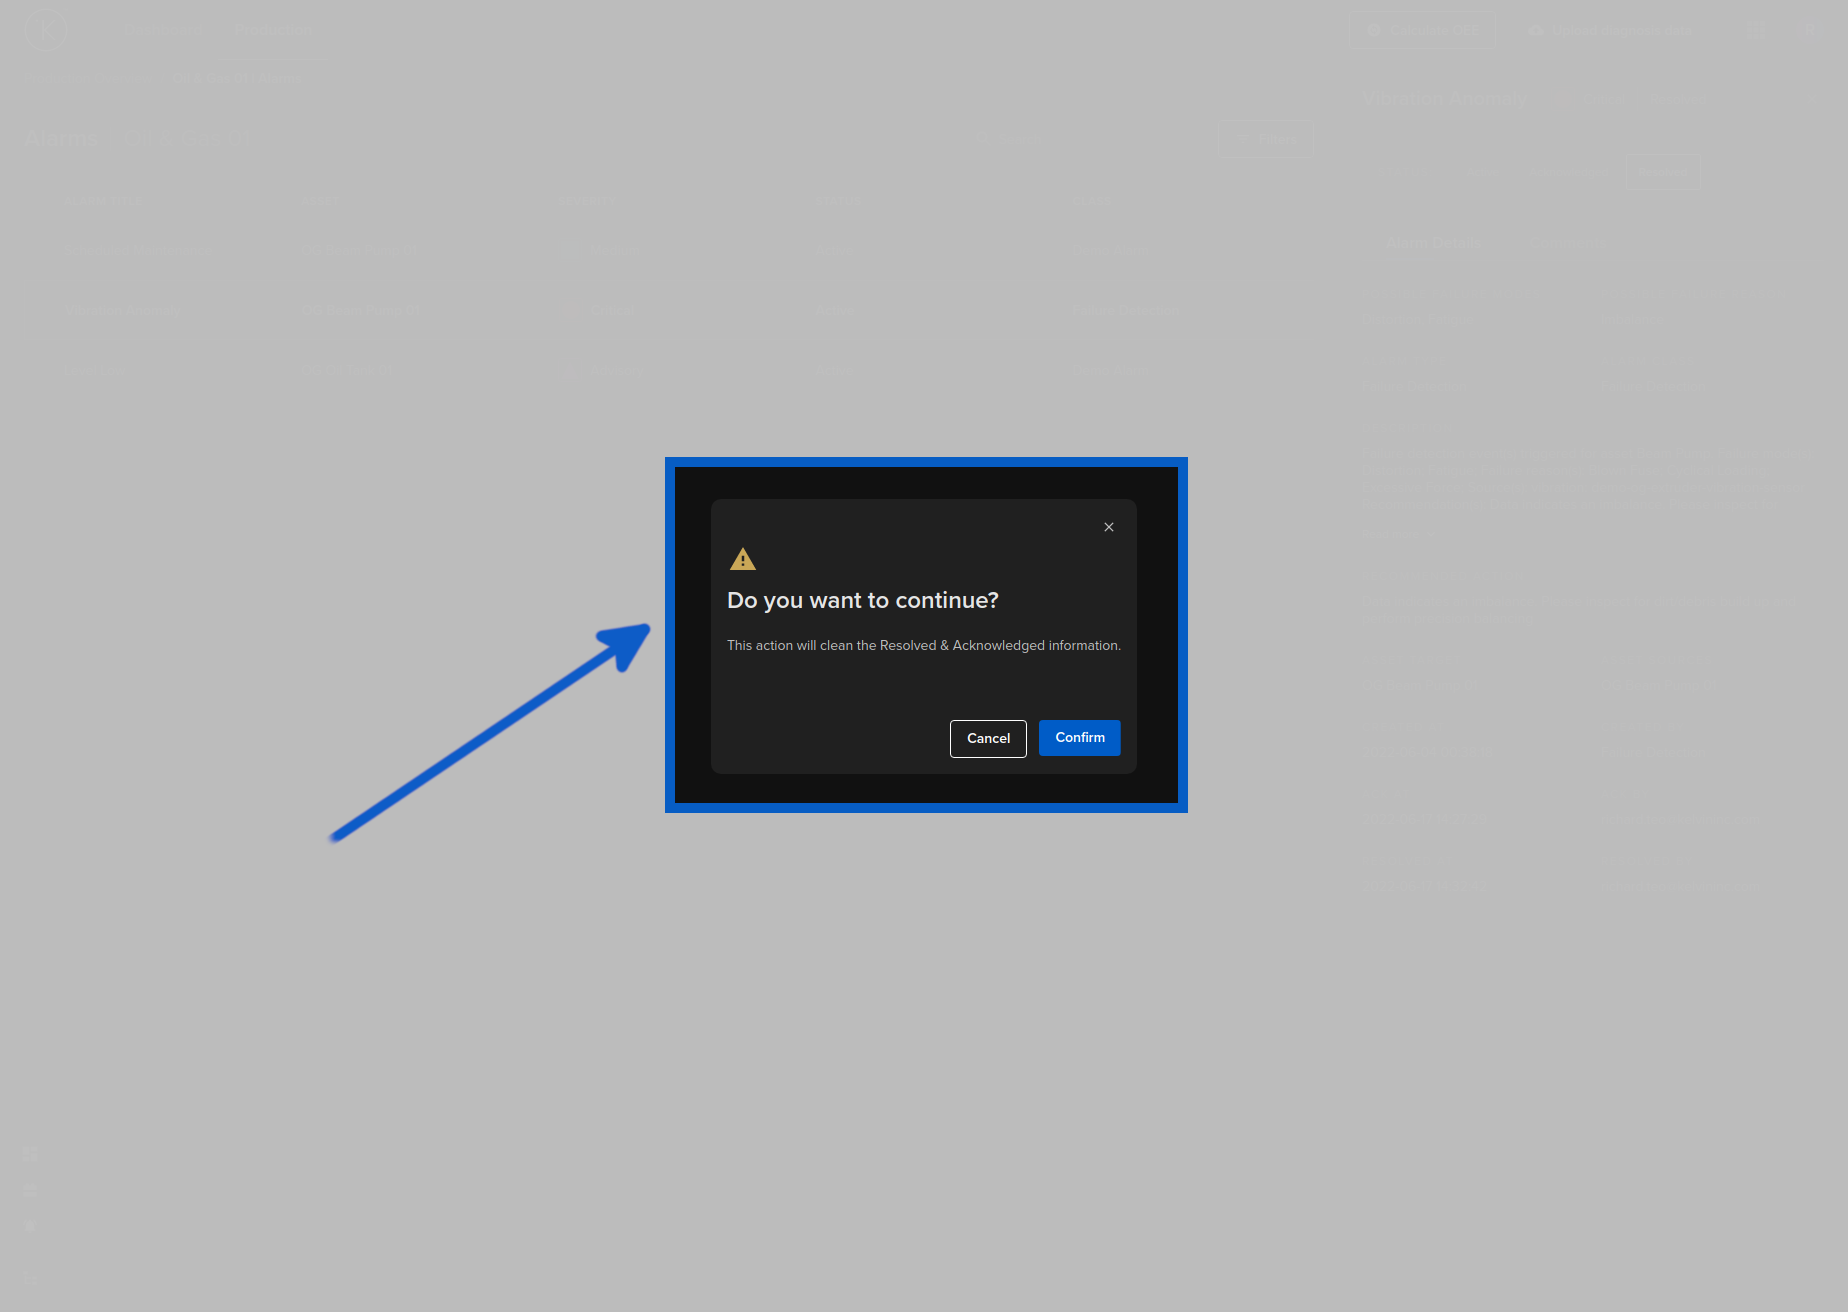
You can see the Ack At, Ack By (if you select Active), Resolved At and Resolved By are deleted (cleaned).
The procedure is the same for other rollback options, just the wording and options will be different.
Alarm Discussions
There is also a a discussion area called comments where you can talk with your team mates or anybody with the organisation about a particular alarm.
If you have Notifications setup, you can also receive these comments in your email.or via SMS.
Comment Thread
When you click on the Comments tab, you can also see a full history of all discussions related to this alarm event. You can also add your own comments to the thread.
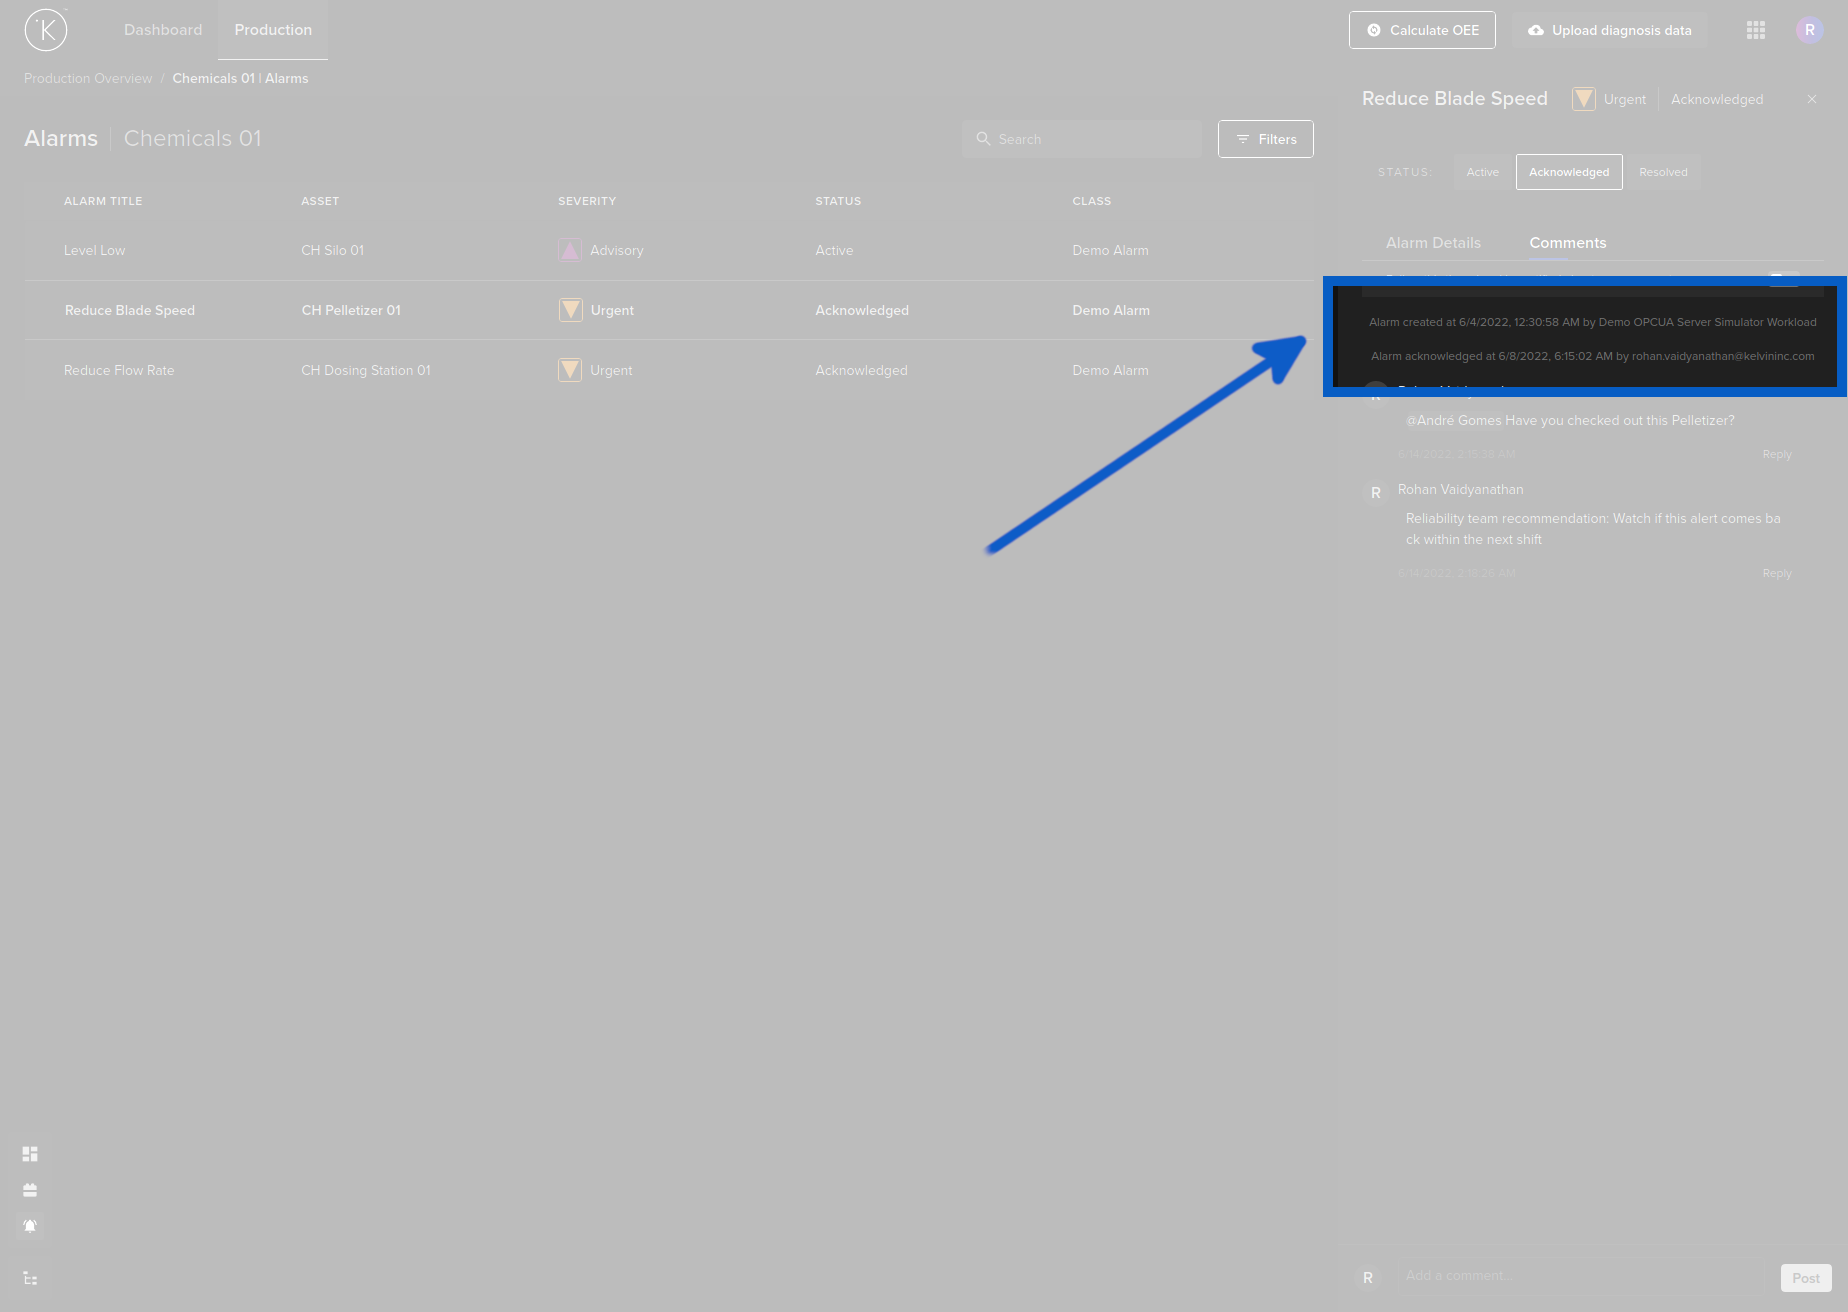
Status Updates
A timestamp of a change in the status of an alarm will be added to the comments for easy historical reference of the evolution of the alarm.
Follow the Thread
If you want to follow all the discussions happening on this thread, then activate the "Follow this thread and be notified about new comments" and you will be notified when any new comments are posted.
The notifications will be sent by email or SMS from your settings in the Notifications page inside Kelvin Manager UI.
Alert People in your Organization
Like many communication apps, you can also directly alert any one in your organisation with an email or SMS by mentioning their handle in the post.
To alert someone, simply type "@" and a list of all people in your organisation will appear and you can select the person you want to alert. Alerting multiple people in one post is possible.
All people mentioned will then get an email or SMS in their Inbox similar to this;
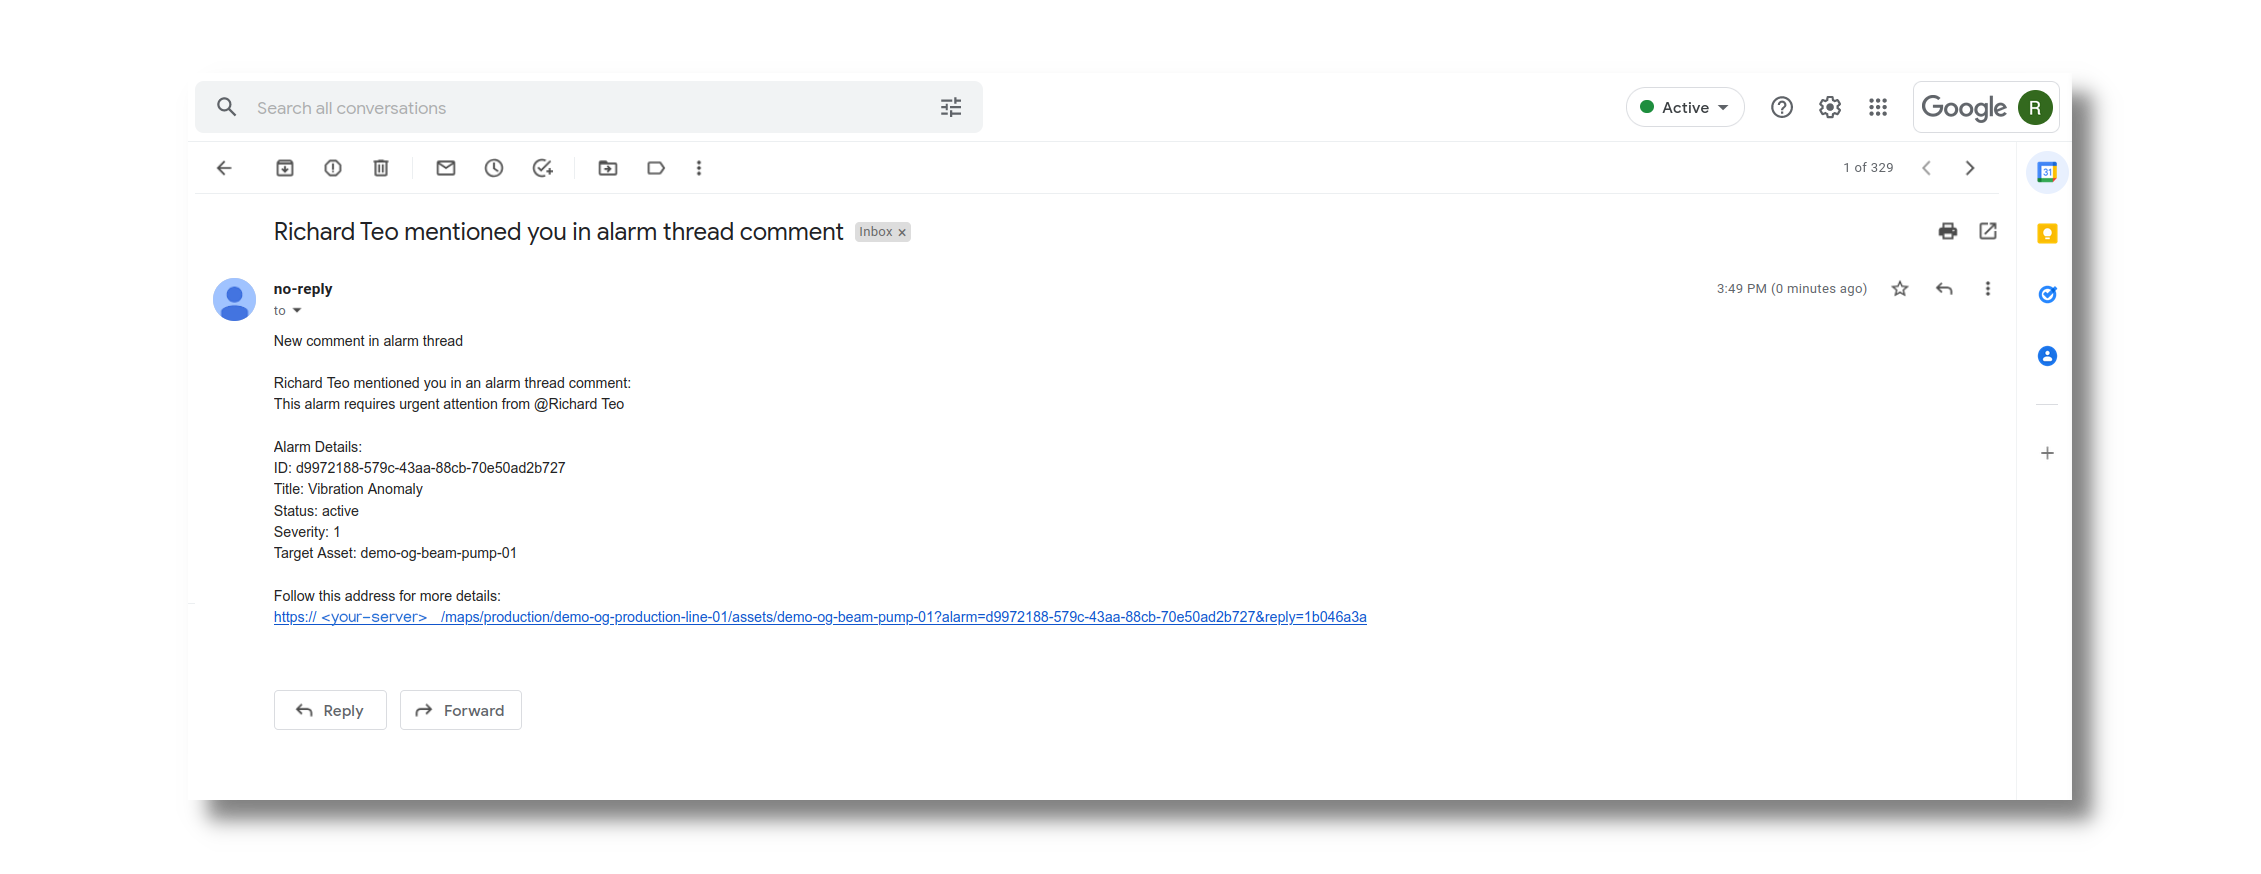
You can setup your receiving email address or SMS telephone number in the Kelvin Manager UI under Notifications.
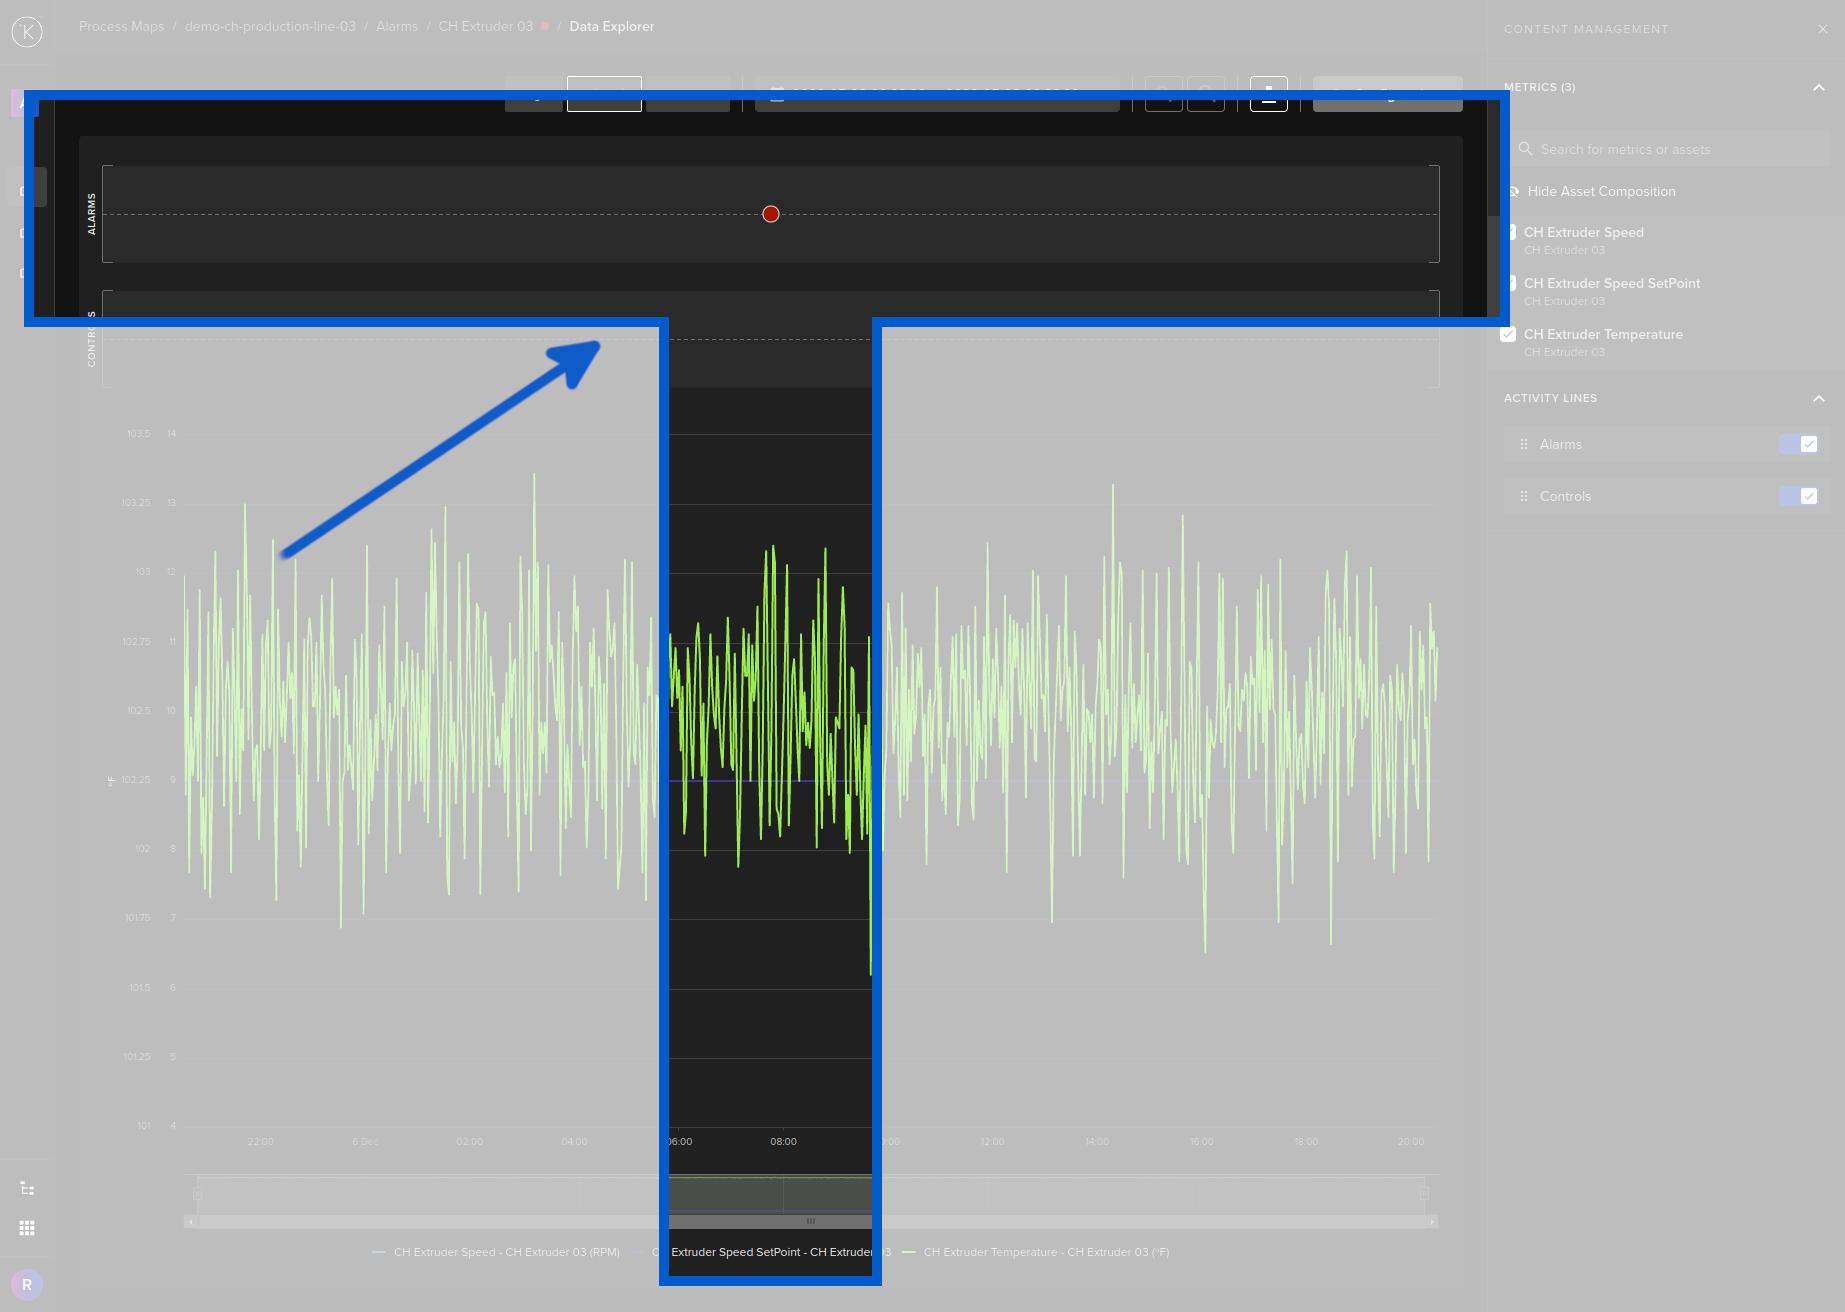
Link to Data Explorer
At the top you will see a button that links directly to the time when the Alarm occurred.
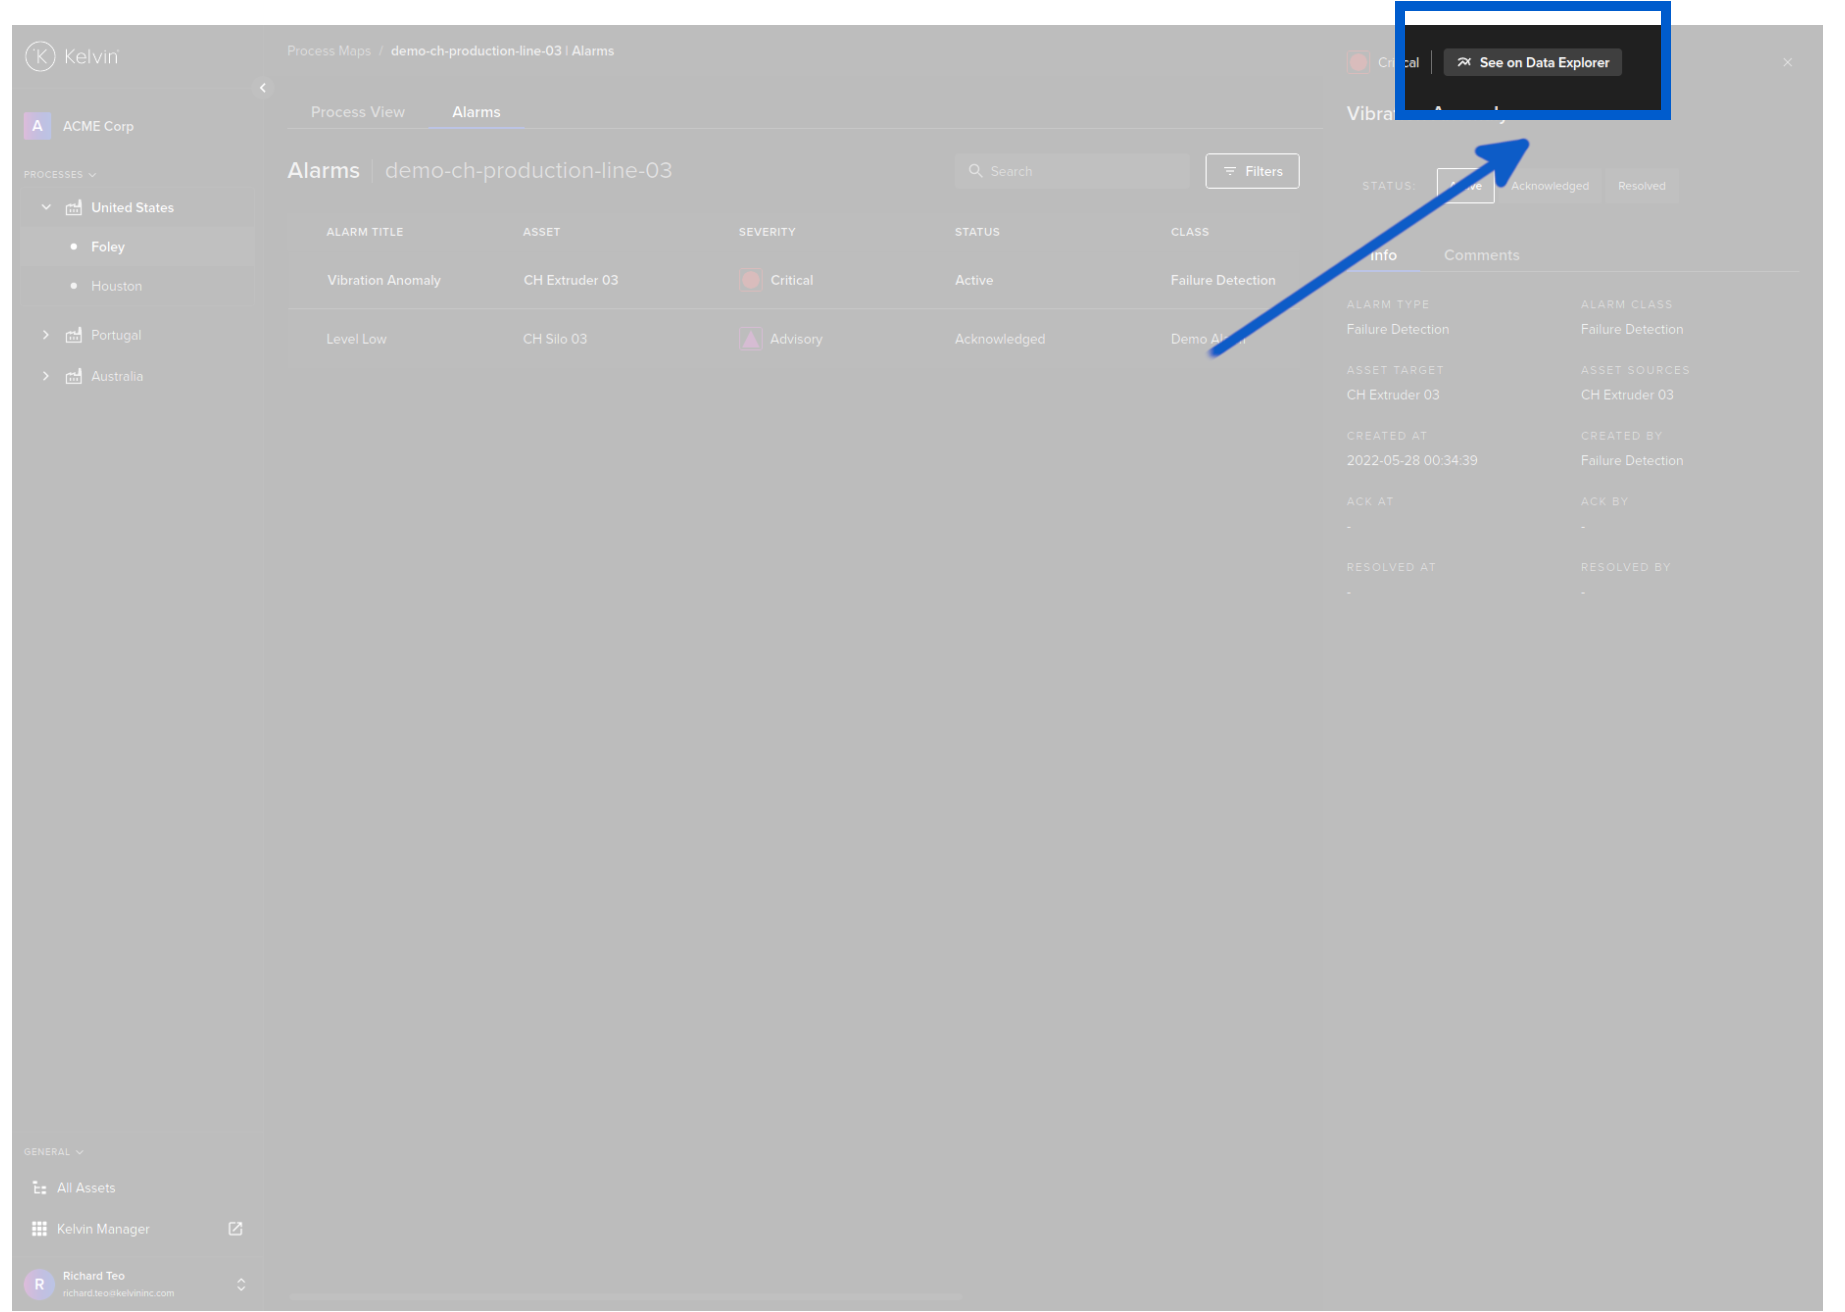
From there you can view all the metrics at that point in time in the Kelvin Process for analysis.
Other Related Links
Interesting links related to Kelvin Manager UI Overview
- Kelvin Overview -> Kelvin Maps
- Documentation -> Kelvin Maps -> Kelvin Maps Dashboard
- Documentation -> Kelvin Maps -> Kelvin Maps Details
Last Modified
Last Modified on 30th March 2023
30th March 2023
* Alarm table has been upgraded to the new Asset-centric tables
6th December 2022
* Updated infographics
* Added new See on Data Explorer button
7th October 2022
* Updated text and infographics to reflect v4.7 release
28th September 2022
* Updated overview to show Alarms in Asset Detail 2D/3D page and explain the Emissions icon.
29th July 2022
* Started new detailed last modified section
Kelvin Documentation AI Support
Hi. My name is KevDocBot. How can I help you?