Add Modbus Connection - How To
You can add an Modbus connection through the Kelvin UI, Kelvin SDK and Kelvin API.
Only available for amd64 devices. x86_64 version coming soon.
Connections was formerly called Bridges. You will find the Kelvin SDK and Kelvin API commands still refer to Connections as Bridges.
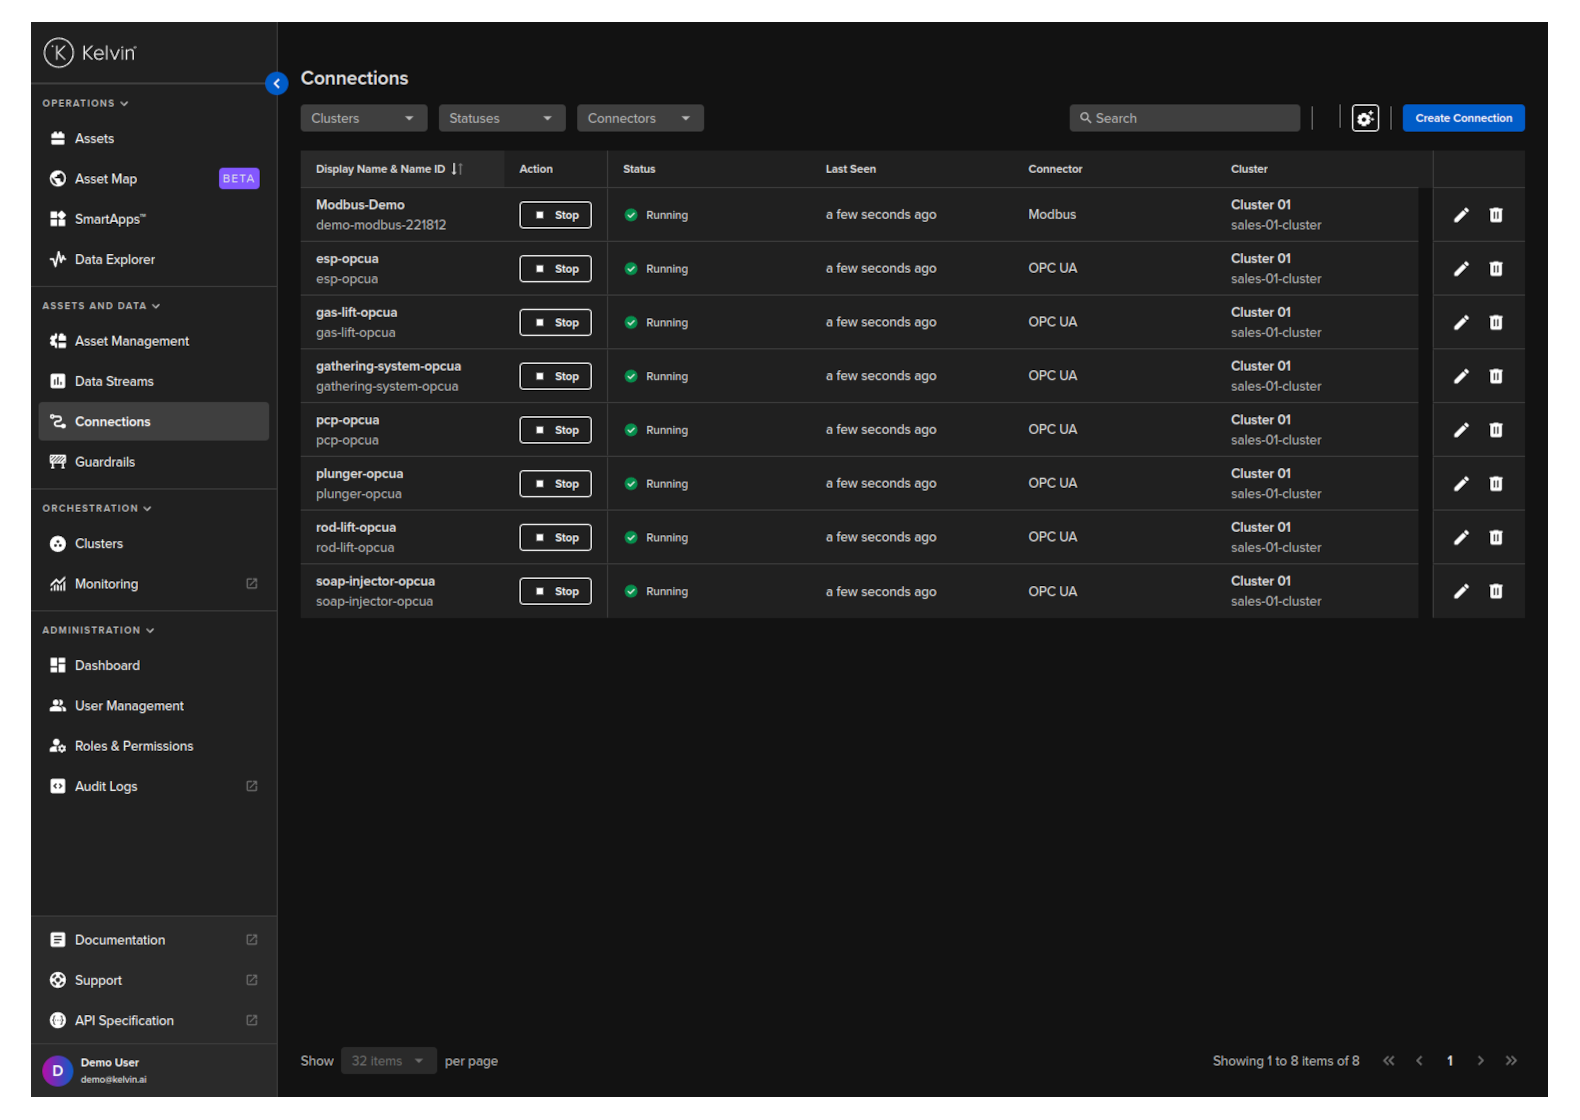
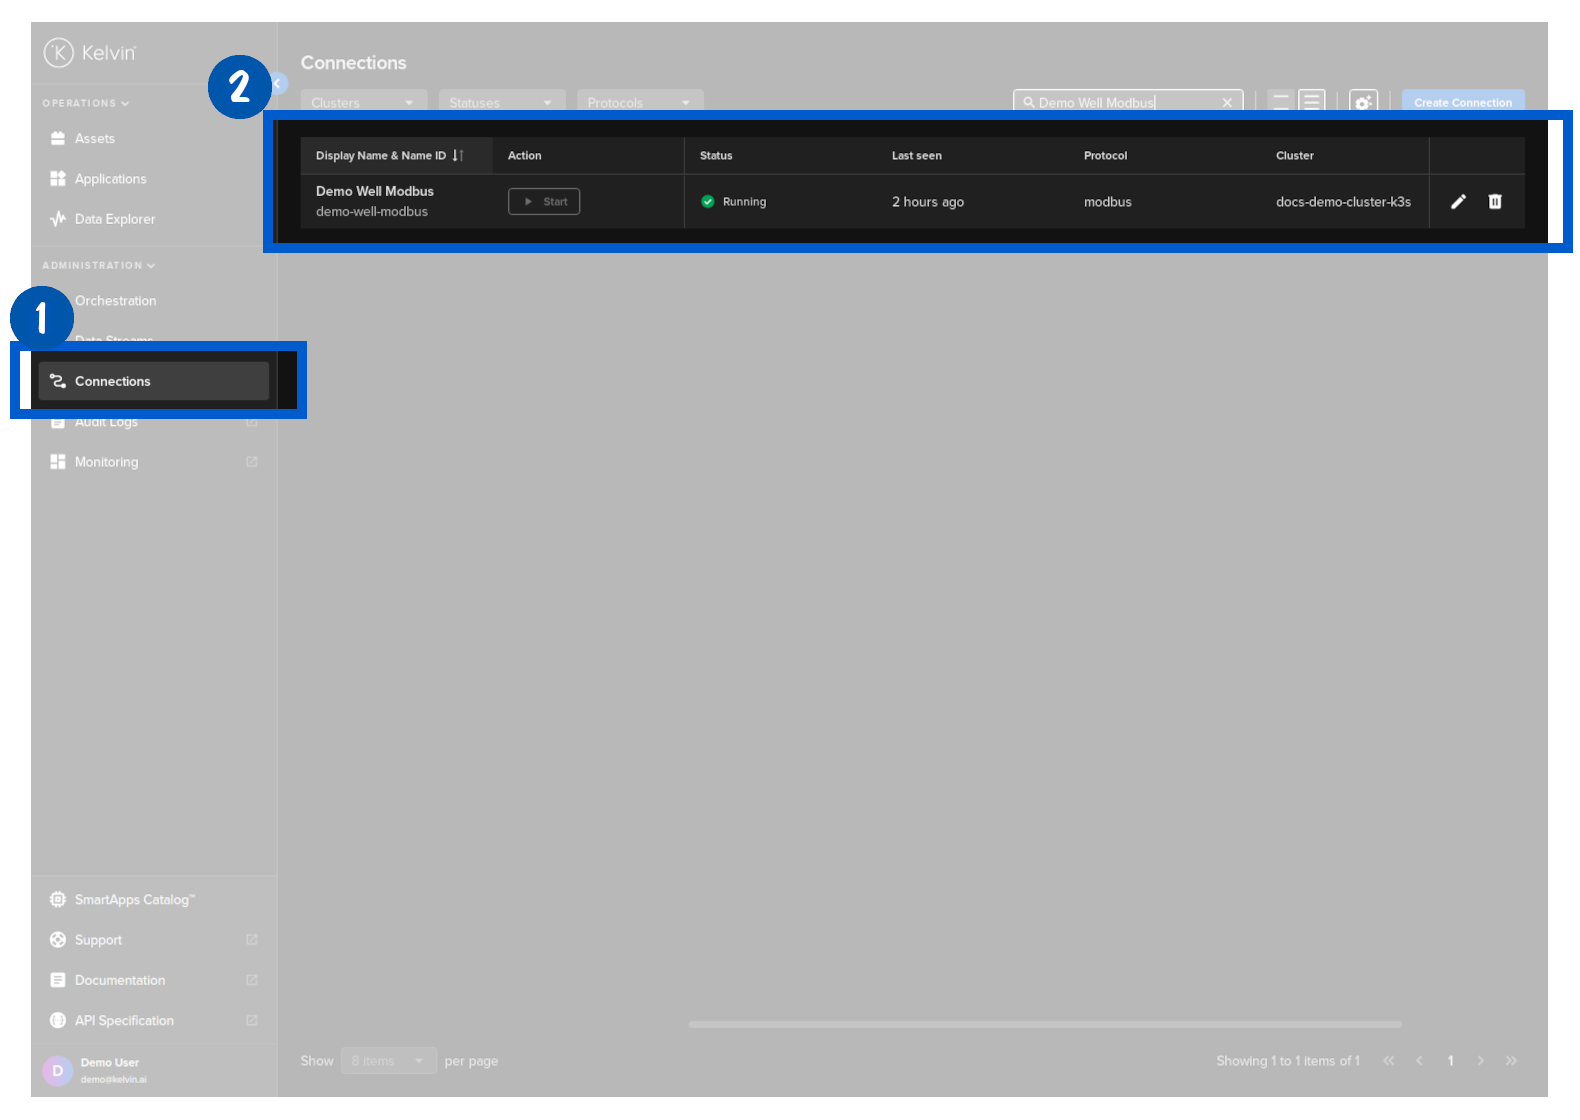
To start click on the Connections menu option from the left side bar menu.
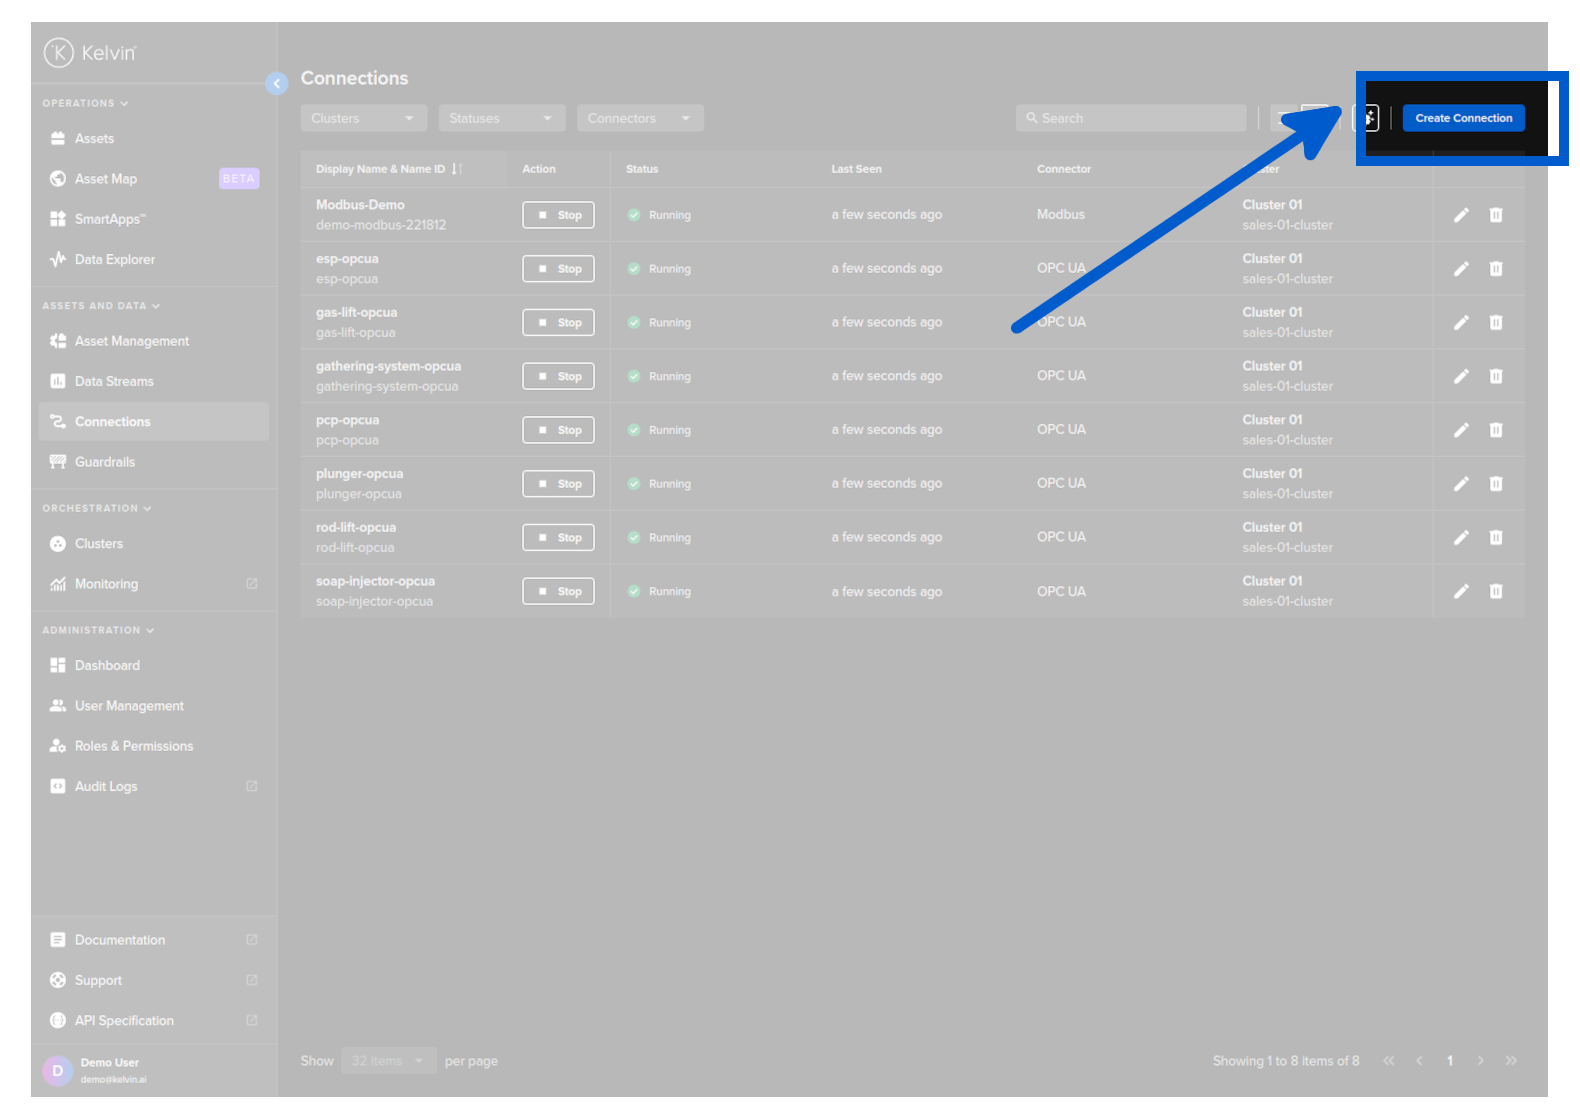
click on the Create Connection button.
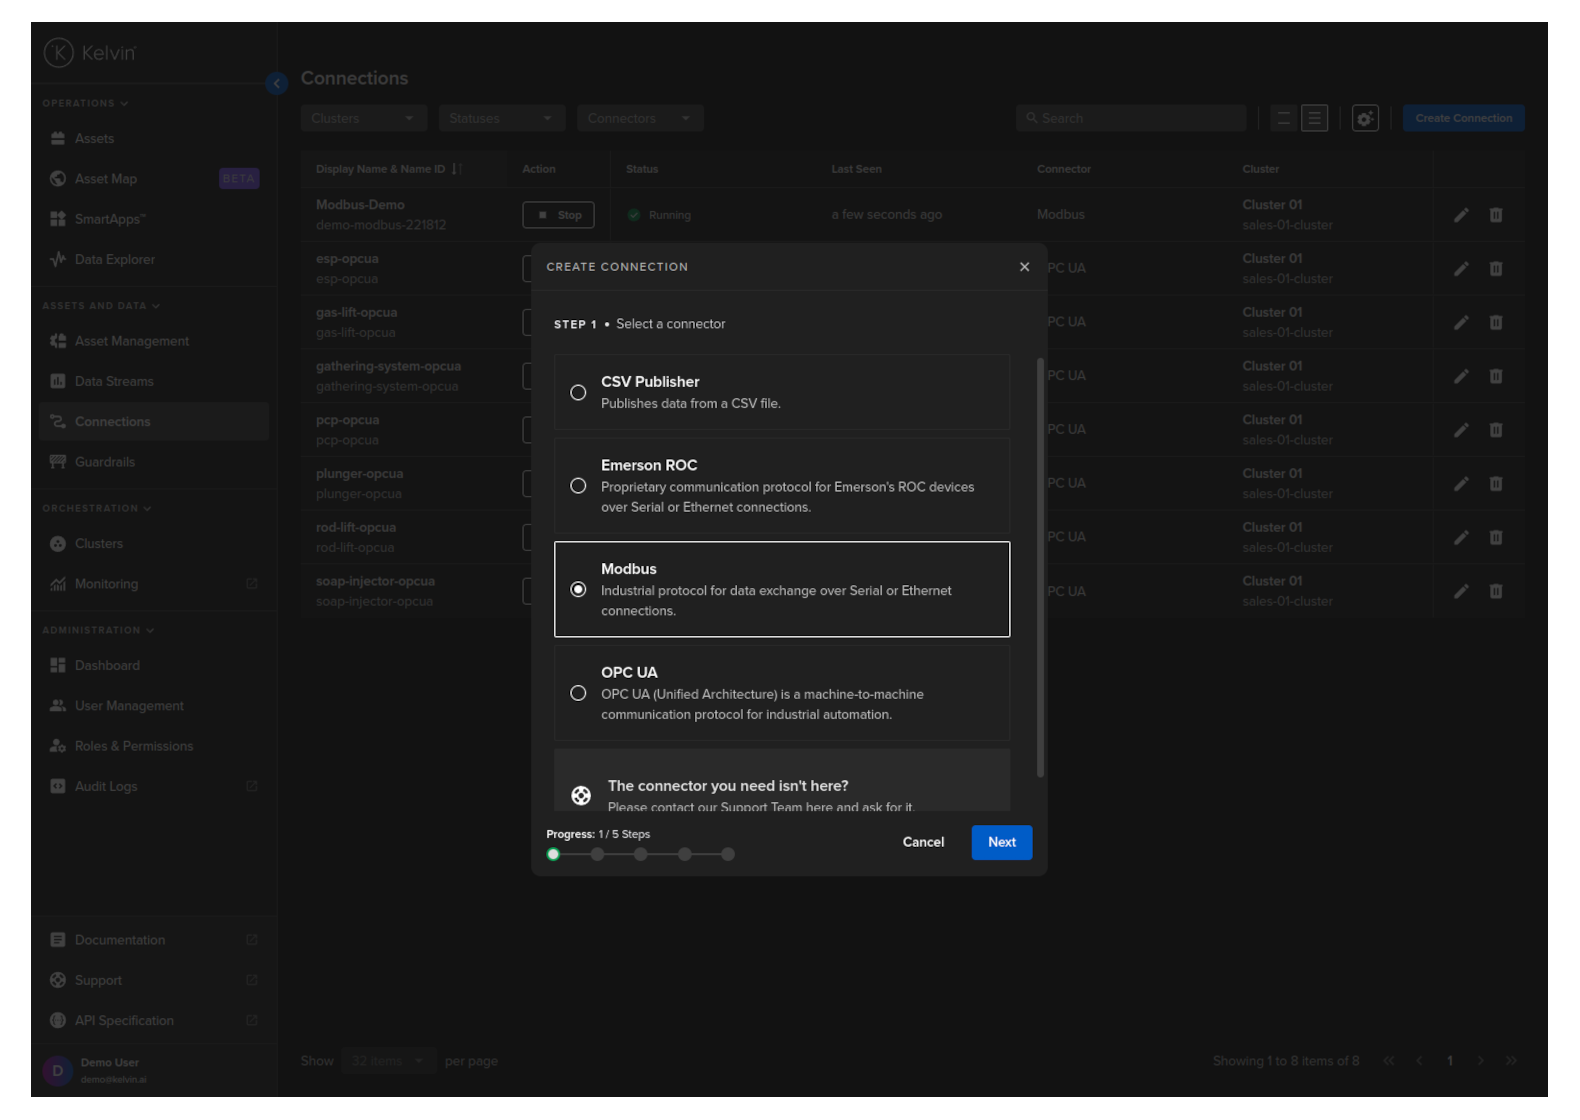
Step 1
Select the Modbus option and click Next.
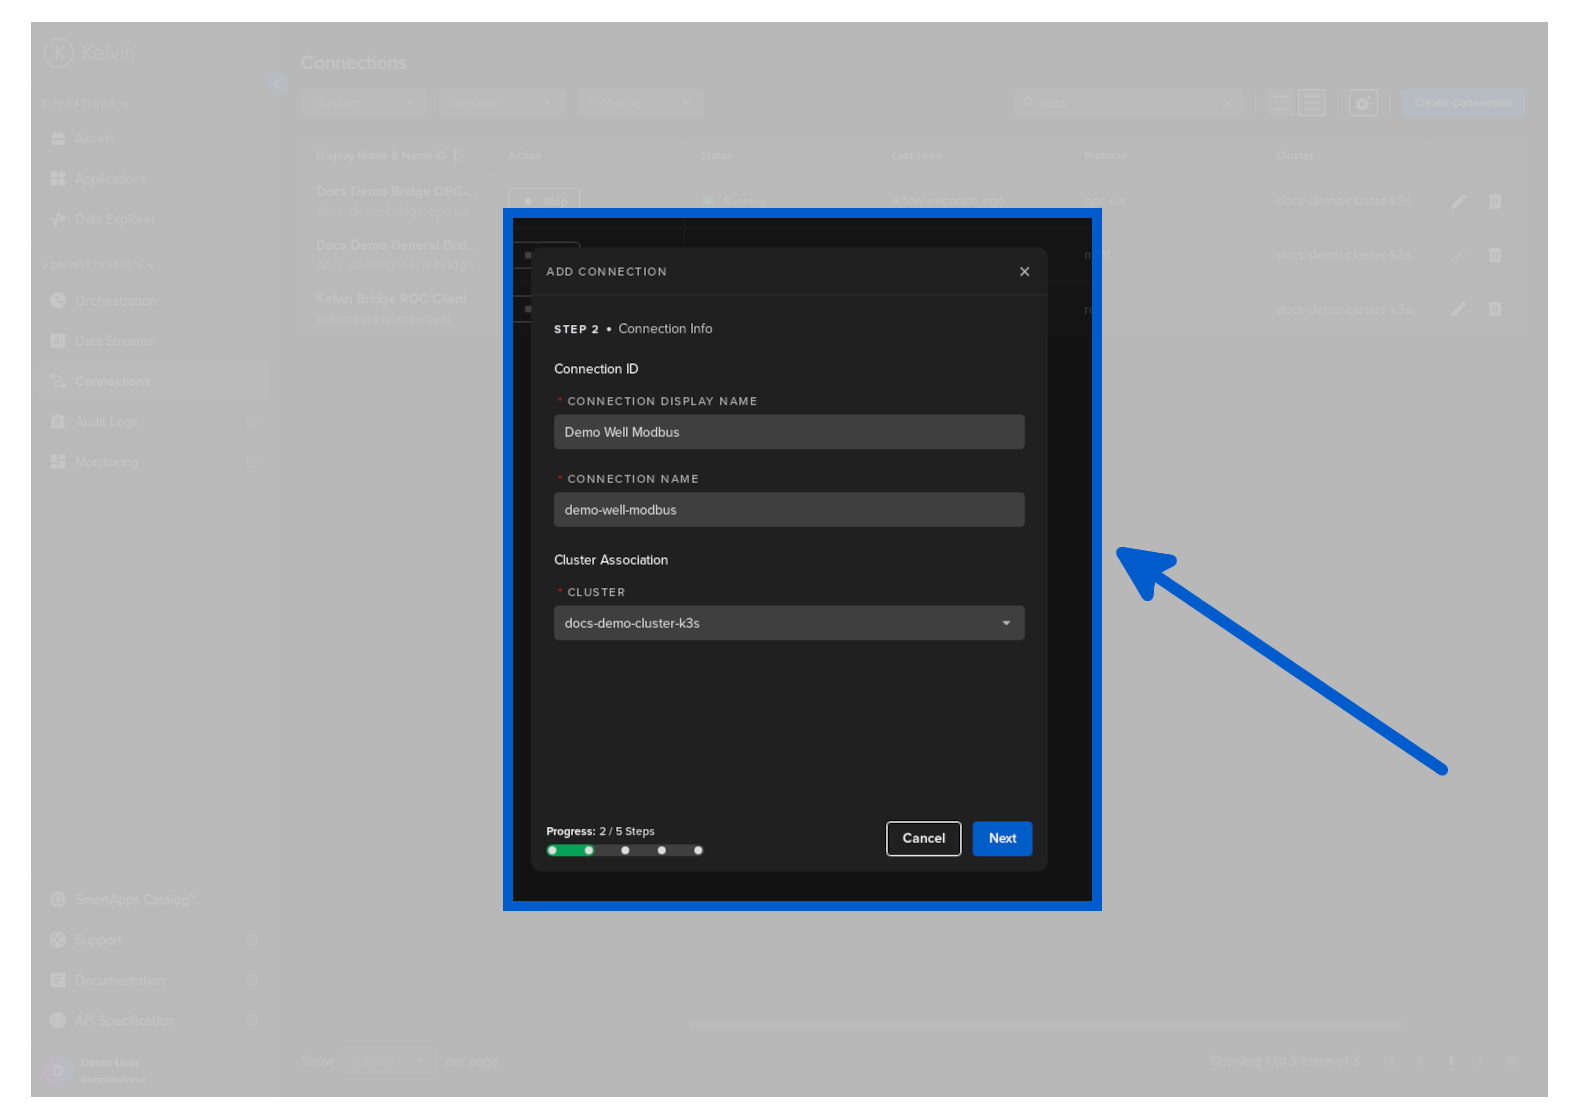
Step 2
Type in a memorable name in the Connection Display Name text input. You can use any letters, numbers and special characters.
The Connection Name text input will be automatically converted and filled in as you type in the Connection Display Name section. The conversion ensures the Connection Name only contains lowercase alphanumeric characters and ., _ or - characters.
Then select which Cluster to deploy the new Connector to.
It is important that the asset is reachable from the selected Cluster.
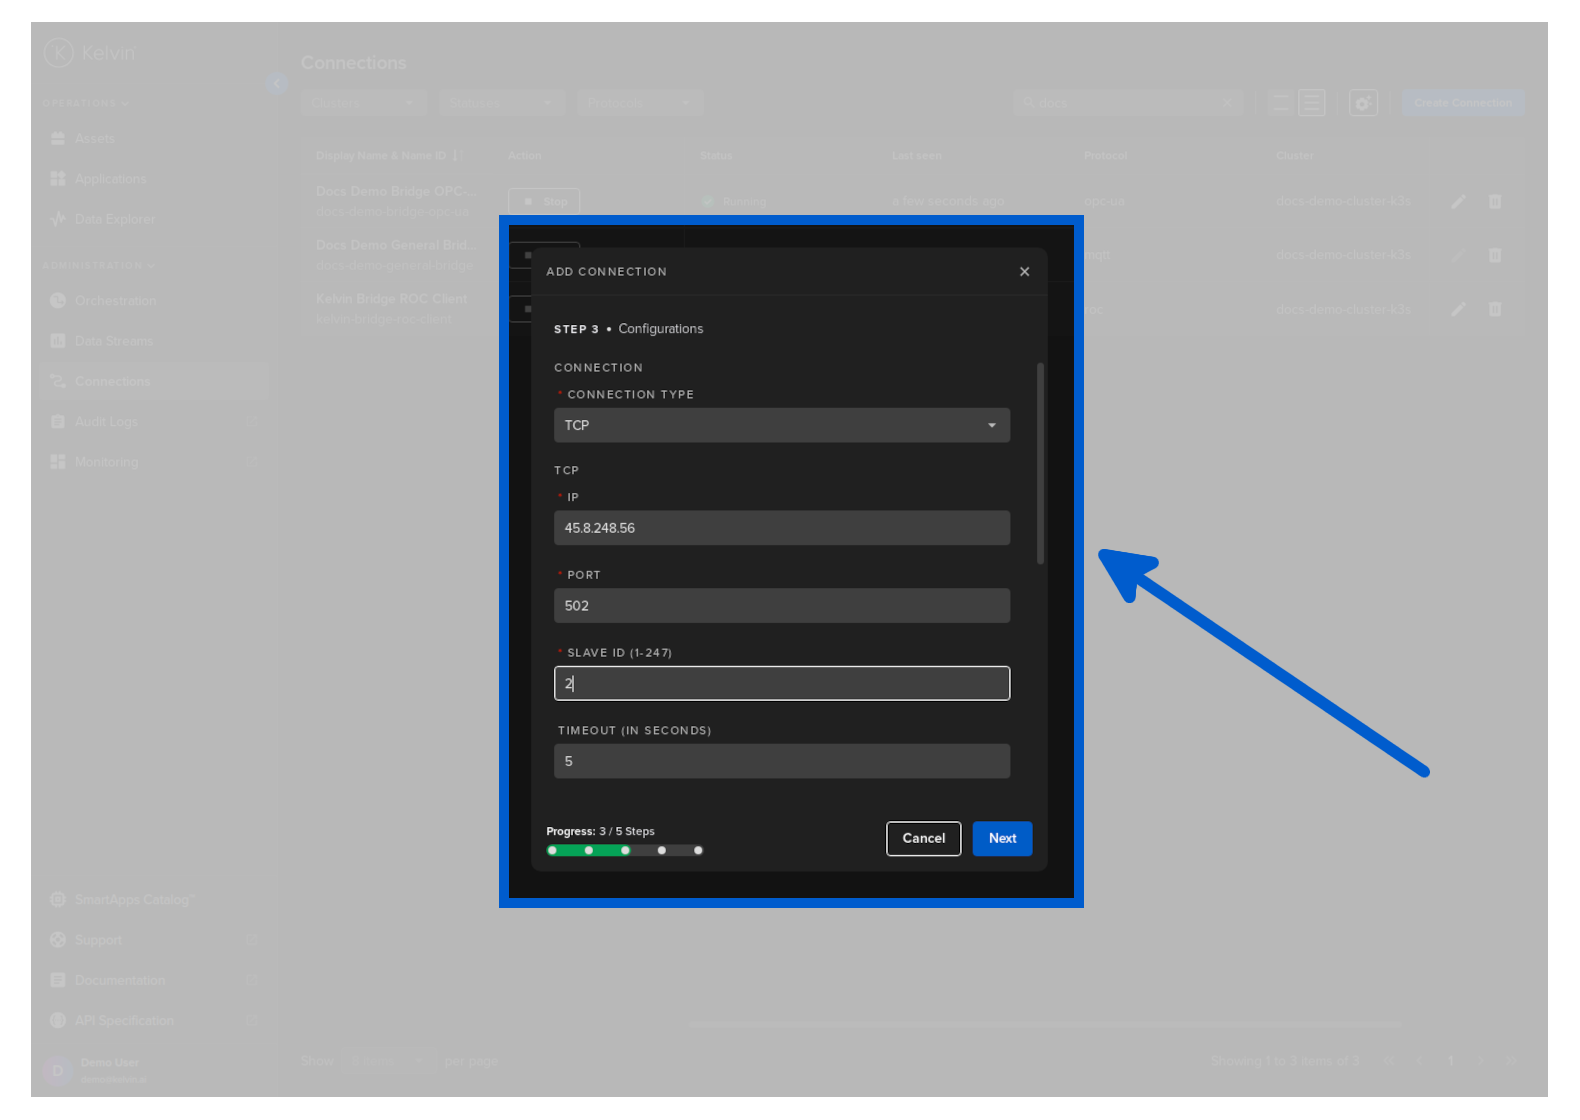
Step 3
Configure the Modbus connection to the asset. There are a number of optional and mandatory parameters to fill in.
For the optional parameters, if you do not fill in any values, the default values will be used.
| Parameter | Options | Description | Default | Mandatory |
|---|---|---|---|---|
| Connection Type | TCP or RTU | Specifies the type of Modbus connection, such as TCP (for Modbus TCP) or RTU (for Modbus RTU). | Yes | |
| IP | String (IP address) | The IP address of the Modbus TCP device to connect to for Modbus TCP connection. | Yes | |
| Port | Numeric value (port number) | The network port number used for Modbus TCP connection. | Yes | |
| Serial Port | String (serial port identifier) | The identifier of the serial port used for Modbus RTU connection. | Yes | |
| Serial Mode | RS232, RS485 | Specifies the serial transmission mode for Modbus RTU. | Yes | |
| Slave ID | Numeric value | The address of the slave device in the Modbus network to communicate with. | Yes | |
| Timeout (In Seconds) | Numeric value | The maximum duration to wait for a response from the slave device before timing out. | 5 | No |
| Reconnect Delay (In Seconds) | Numeric value | The time to wait before attempting to reconnect after a lost connection. | 15 | No |
| Request Delay (In Seconds) | Numeric value | The delay between successive Modbus requests, used to avoid overloading the network or the slave device. | 0 | No |
| Minus Offset | Numeric value | Used to adjust the addressing when reading data, subtracting from the requested address to match device addressing. | 0 | Yes |
| Read Chunk Timestamp Sync | Boolean (True/False) | Specifies whether to synchronize timestamps for each chunk of data read in a transaction. | False | No |
| Protocol Debug | Boolean (True/False) | Enables or disables additional logging for troubleshooting and debugging the Modbus protocol communication. | False | No |
| Register Chunk Size | Numeric value | Defines the size of data chunks (in register units) to be read in each Modbus request. | 120 | No |
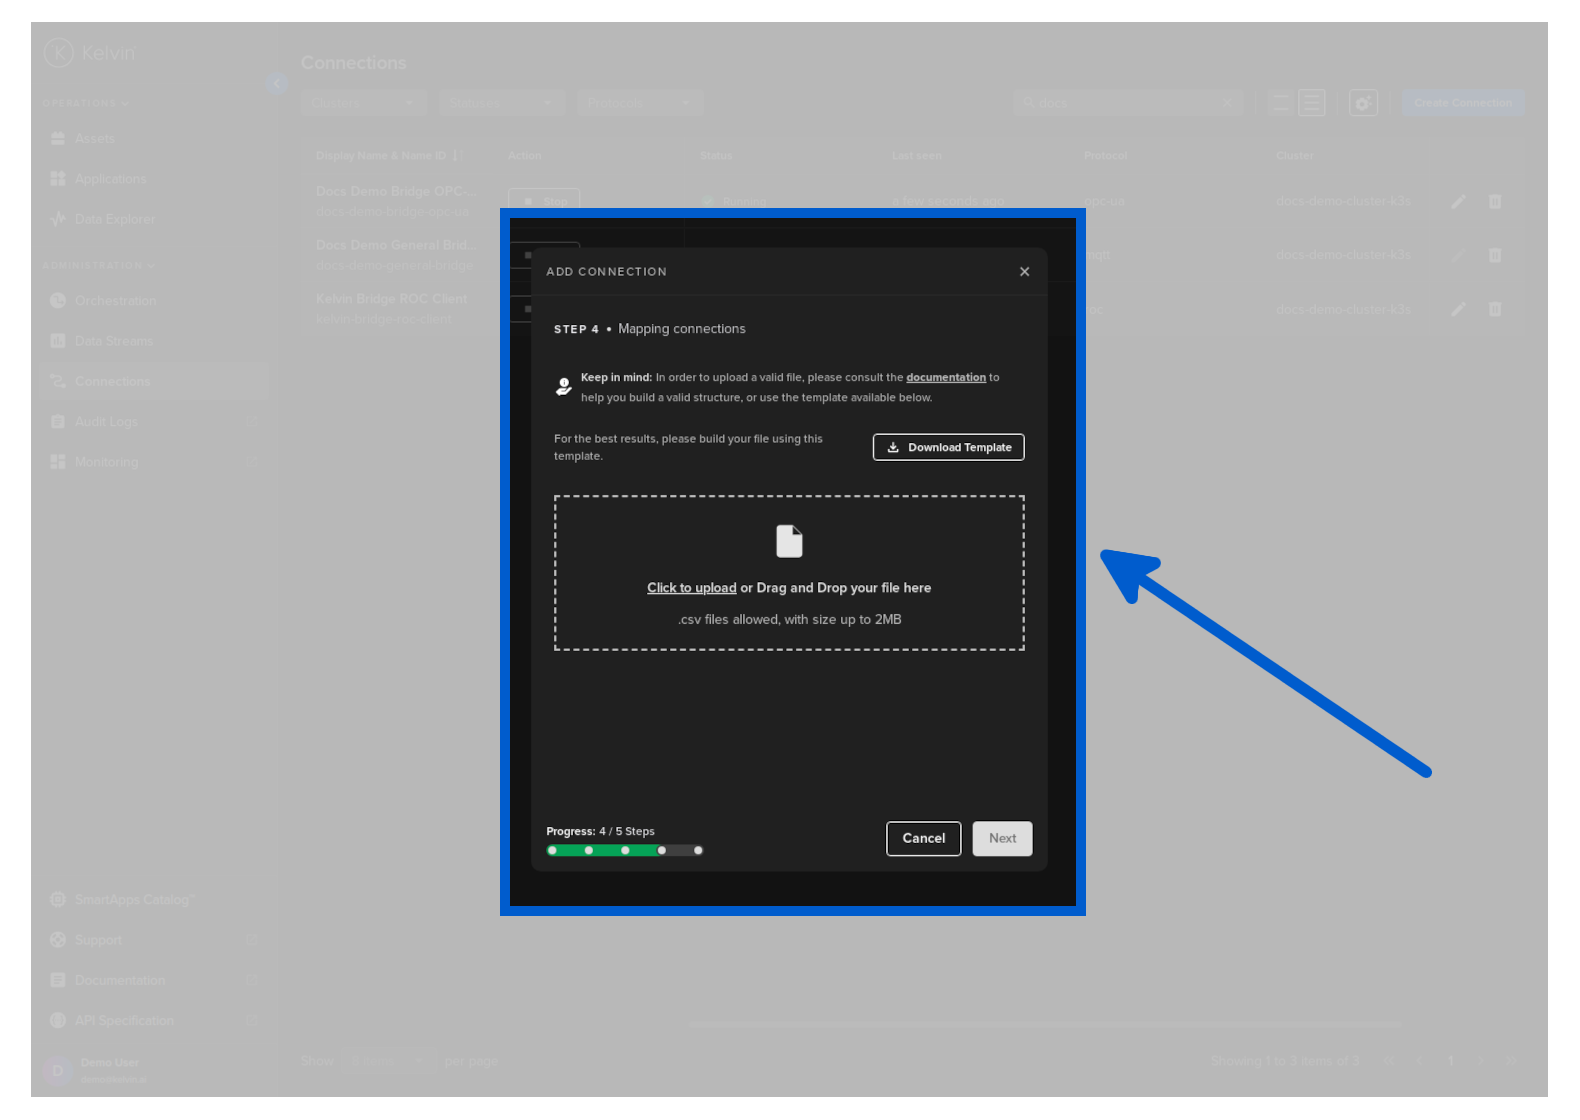
Step 4
Download, complete, and upload the available template to define the mapping connections between the Modbus address and the Asset/Data Stream.
You can only upload one file. Multiple file uploads is not allowed and only the latest selected file will be used.
Do not modify the header in the downloaded template file. In the next step the header will be checked to ensure the csv structure is correct. Start adding your data from row 2 onwards.
| Header | Description | Example | Mandatory |
|---|---|---|---|
| DataStream Name | The Kelvin Data Stream name (must be lowercase alphanumeric with no spaces) | water-flow | Yes |
| Asset Name | The Kelvin Asset name (must be lowercase alphanumeric with no spaces) | well-01 | Yes |
| DataStream Type | The type of data (boolean, number, object and string) | number | No |
| Access | Read/Write (RW) or Read Only (RO) | RO | Yes |
| Storage | Location of the storage; "none", "node", "node-and-cloud" | node-and-cloud | No |
| Polling Rate (in seconds) | How often to pull the data from the asset | 30 | Yes |
| Address (1-49999) | The specific modbus address or register number of the data in the asset. | 1023 | Yes |
| Protocol Type | Specifies the protocol data type used for interpreting the data. | uint32 | Yes |
Step 5
The file will now be validated before you can initiate the connection with the following checks;
- Structure
- All required columns are present
- Columns naming is correct
- File has content below the header
- Content
- Required Fields (Data Stream Name, Asset Name and Access fields are properly filled)
- Content Matches the patterns and is valid content
- No duplicate content has been detected
- System
- All Assets exist on the system
- All Data Stream exist on the system
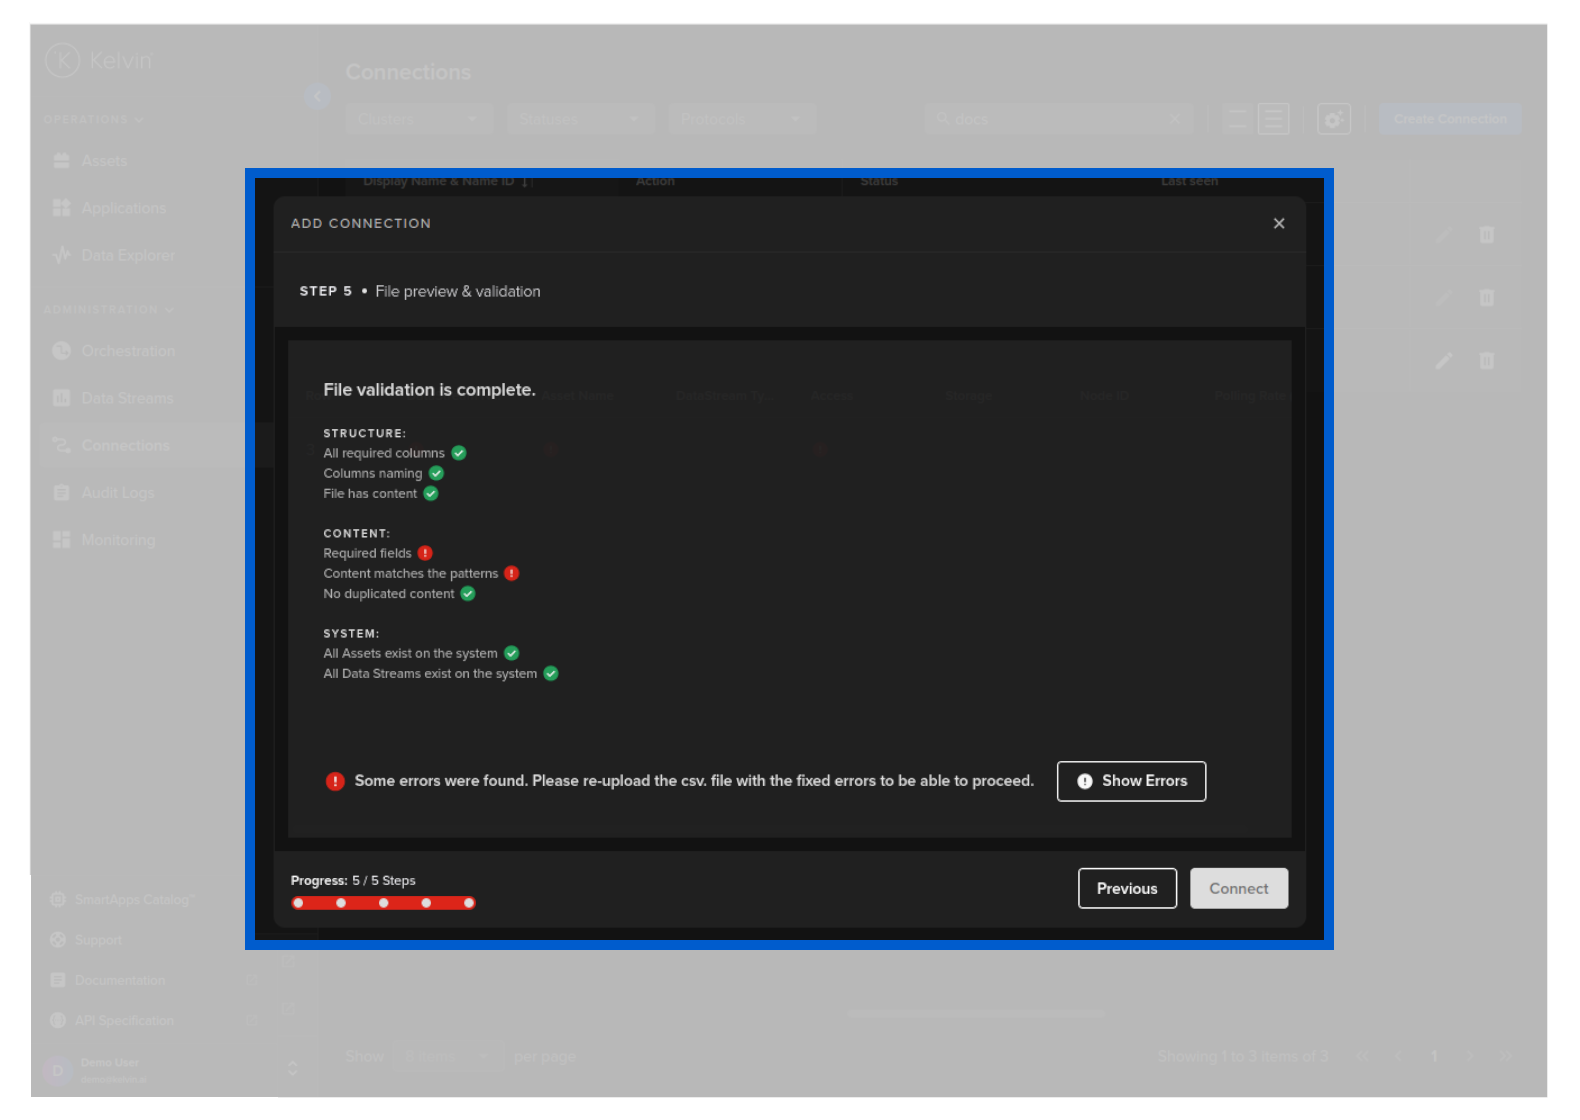
If there are any errors, you can view the details by clicking on the Show Errors button.
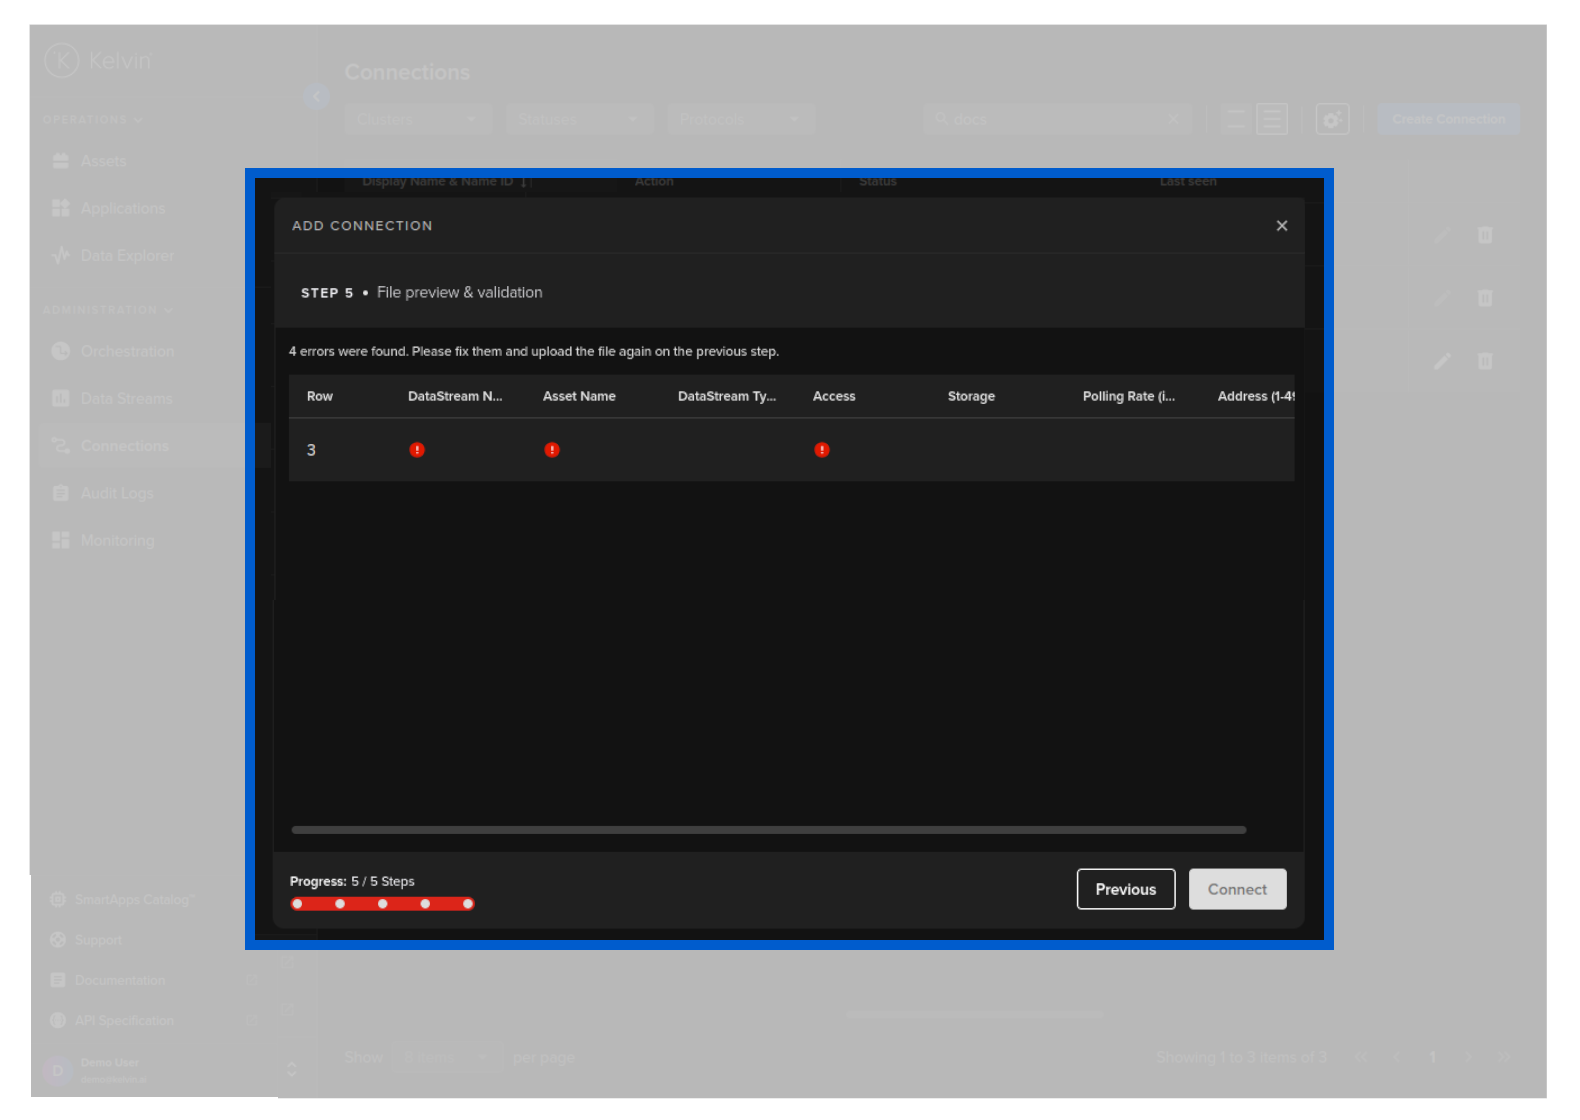
After looking at the error list, you will need to correct your csv file and then return to Step 4 to re-upload. The new file will then be checked and validated again.
When everything is validated, then you can click on Connect button to deploy the Connector to the Cluster. It will start automatically, connect to the asset and start collecting data.
Then in Kelvin UI under Connections you will see your Connection deployed and running.
If you have any issues in the deployment and the Add Connection fails to run, then you can check its logs.
curl -X "POST" \
  "https://<url.kelvin.ai>/api/v4/bridges/deploy" \
  -H "Accept: application/json" \
  -H "Content-Type: application/json" \
  -d '{
  "name": "demo-well-modbus",
  "title": "Demo Well Modbus",
  "cluster_name": "demo-cluster",
  "app_name": "kelvin-bridge-modbus-client",
  "app_version": "4.5.2",
  "payload": {
    "configuration": {
      "minus_offset": 0,
      "chunk_size": 120,
      "timestamp_sync": false,
      "debug": false,
      "connection": {
        "slave_id": 2,
        "type": "tcp",
        "tcp": {
          "ip": "45.8.248.56",
          "port": 502
        }
      }
    },
    "logging_level": "INFO",
    "metrics_map": [
      {
        "access": "RO",
        "asset_name": "pcp_50",
        "configuration": {
          "address": 1023,
          "protocol_type": "uint32",
          "polling_rate": 10,
          "scale_multiplier": 10
        },
        "data_type": "raw.float64",
        "name": "accelerometer_data"
      }
    ]
  }
}'
The response will look something like this;
{
  "name": "demo-well-modbus",
  "title": "Demo Well Modbus",
  "cluster_name": "demo-cluster",
  "workload_name": "demo-well-modbus",
  "payload": {
    "configuration": {
      "chunk_size": 120,
      "connection": {
        "slave_id": 2,
        "tcp": {
          "ip": "45.8.248.56",
          "port": 502
        },
        "type": "tcp"
      },
      "debug": false,
      "minus_offset": 0,
      "timestamp_sync": false
    },
    "logging_level": "INFO",
    "metrics_map": [
      {
        "access": "RO",
        "asset_name": "pcp_50",
        "configuration": {
          "address": 1023,
          "polling_rate": 10,
          "protocol_type": "uint32",
          "scale_multiplier": 10
        },
        "data_type": "raw.float64",
        "name": "accelerometer_data"
      }
    ]
  },
  "enabled": true,
  "app_name": "kelvin-bridge-modbus-client",
  "app_version": "4.5.2",
  "status": {
    "state": "pending_deploy",
    "message": "Pending for deploy",
    "last_seen": "2024-06-01T05:19:03.450299693Z",
    "warnings": null
  },
  "created": "2024-06-01T05:19:02.804525Z",
  "updated": "2024-06-01T05:19:02.804525Z"
}
Then in Kelvin UI under Connections you will see your Connection deployed and running.
If you have any issues in the deployment and the /bridges/deploy fails to run, then you can check its logs.
from kelvin.api.client import Client

# Login
client = Client(config={"url": "https://<url.kelvin.ai>", "username": "<your_username>"})
client.login(password="<your_password>")

# Create Connection (Bridge)
response = client.bridge.deploy_bridge(data={
  "name": "docs-demo-bridge-modbus",
  "title": "Docs Demo Bridge Modbus",
  "cluster_name": "demo-cluster",
  "app_name": "kelvin-bridge-modbus-client",
  "app_version": "4.5.2",
  "payload": {
    "configuration": {
      "minus_offset": 0,
      "chunk_size": 120,
      "timestamp_sync": False,
      "debug": False,
      "connection": {
        "slave_id": 2,
        "type": "tcp",
        "tcp": {
          "ip": "45.8.248.56",
          "port": 502
        }
      }
    },
    "metrics_map": [
      {
        "access": "RO",
        "asset_name": "2_stage_separator_1",
        "configuration": {
          "address": 1023,
          "protocol_type": "uint32",
          "polling_rate": 10,
          "scale_multiplier": 10
        },
        "data_type": "number",
        "name": "demo-data-stream-01"
      }
    ]
  }
})

print(response)
You will get a response similar to this;
cluster_name='demo-cluster' created=datetime.datetime(2024, 6, 1, 5, 35, 39, 191344, tzinfo=datetime.timezone.utc) enabled=True name='docs-demo-bridge-modbus' node_name=None payload=AppYaml(configuration={'chunk_size': 120, 'connection': {'slave_id': 2, 'tcp': {'ip': '45.8.248.56', 'port': 502}, 'type': 'tcp'}, 'debug': False, 'minus_offset': 0, 'timestamp_sync': False}, metrics_map=[{'access': 'RO', 'asset_name': '2_stage_separator_1', 'configuration': {'address': 1023, 'polling_rate': 10, 'protocol_type': 'uint32', 'scale_multiplier': 10}, 'data_type': 'number', 'name': 'demo-data-stream-01'}]) status=WorkloadStatus(last_seen=datetime.datetime(2024, 6, 1, 5, 35, 39, 564051, tzinfo=datetime.timezone.utc), message='Pending for deploy', state=<WorkloadStatus.pending_deploy: 'pending_deploy'>, warnings=None) title='Docs Demo Bridge Modbus' updated=datetime.datetime(2024, 6, 1, 5, 35, 39, 191344, tzinfo=datetime.timezone.utc) workload_name='docs-demo-bridge-modbus' app_name='kelvin-bridge-modbus-client' app_version='4.5.2'
Then in Kelvin UI under Connections you will see your Connection deployed and running.
If you have any issues in the deployment then you can check its logs.