Impact
On this page you will learn about what Impact is and how it fits into Kelvin.
What is Impact?
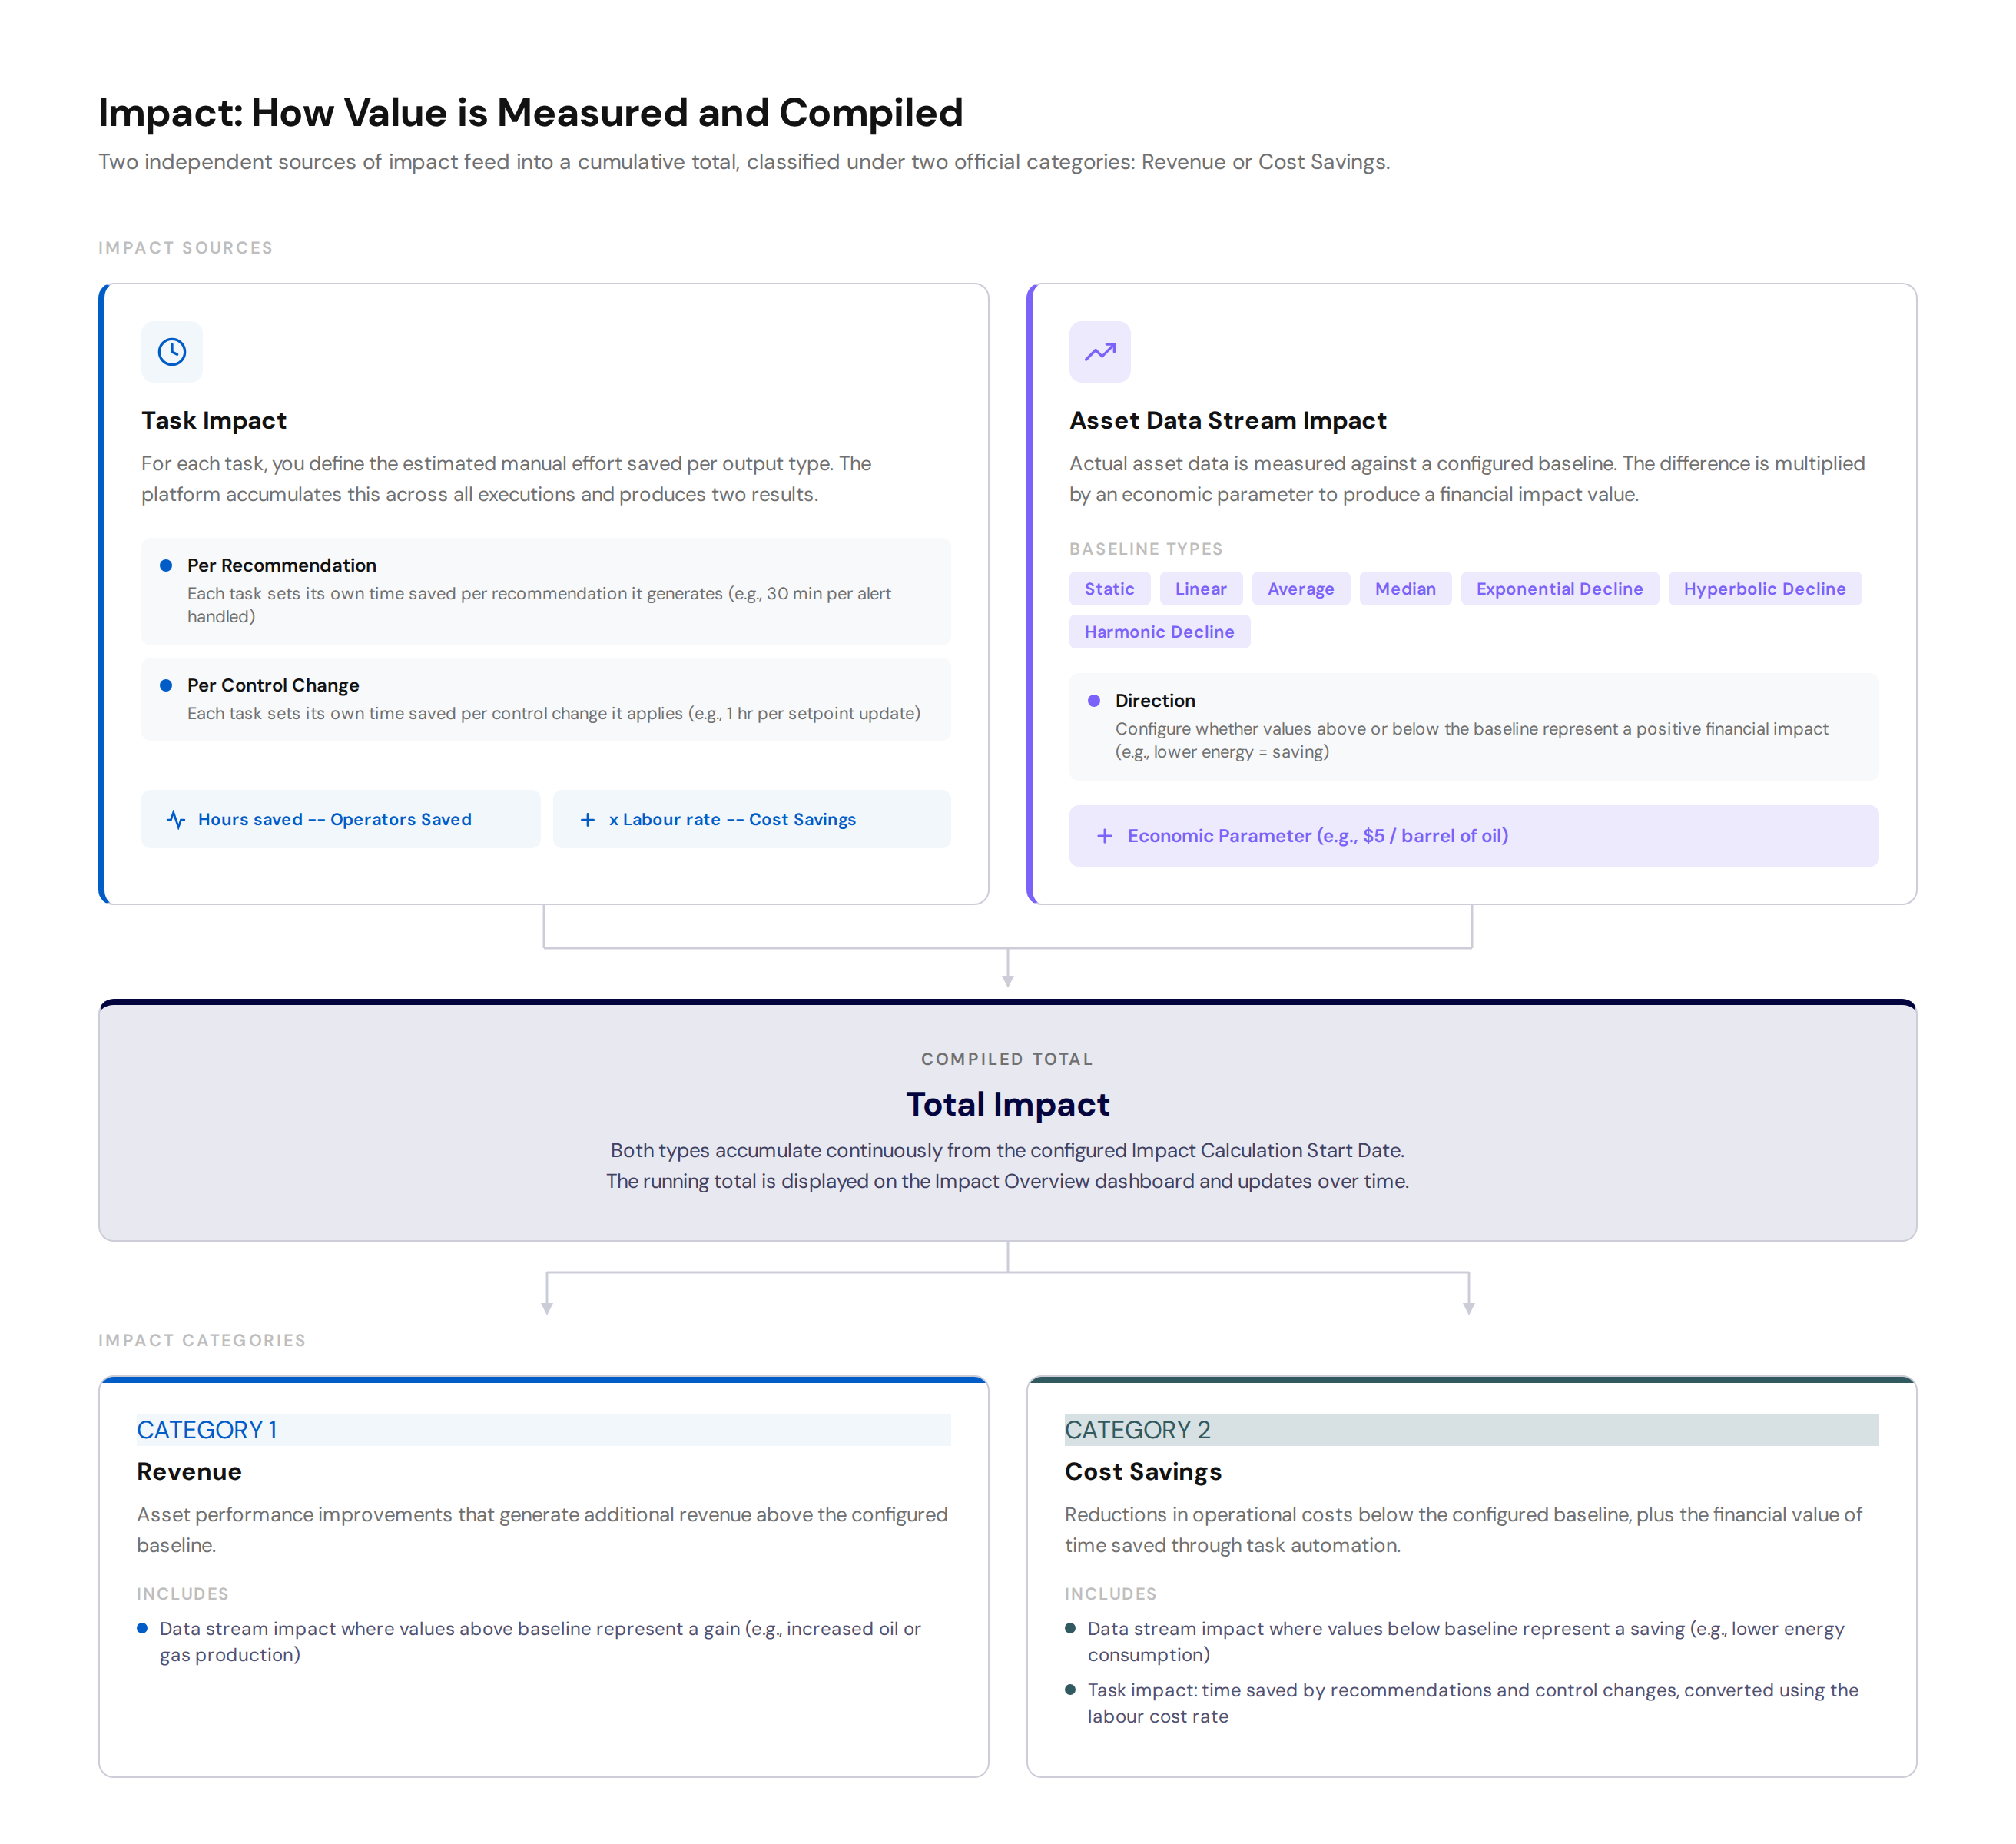
Impact is the part of Kelvin that answers a simple question: how much value is Kelvin actually delivering?
Most automation and monitoring systems can tell you what actions were taken. Impact goes further -- it gives Operations Engineers a clear, financial view of what those actions are worth. Rather than relying on qualitative assessments or manual calculations, the platform tracks and accumulates impact automatically over time.
Why it matters
Without a way to measure value, it is difficult to justify automation decisions, prioritise where to focus operational attention, or demonstrate returns to the wider business.
Impact provides this evidence continuously. It shows, in financial terms, how much Kelvin's tasks, recommendations, and control changes are improving performance compared to what the asset would have done on its own.
Who uses Impact
Impact is used primarily by Operations Engineers and operations managers who need to:
- Track whether automated tasks and recommendations are producing measurable results
- Understand the financial value of deviations from expected asset performance
- Communicate operational improvements to business stakeholders
It does not require any programming or technical knowledge to interpret. Configuration is straightforward and is done through the Kelvin UI.
The two types of Impact
Kelvin measures impact in two distinct ways.
Task Impact
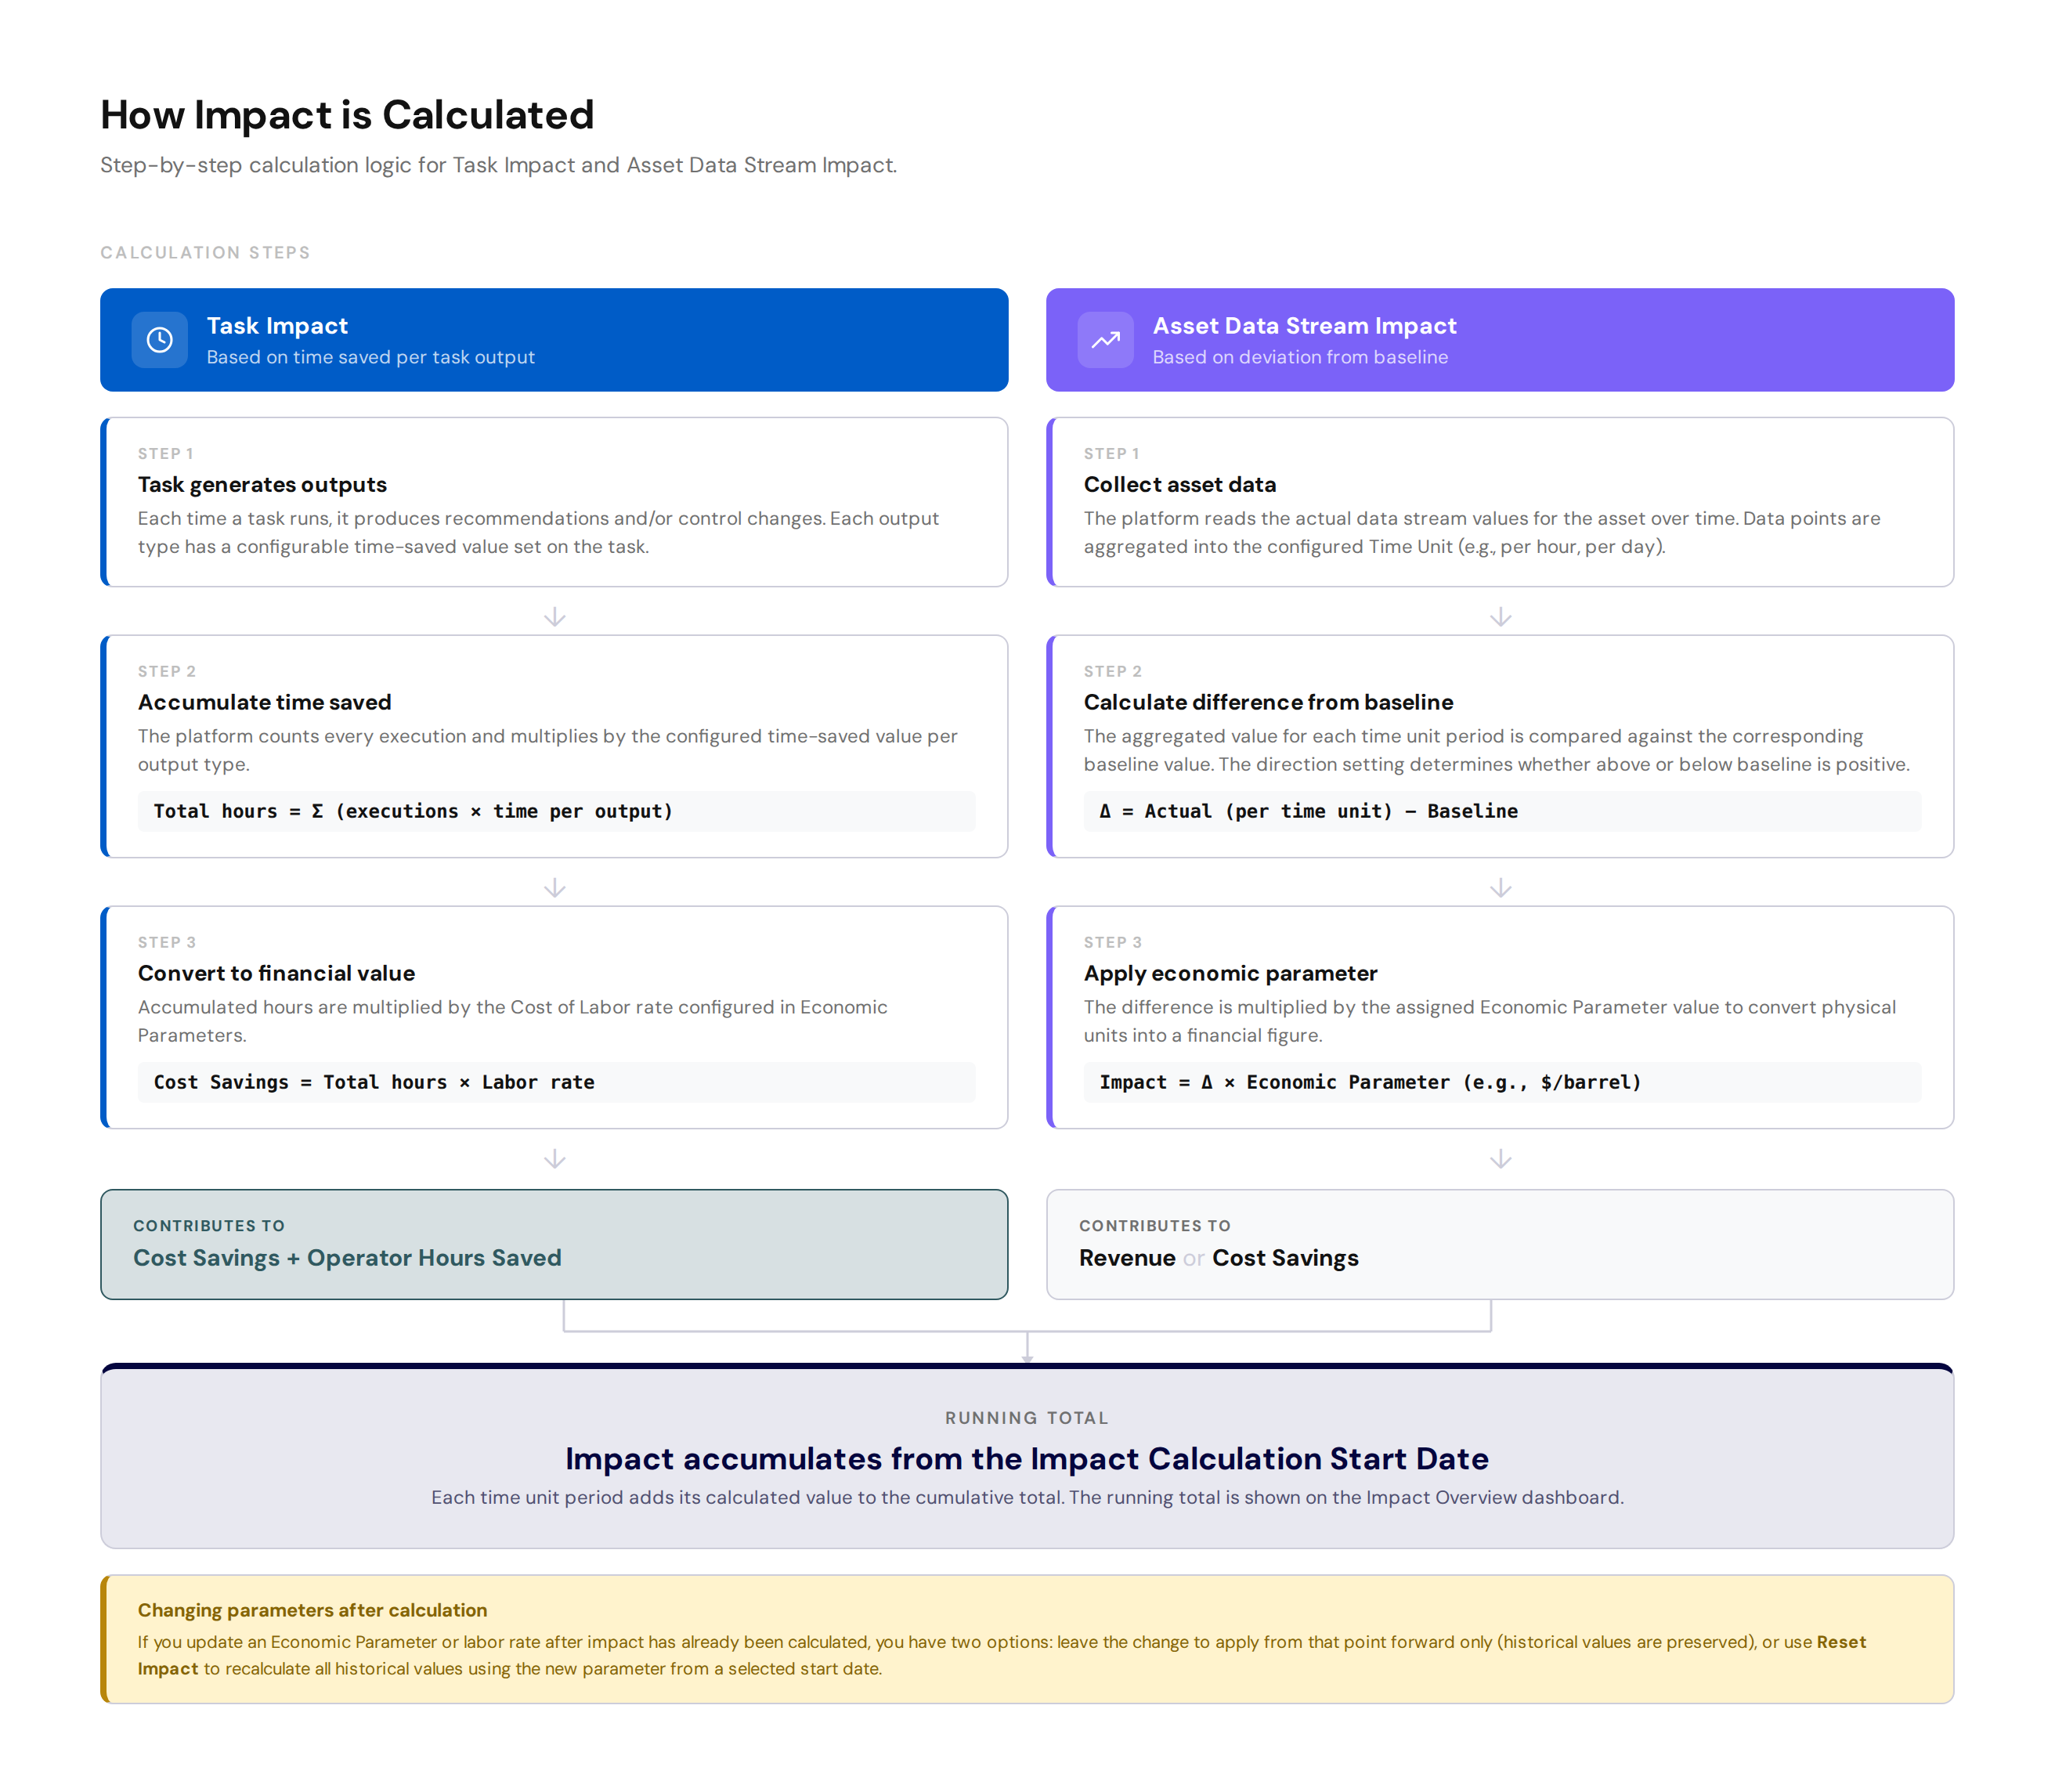
Every task in Kelvin generates recommendations and control changes. For each of these outputs, the task can be configured with an estimated amount of manual effort it saves an Operations Engineer -- for example, 30 minutes per recommendation handled or 1 hour per setpoint update applied.
The platform accumulates these time savings across all executions and converts them into a financial figure using the configured labor cost rate.
This answers: "How much manual Operations work is Kelvin replacing?"
Asset Data Stream Impact
For any asset data stream, it is possible to define a baseline -- the level and trend that stream would be expected to follow under normal conditions, without any intervention from Kelvin. This might be a historical average, a declining production curve, or a constant threshold.
The platform then continuously compares actual asset data against this baseline. The financial value of the difference, calculated using a configurable economic parameter (for example, the price per barrel of oil), is accumulated over time.
This answers: "Is the asset performing better or worse than expected, and what is that worth?"
Impact categories
All impact, regardless of type, is classified into one of two official categories:
- Revenue -- improvements that generate additional income above the baseline (for example, higher production output).
- Cost Savings -- reductions in operational cost below the baseline, plus the financial value of time saved through task automation.
How the numbers are built
Impact values do not appear instantly. The platform accumulates them from a configured Impact Calculation Start Date, which can be set to a past date to capture historical savings or to a current date to start fresh.
The baseline used for data stream calculations is defined separately from this start date. A baseline can cover years of historical data to establish a reliable reference curve, while the actual accumulation of financial impact can begin from any point the user chooses.
When parameters change -- for example, if the price of oil is updated -- the platform can either apply the change going forward only, or use the Reset Impact function to recalculate all historical values from a chosen date.
How it is displayed
The Impact Overview dashboard shows cumulative totals across all assets or a filtered subset. Results can be filtered by asset and grouped by any asset property such as region, county, or manufacturer.
Where to go next
- Impact Overview -- full documentation of the Impact dashboard and configuration.
- Economic Parameters -- configure labor rates and impact unit values.
- Create Impact Metric -- step-by-step guide to setting up a baseline for an asset data stream.
- Task Impact Metrics -- configure the time saved per task output.