Create Impact Metric
On this page you will learn how to create an Impact Metric to start tracking Revenue or Cost Savings for an asset data stream.
Before You Start
Warning
Make sure you have configured your Economic Parameters before creating Impact Metrics. The economic parameters you set -- cost of labor rate and impact unit values -- are referenced directly in this flow to calculate the financial impact of each data stream.
Step 1 -- Open Impact Metrics
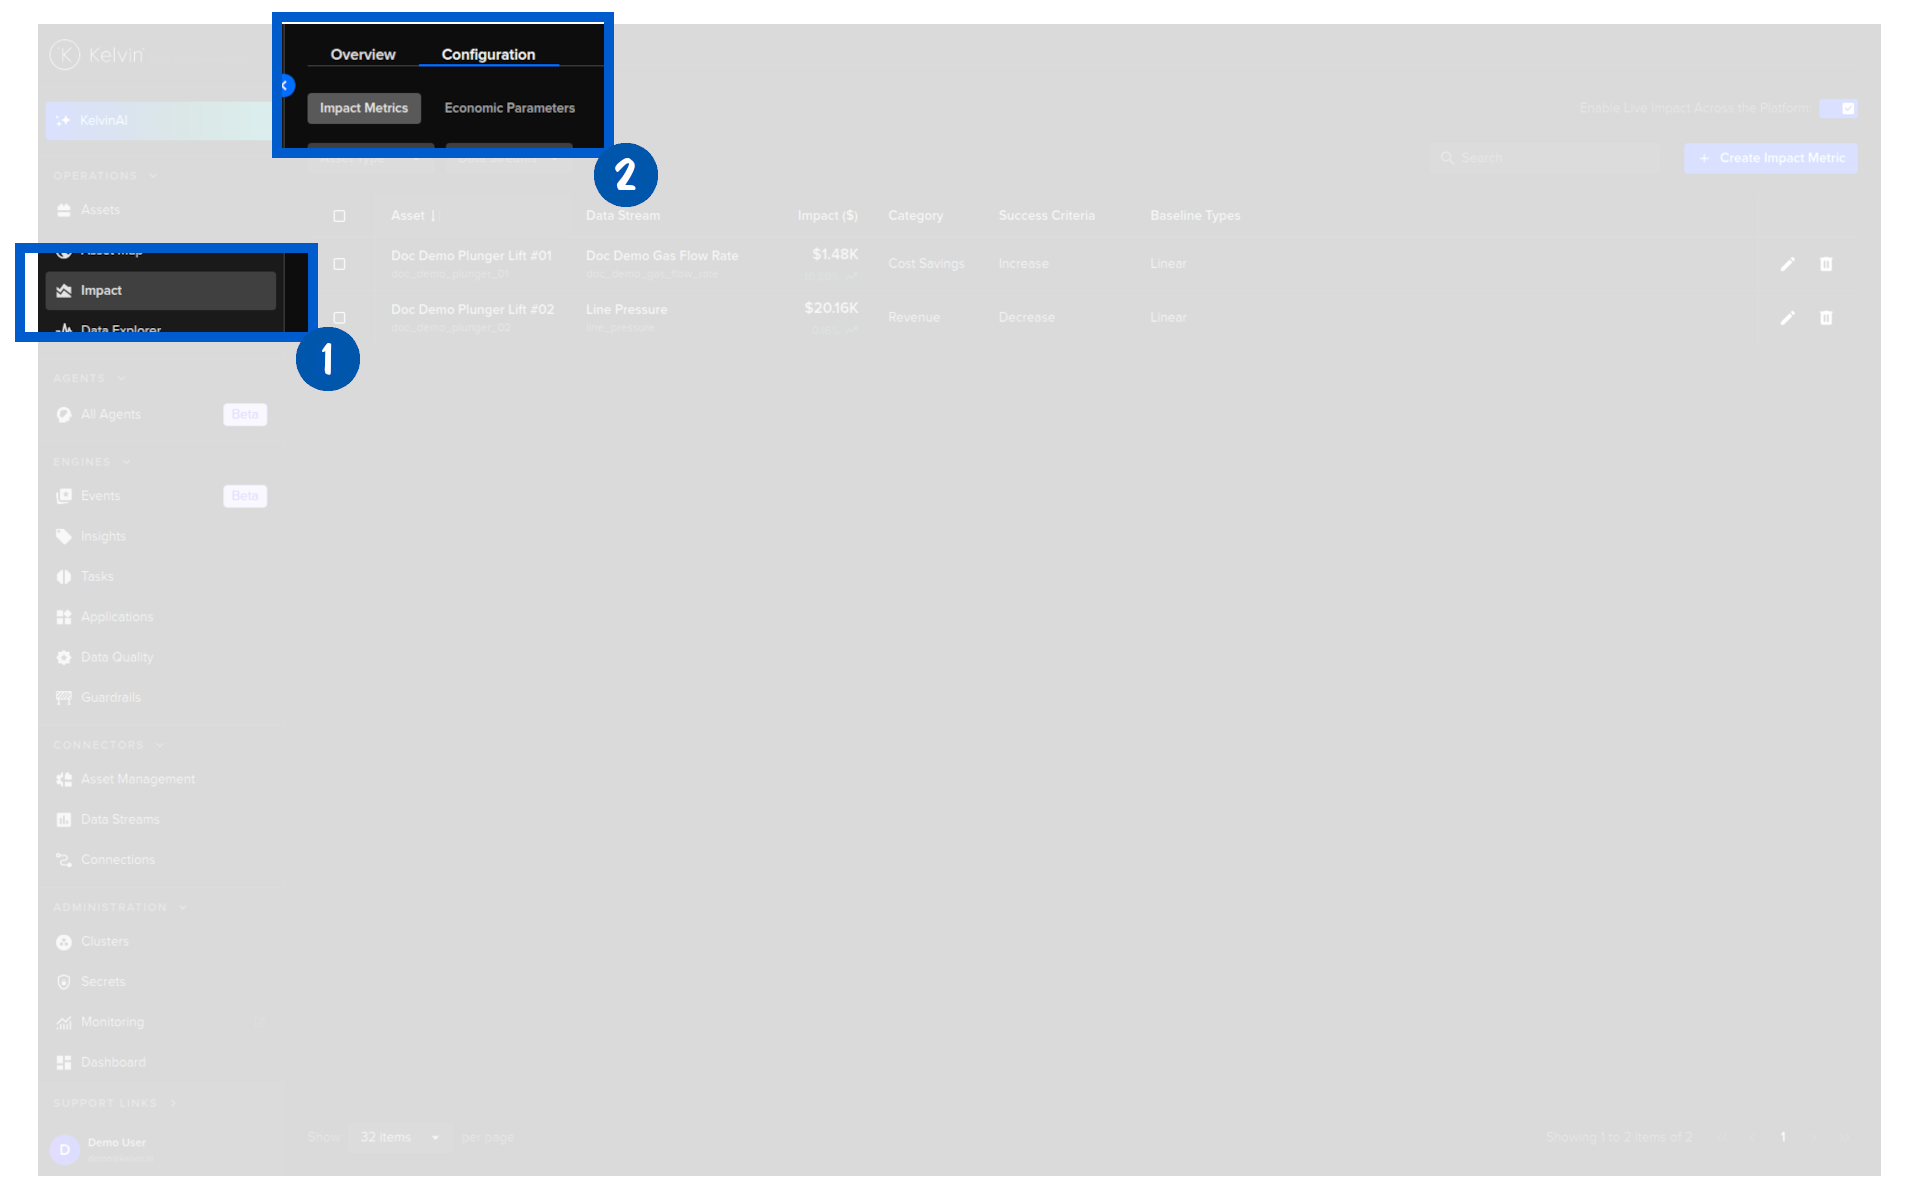
Go to Impact in the left navigation, then click the Configuration tab, then select the Impact Metrics sub-tab.
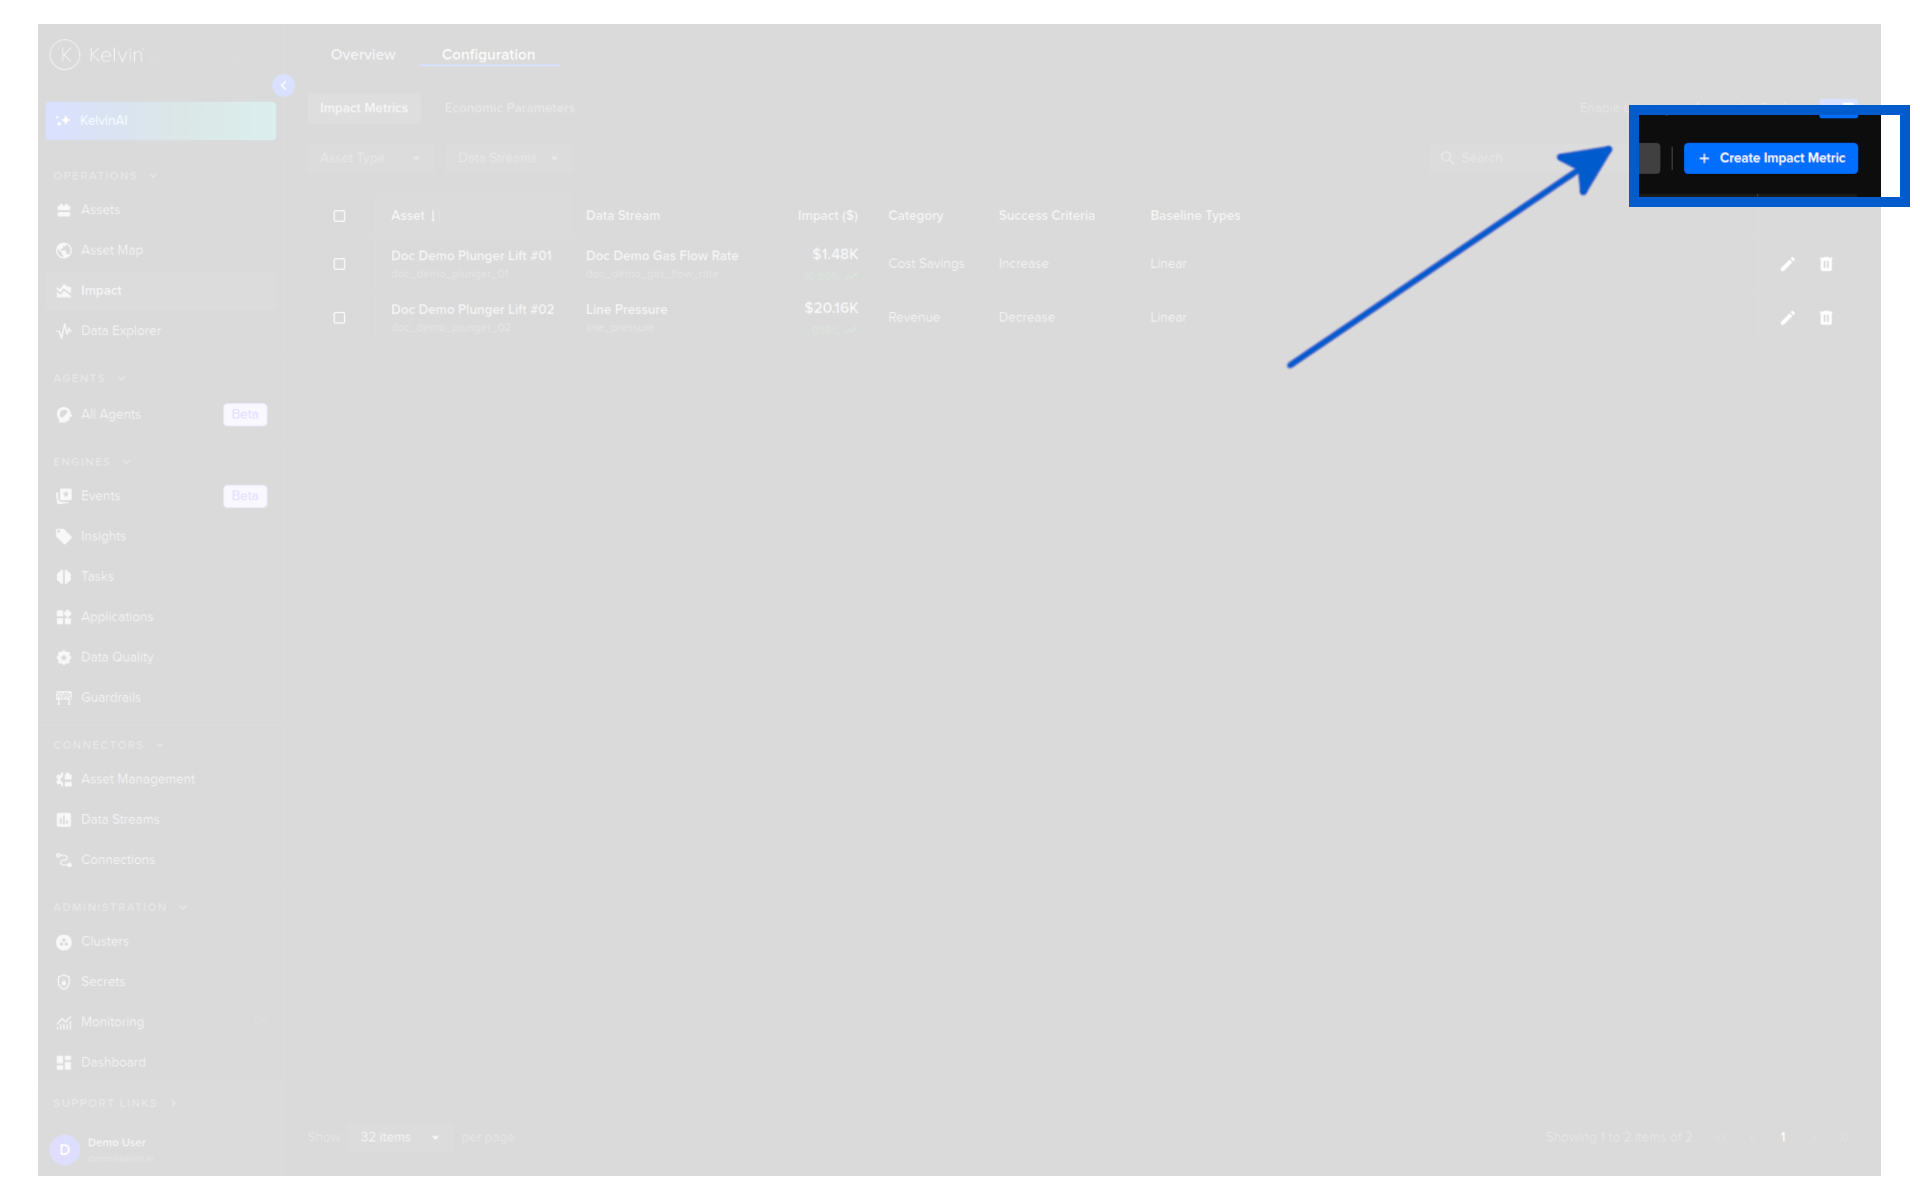
Click the Create Impact Metric button.
Step 2 -- Select Assets
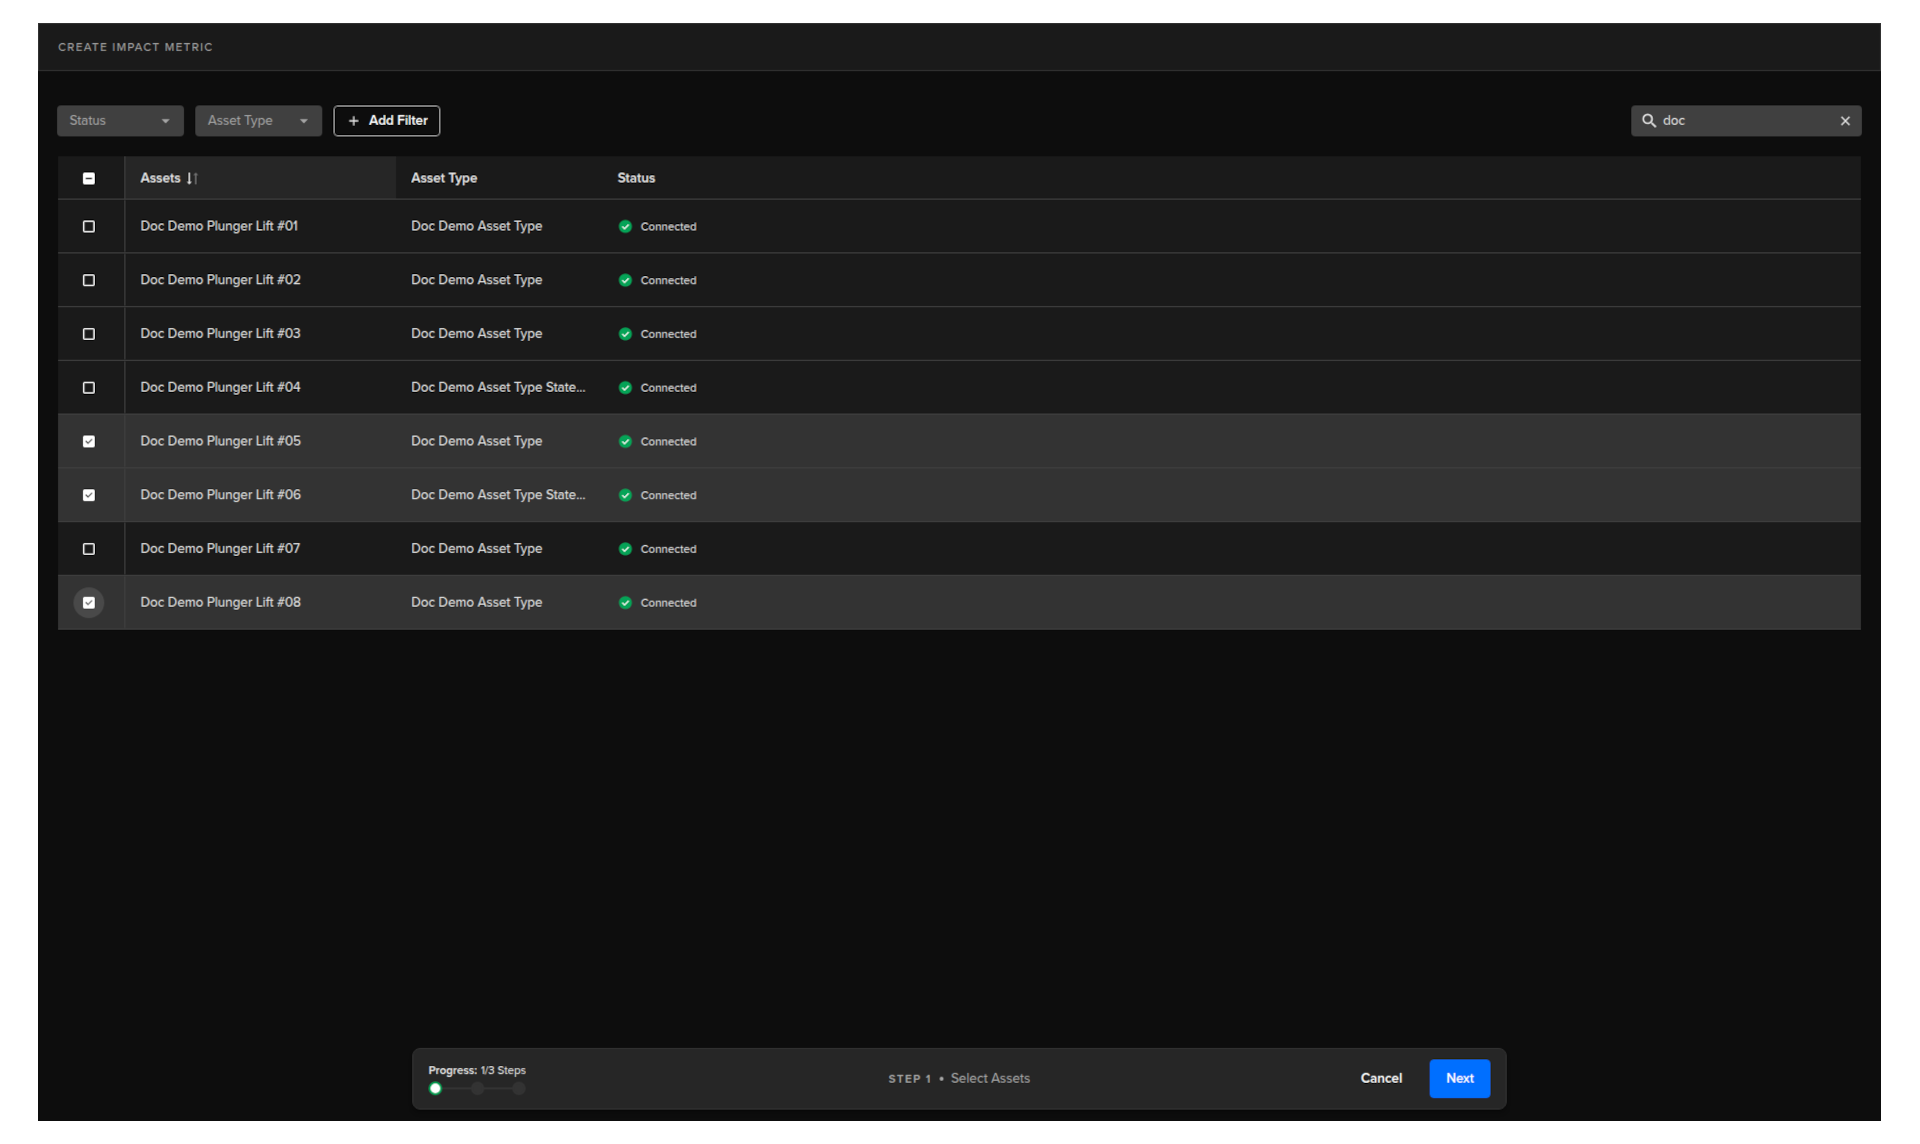
Select the assets this Impact Metric will apply to. You can select one asset or multiple assets at once.
Warning
Select all relevant assets now. You cannot add more assets to an Impact Metric after it has been created.
Once you have selected your assets, click Next.
Step 3 -- Choose Configuration Mode
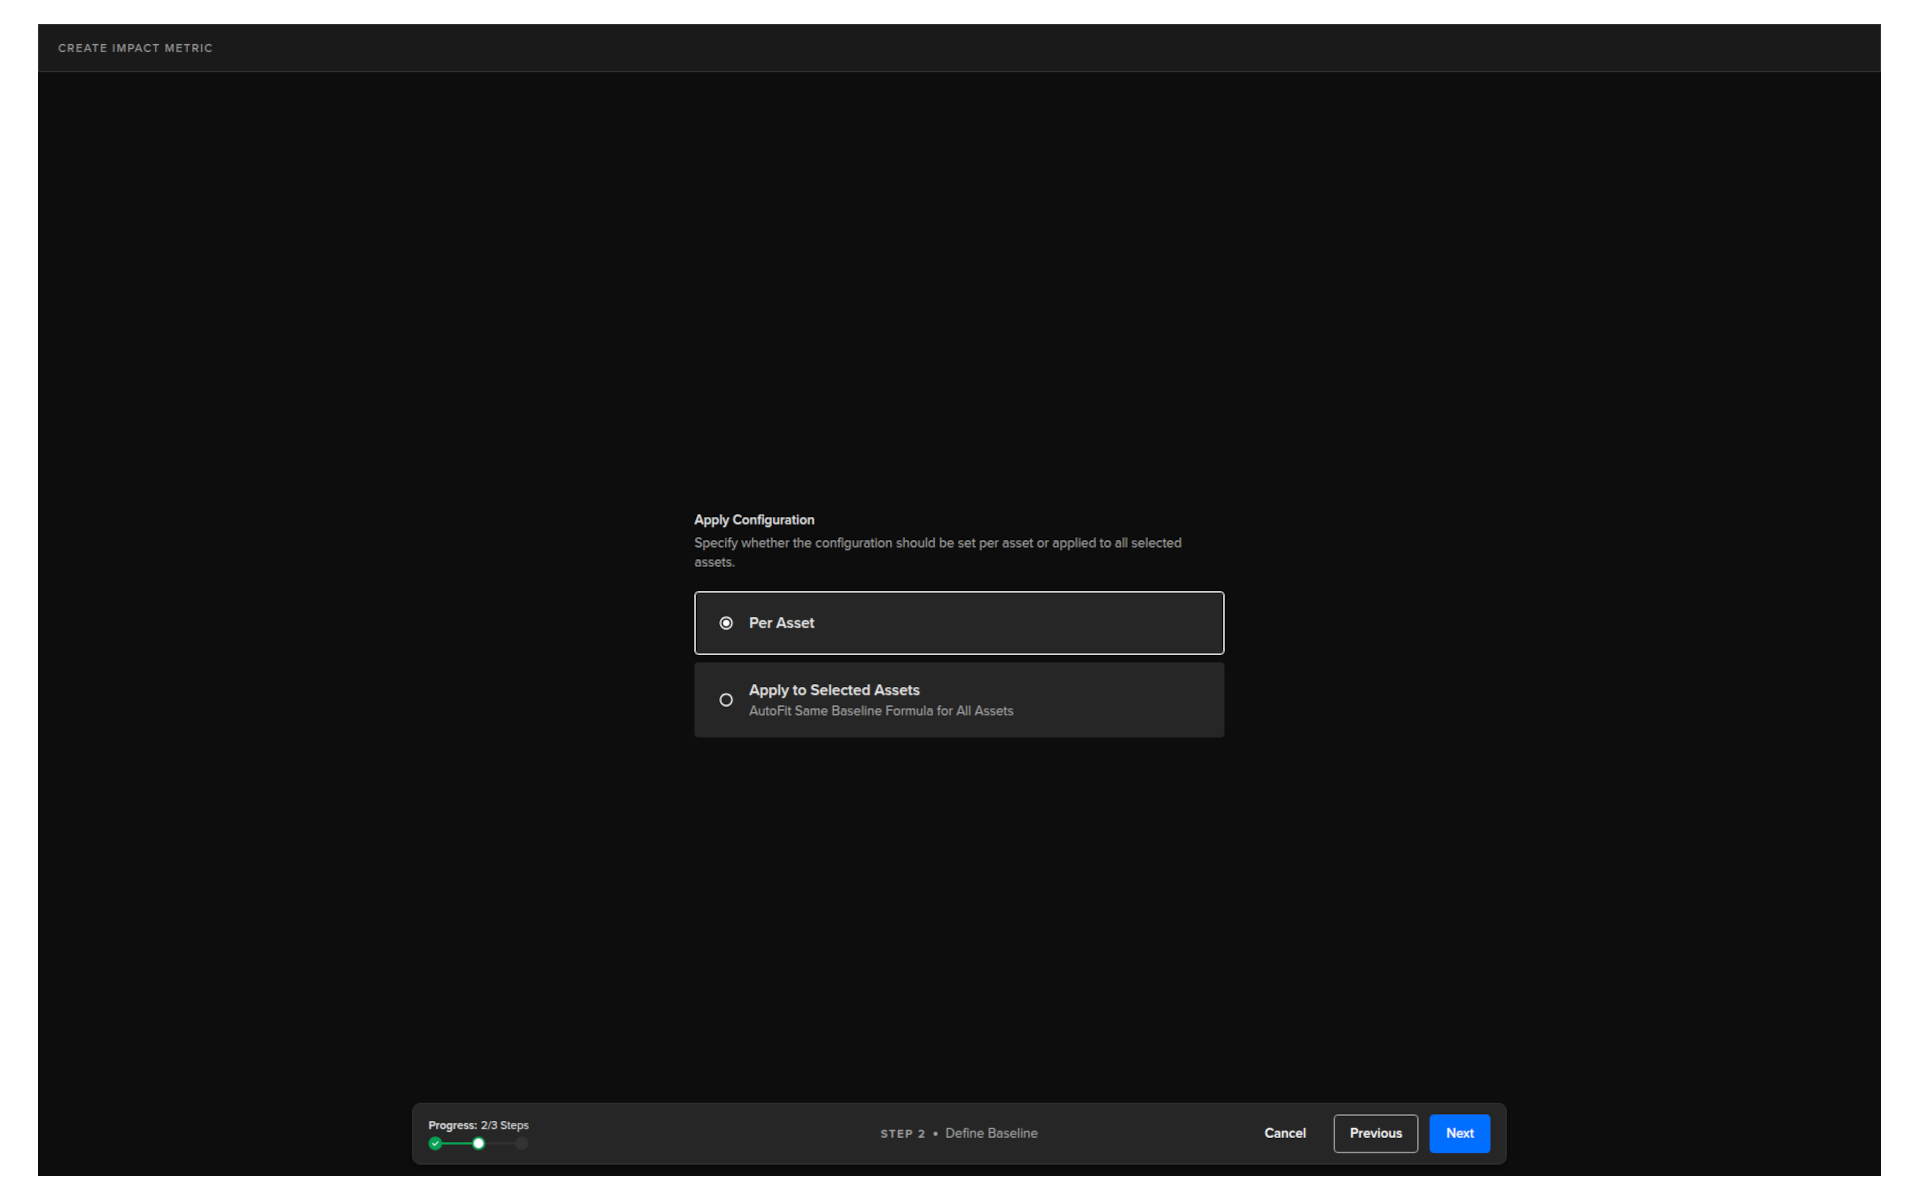
Choose how you want to apply the configuration across the selected assets.
| Option | What it does |
|---|---|
| Per Asset | Configure data streams individually for each asset. Use this when different assets need different baseline values. |
| Apply to Selected Assets | Configure data streams once and apply the same settings to all selected assets as a group. |
The configuration steps are the same for both modes. The examples below show the Apply to Selected Assets flow.
Step 4 -- Configure Data Streams
You will see a list of the data streams associated with the selected assets.
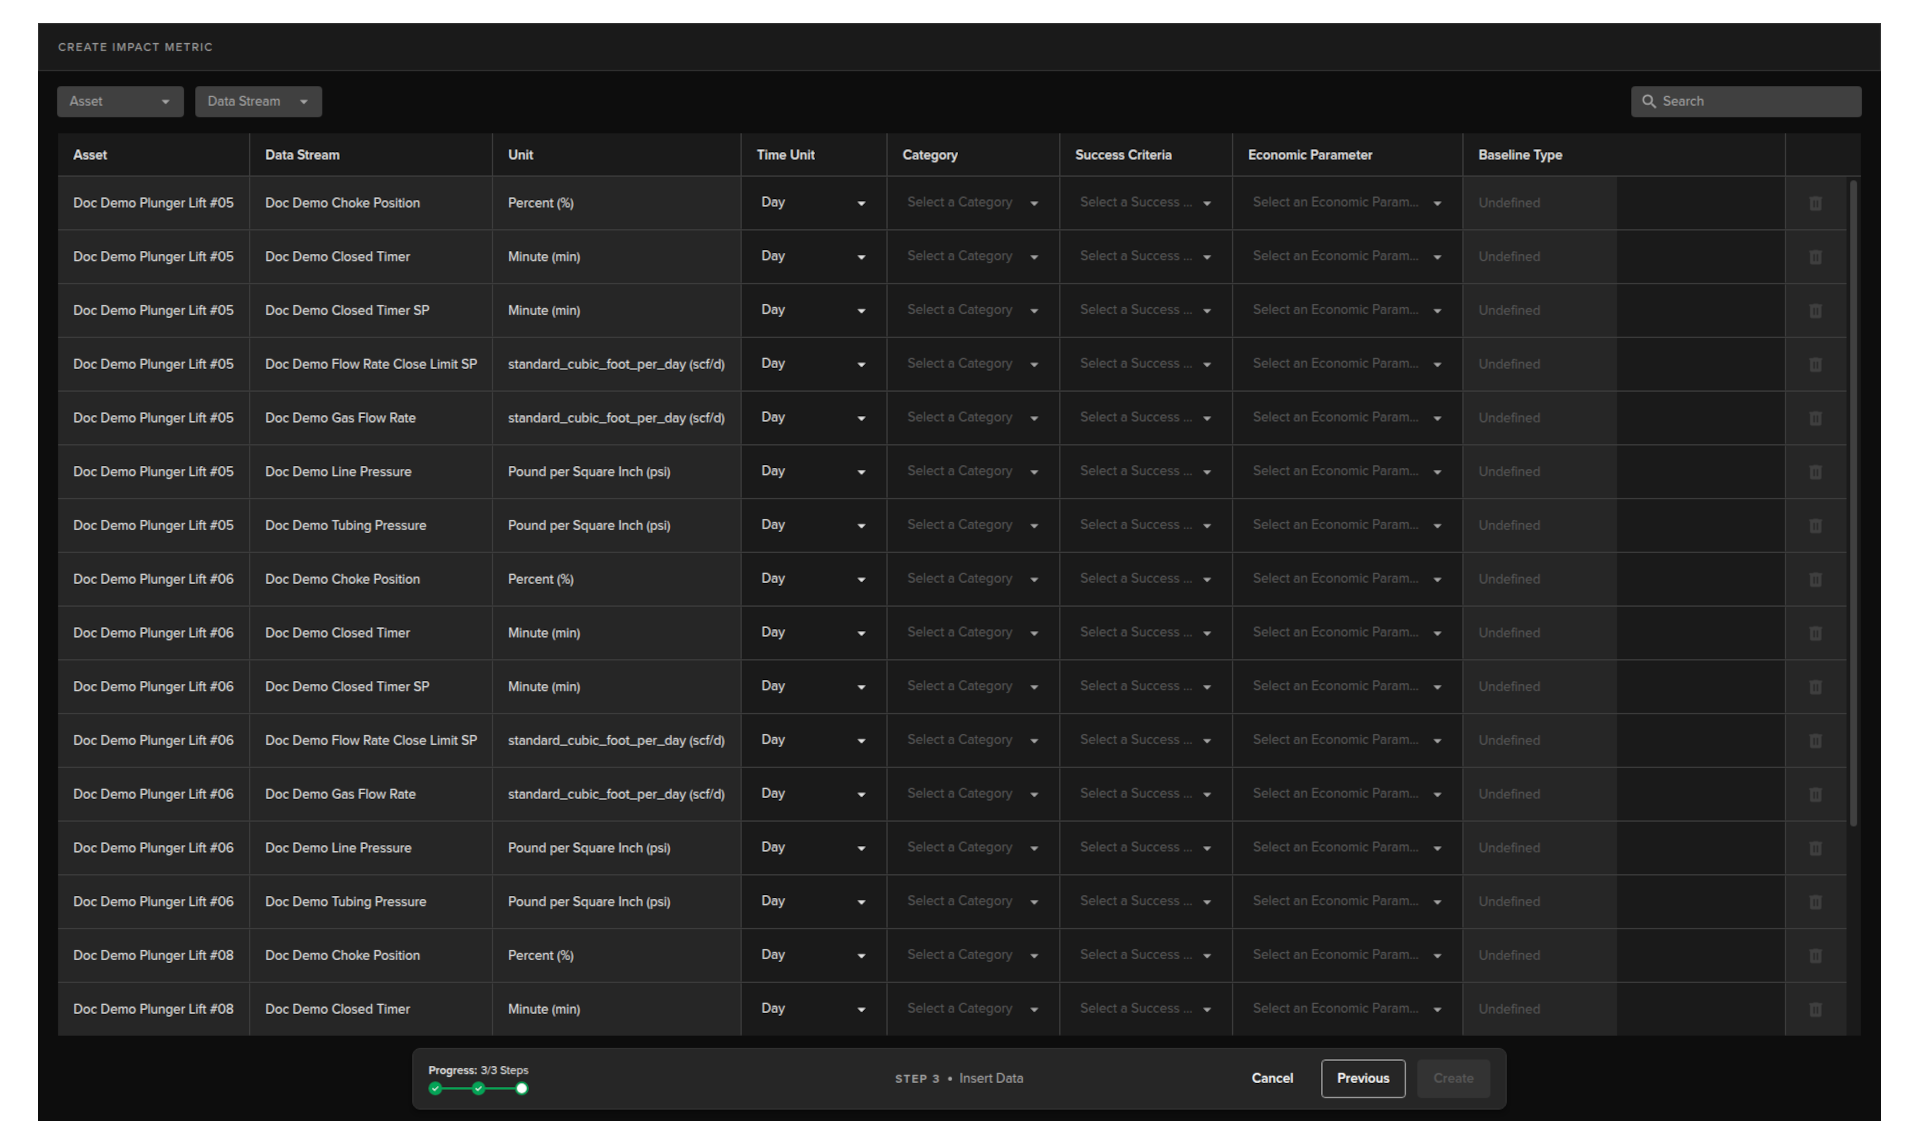
If you selected per asset, then you will be abe to setup each Asset / Data Stream individually.
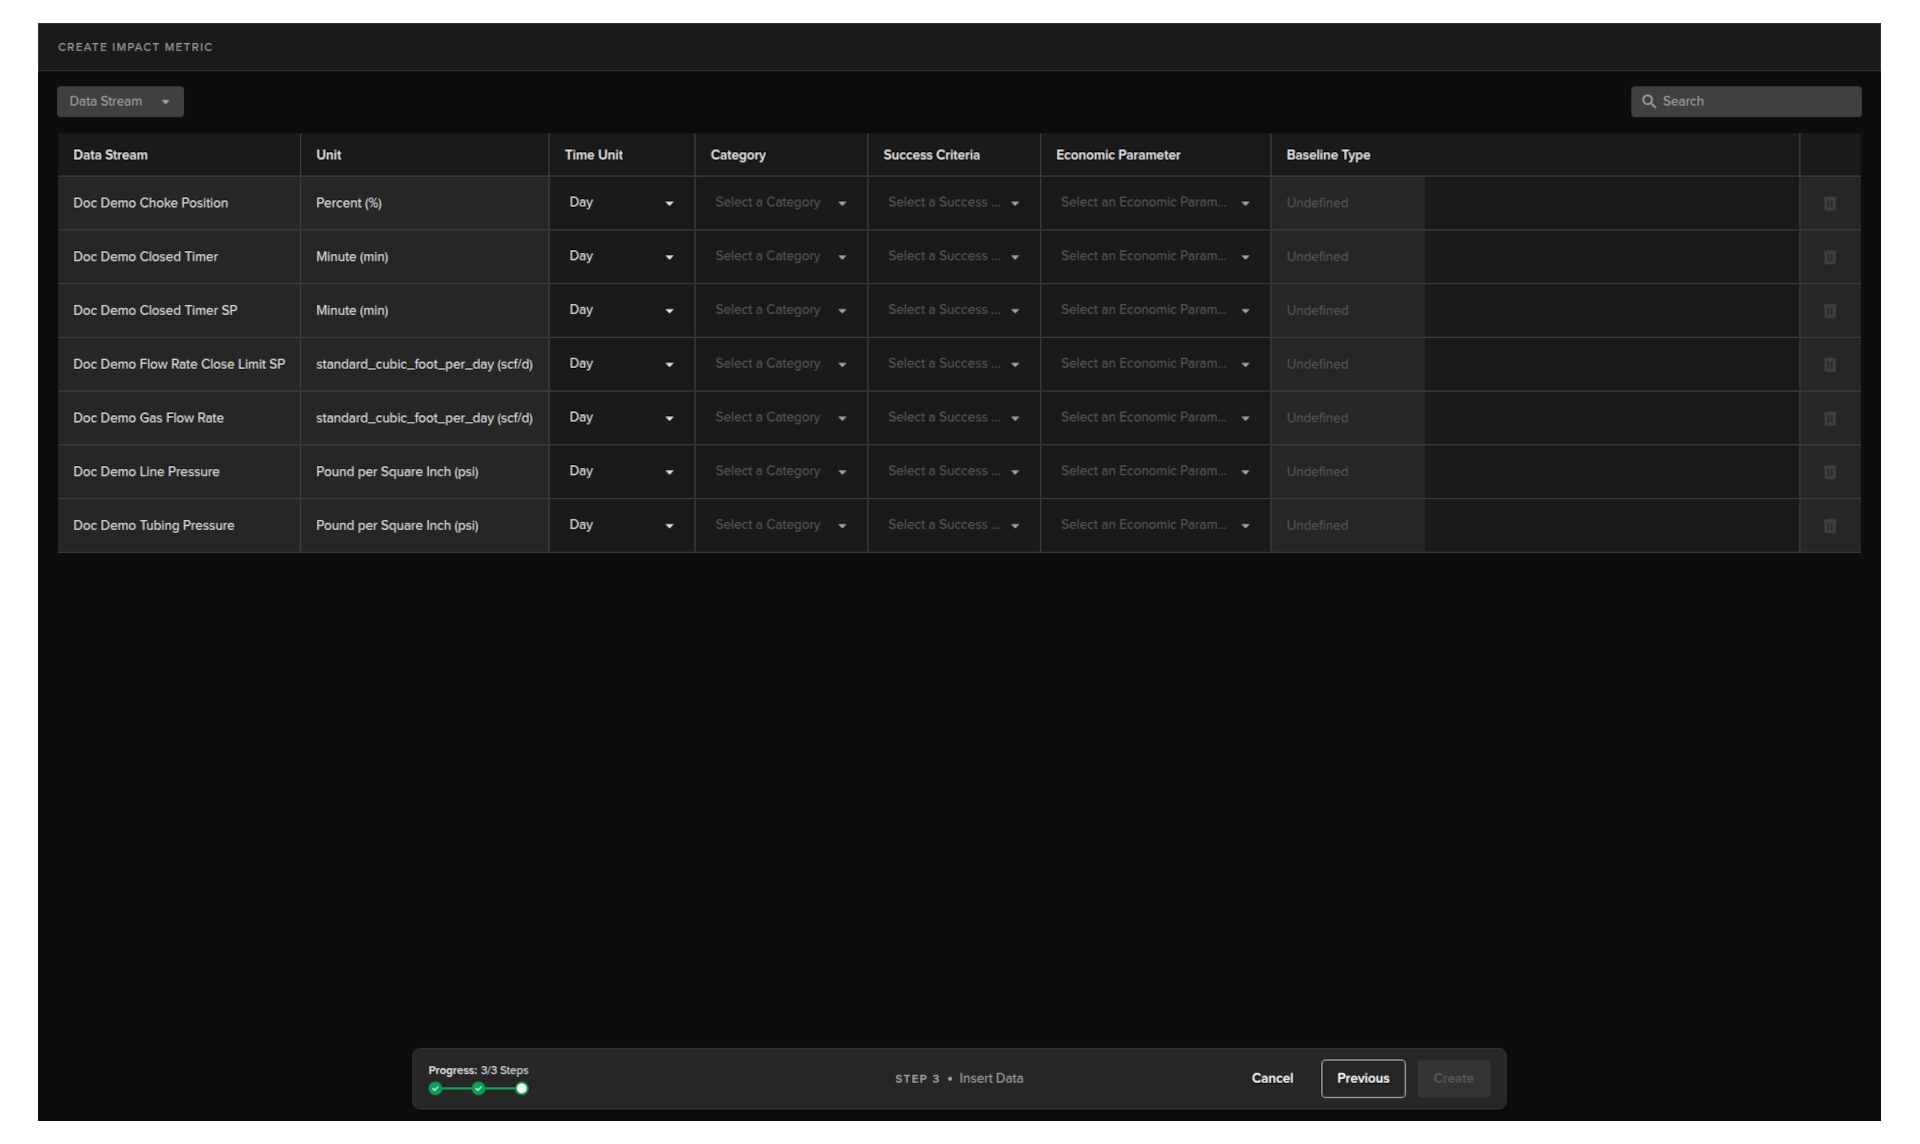
If you selected Apply to Selected Assets, then you will see a list of common Data Streams for the selected Assets.
Note
You only need to configure the data streams that will produce a quantifiable value in Revenue or Cost Savings. You can leave other data streams unconfigured.
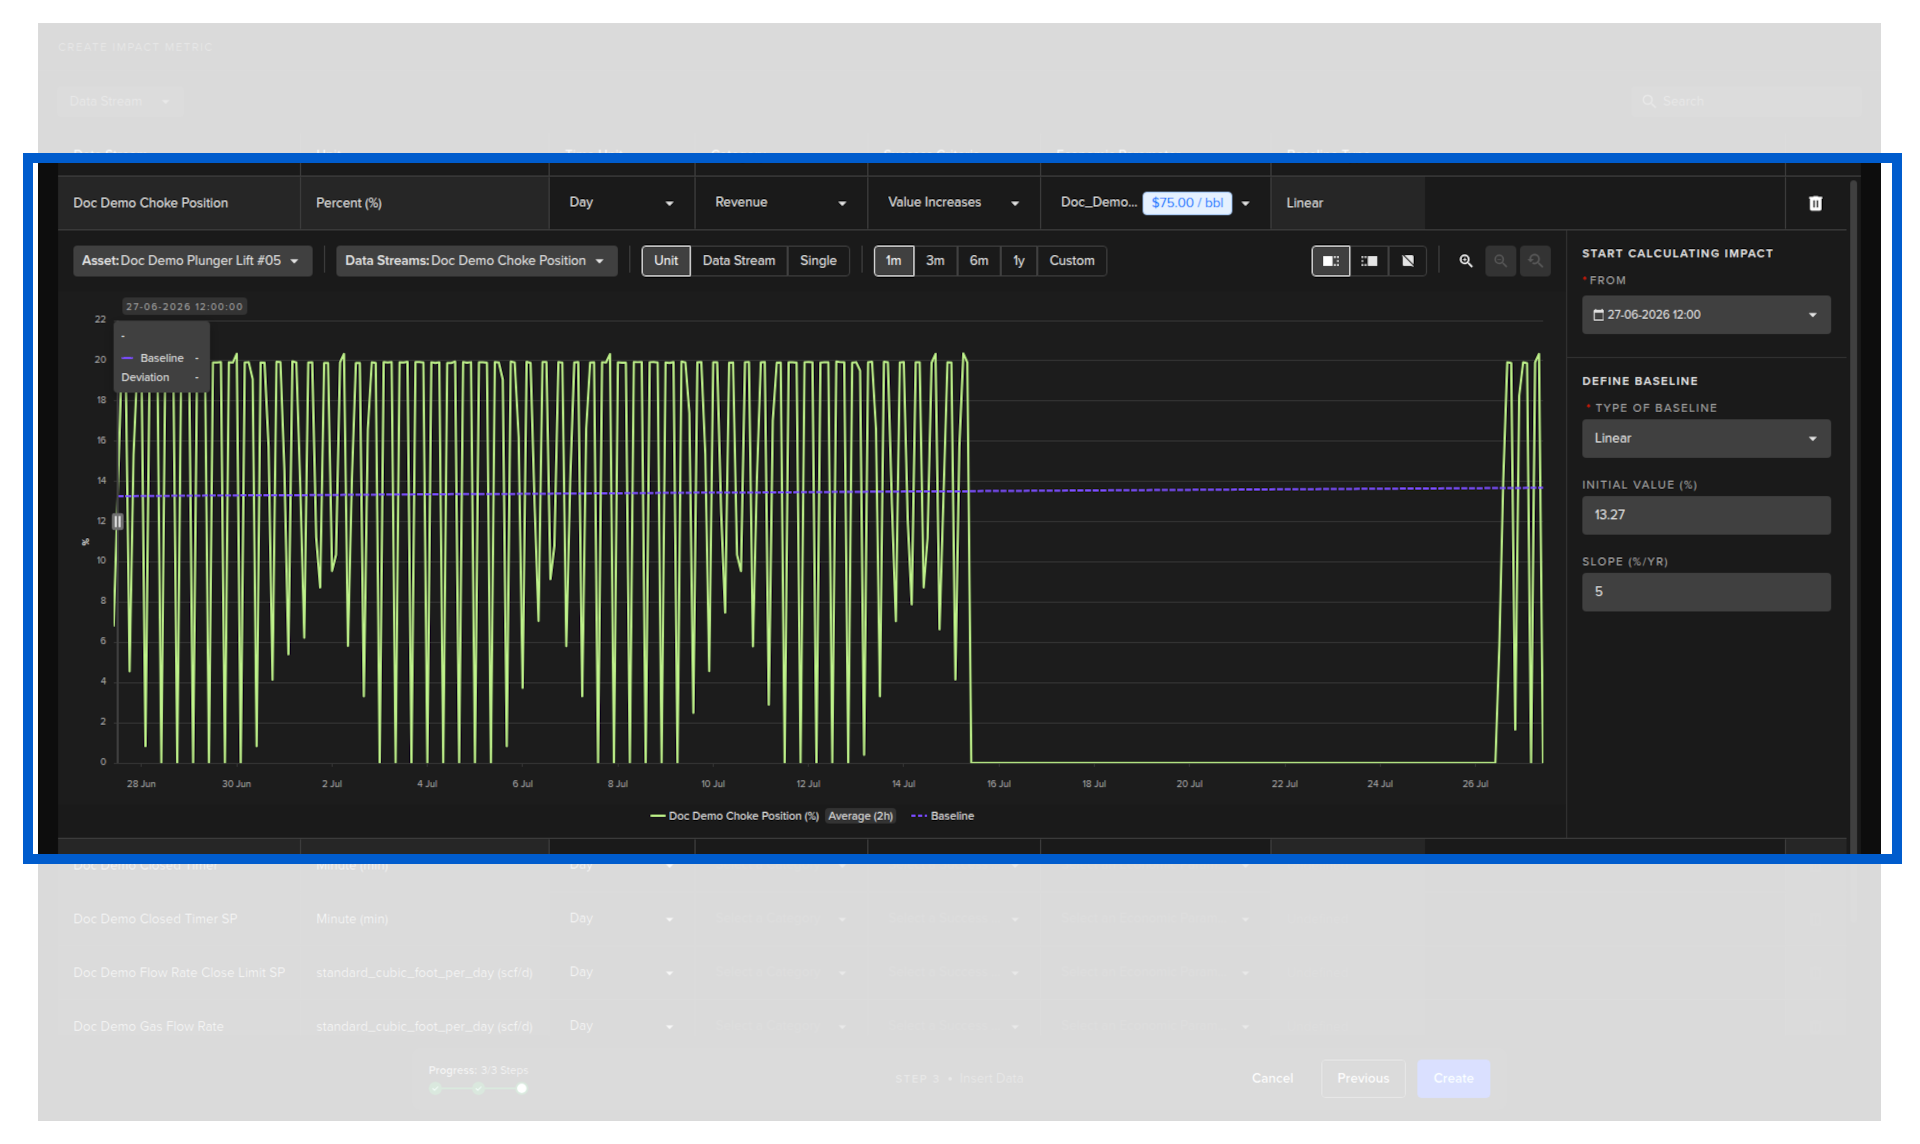
For each data stream you want to track, edit the inline fields on that row. As soon as you begin editing a data stream, an inline data explorer appears below it showing the current historical values for the selected asset or assets. This helps you visualise the data and choose appropriate baseline settings.
Editable Columns
| Field | Options | Description |
|---|---|---|
| Time Unit | Second, Minute, Hour, Day | The time period used to aggregate data points before calculating the difference against the baseline. Required because assets may produce data at variable rates -- for example, one asset might send a value every 30 seconds while another sends one per minute. Selecting the correct time unit ensures the comparison is consistent. |
| Category | Revenue, Cost Savings | Whether this data stream contributes to Revenue or Cost Savings on the Impact dashboard. |
| Success Criteria | Value Increases, Value Decreases | The direction that represents a positive impact: Value Increases (above baseline is good, e.g., higher production) or Value Decreases (below baseline is good, e.g., lower energy use). |
| Economic Parameter | List from Economic Parameters | The Impact Unit from Economic Parameters used to convert the data stream difference into a financial figure. For example, selecting a crude oil unit of $5 / barrel means each barrel above or below the baseline is worth $5 in the calculation. |
| Baseline | Drag icon on the graph | The start of the baseline period defaults to the start of the graph time period shown in the inline data explorer. It can be fine-tuned directly on the graph using the drag icon on the left edge. See Define Baseline below for full details. |
Start Calculating Impact
Info
This is separate from the Baseline Starting Point above.
The baseline defines what the data stream is expected to do -- it is the reference curve. The impact calculation start date is when the platform begins counting the financial difference between the baseline and actual data.
You can define a baseline that goes back years while only starting to accumulate impact from today. The baseline still shapes the curve; it just does not add historical values to your impact total unless you choose to.
In the inline section you can set when impact calculations should begin.
- From now -- the platform starts accumulating impact from today. Historical data is used to build the baseline curve but does not contribute to the impact total.
- From a past date -- backdates the accumulation start. The platform calculates impact from that date using the baseline and economic parameter you have defined, adding those historical values to your total.
Define Baseline
The baseline represents the expected natural progression of the data stream if no recommendations or control changes were applied. Accurately defining this baseline is what makes the impact calculation meaningful -- it is the reference against which the actual improvement or saving is measured.
Think of it as answering the question: "What would this asset have done on its own, without Kelvin acting on it?" Any difference between that expected behavior and what actually happened is the impact.
Starting Point
The starting point of the baseline is the date from which the baseline curve is anchored. By default, this is set to the beginning of the time period shown in the inline graph.
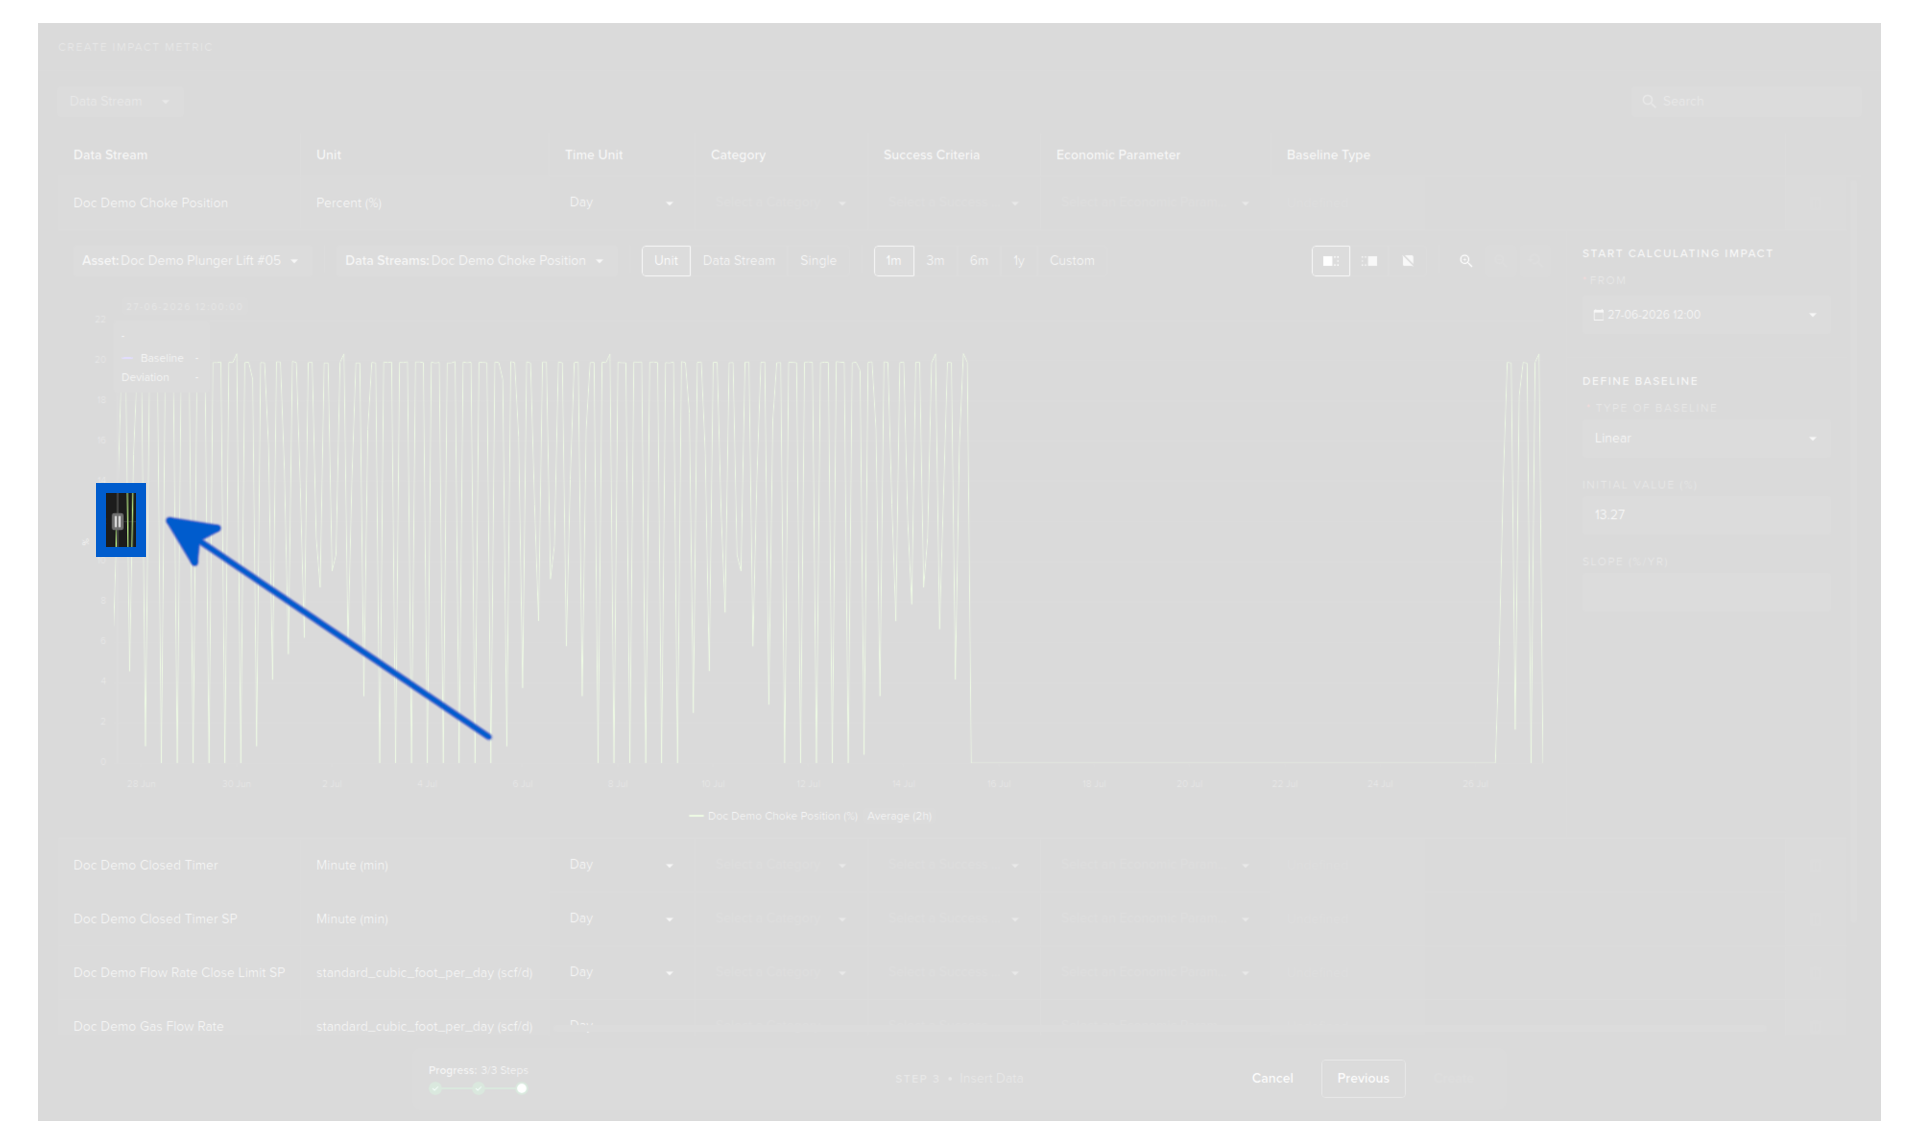
You can fine-tune the starting point directly on the graph by dragging the start icon to the desired position on the time axis. Moving it to the right narrows the baseline to a more recent period; moving it to the left extends it further back in history.
Note
Choosing the right starting point matters. A starting point that is too recent may not capture enough historical data to build a reliable baseline. A starting point that is too far back may include periods where operating conditions were very different. Aim for a period that is representative of normal operating behavior for that asset.
Progression Parameters
Progression parameters define the shape and direction of the baseline curve over time.
| Setting | Description |
|---|---|
| Baseline Type | The shape of the expected curve: Linear, Average, Median, Exponential Decline, Hyperbolic Decline, or Harmonic Decline. |
| Initial Value | The starting value of the baseline curve at the baseline start date. |
| Slope (unit per Yr) | How much the baseline value is expected to change per year. Used for linear and decline curve types. A negative slope models a declining trend (for example, natural production decline on a well). |
Step 5 -- Create
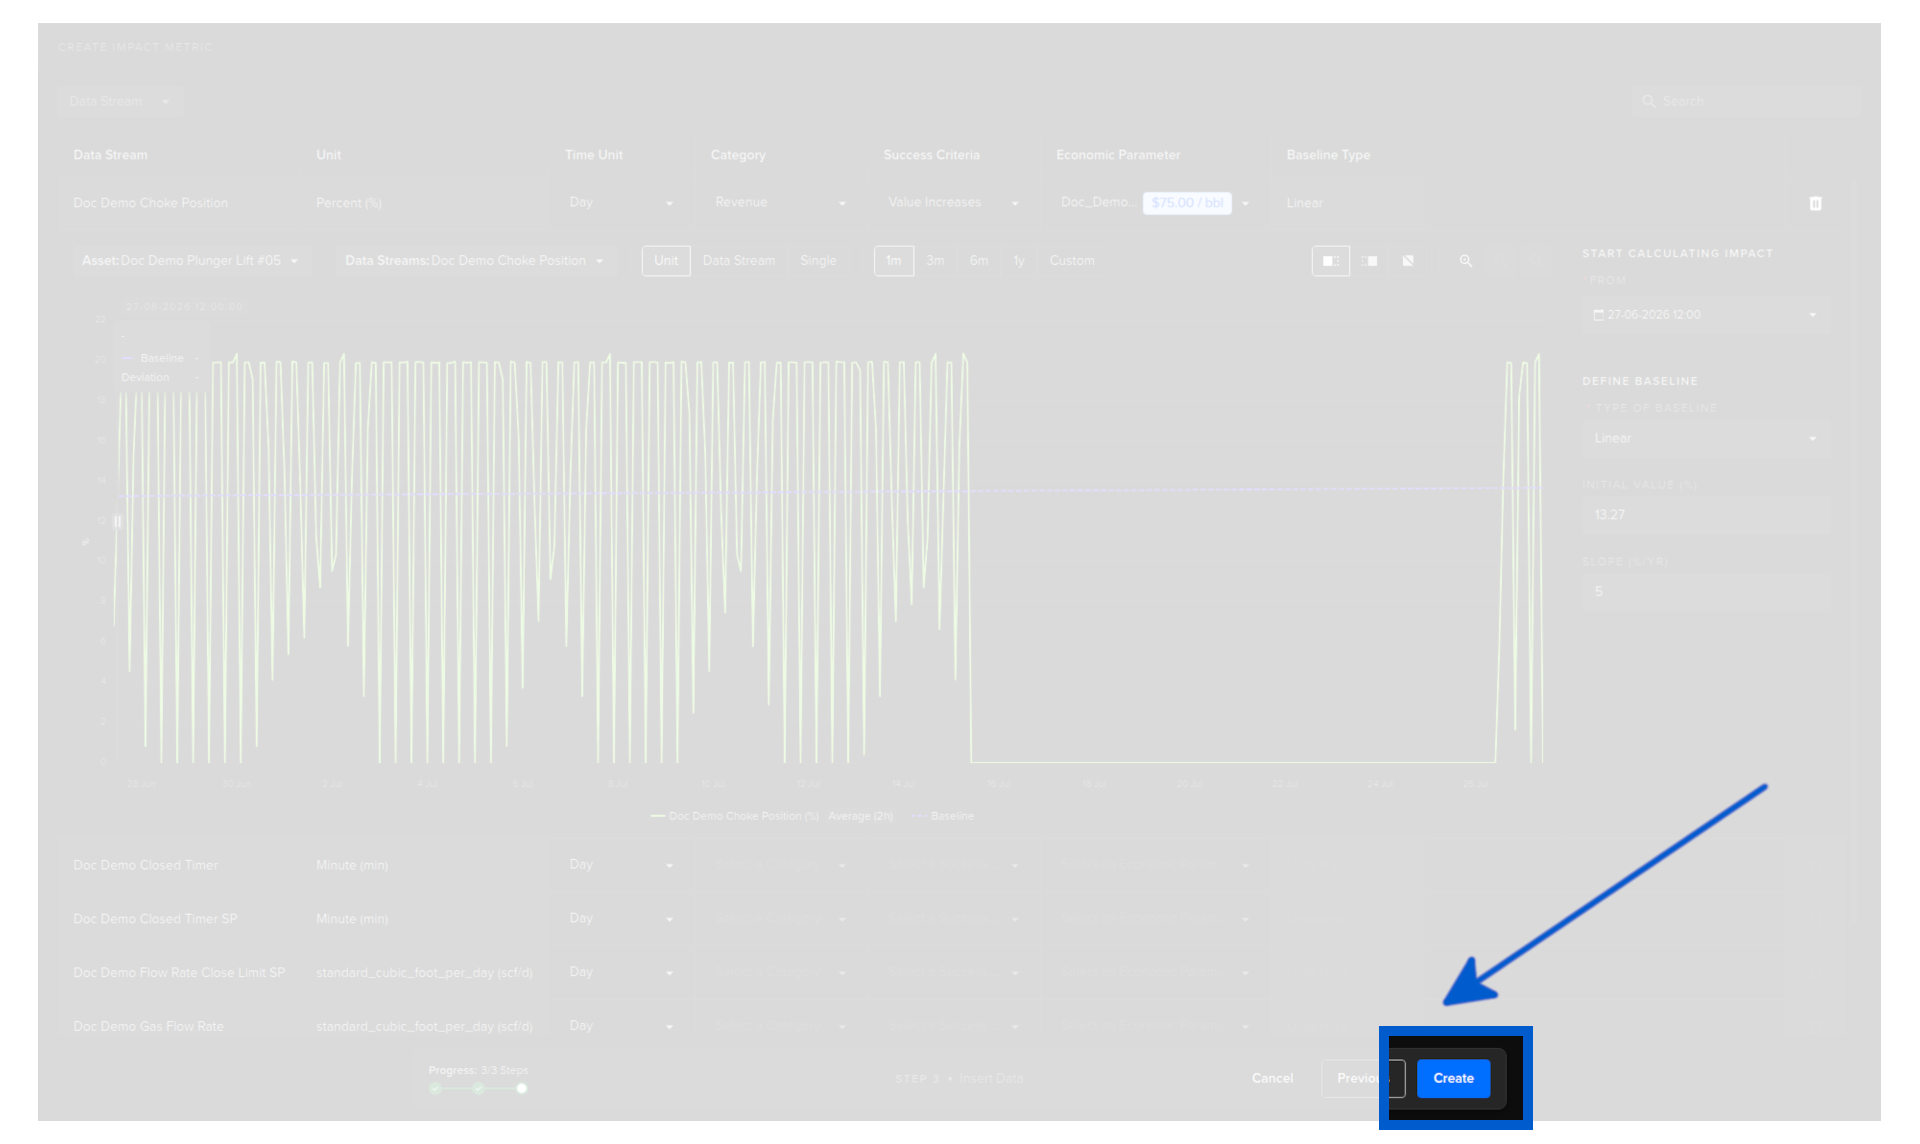
Once you have configured all the data streams you want to track, click Create.
Note
It may take a short time before savings appear in the Impact list or Overview dashboard. Click Refresh and the values should populate shortly after creation.