Impact
What is Impact
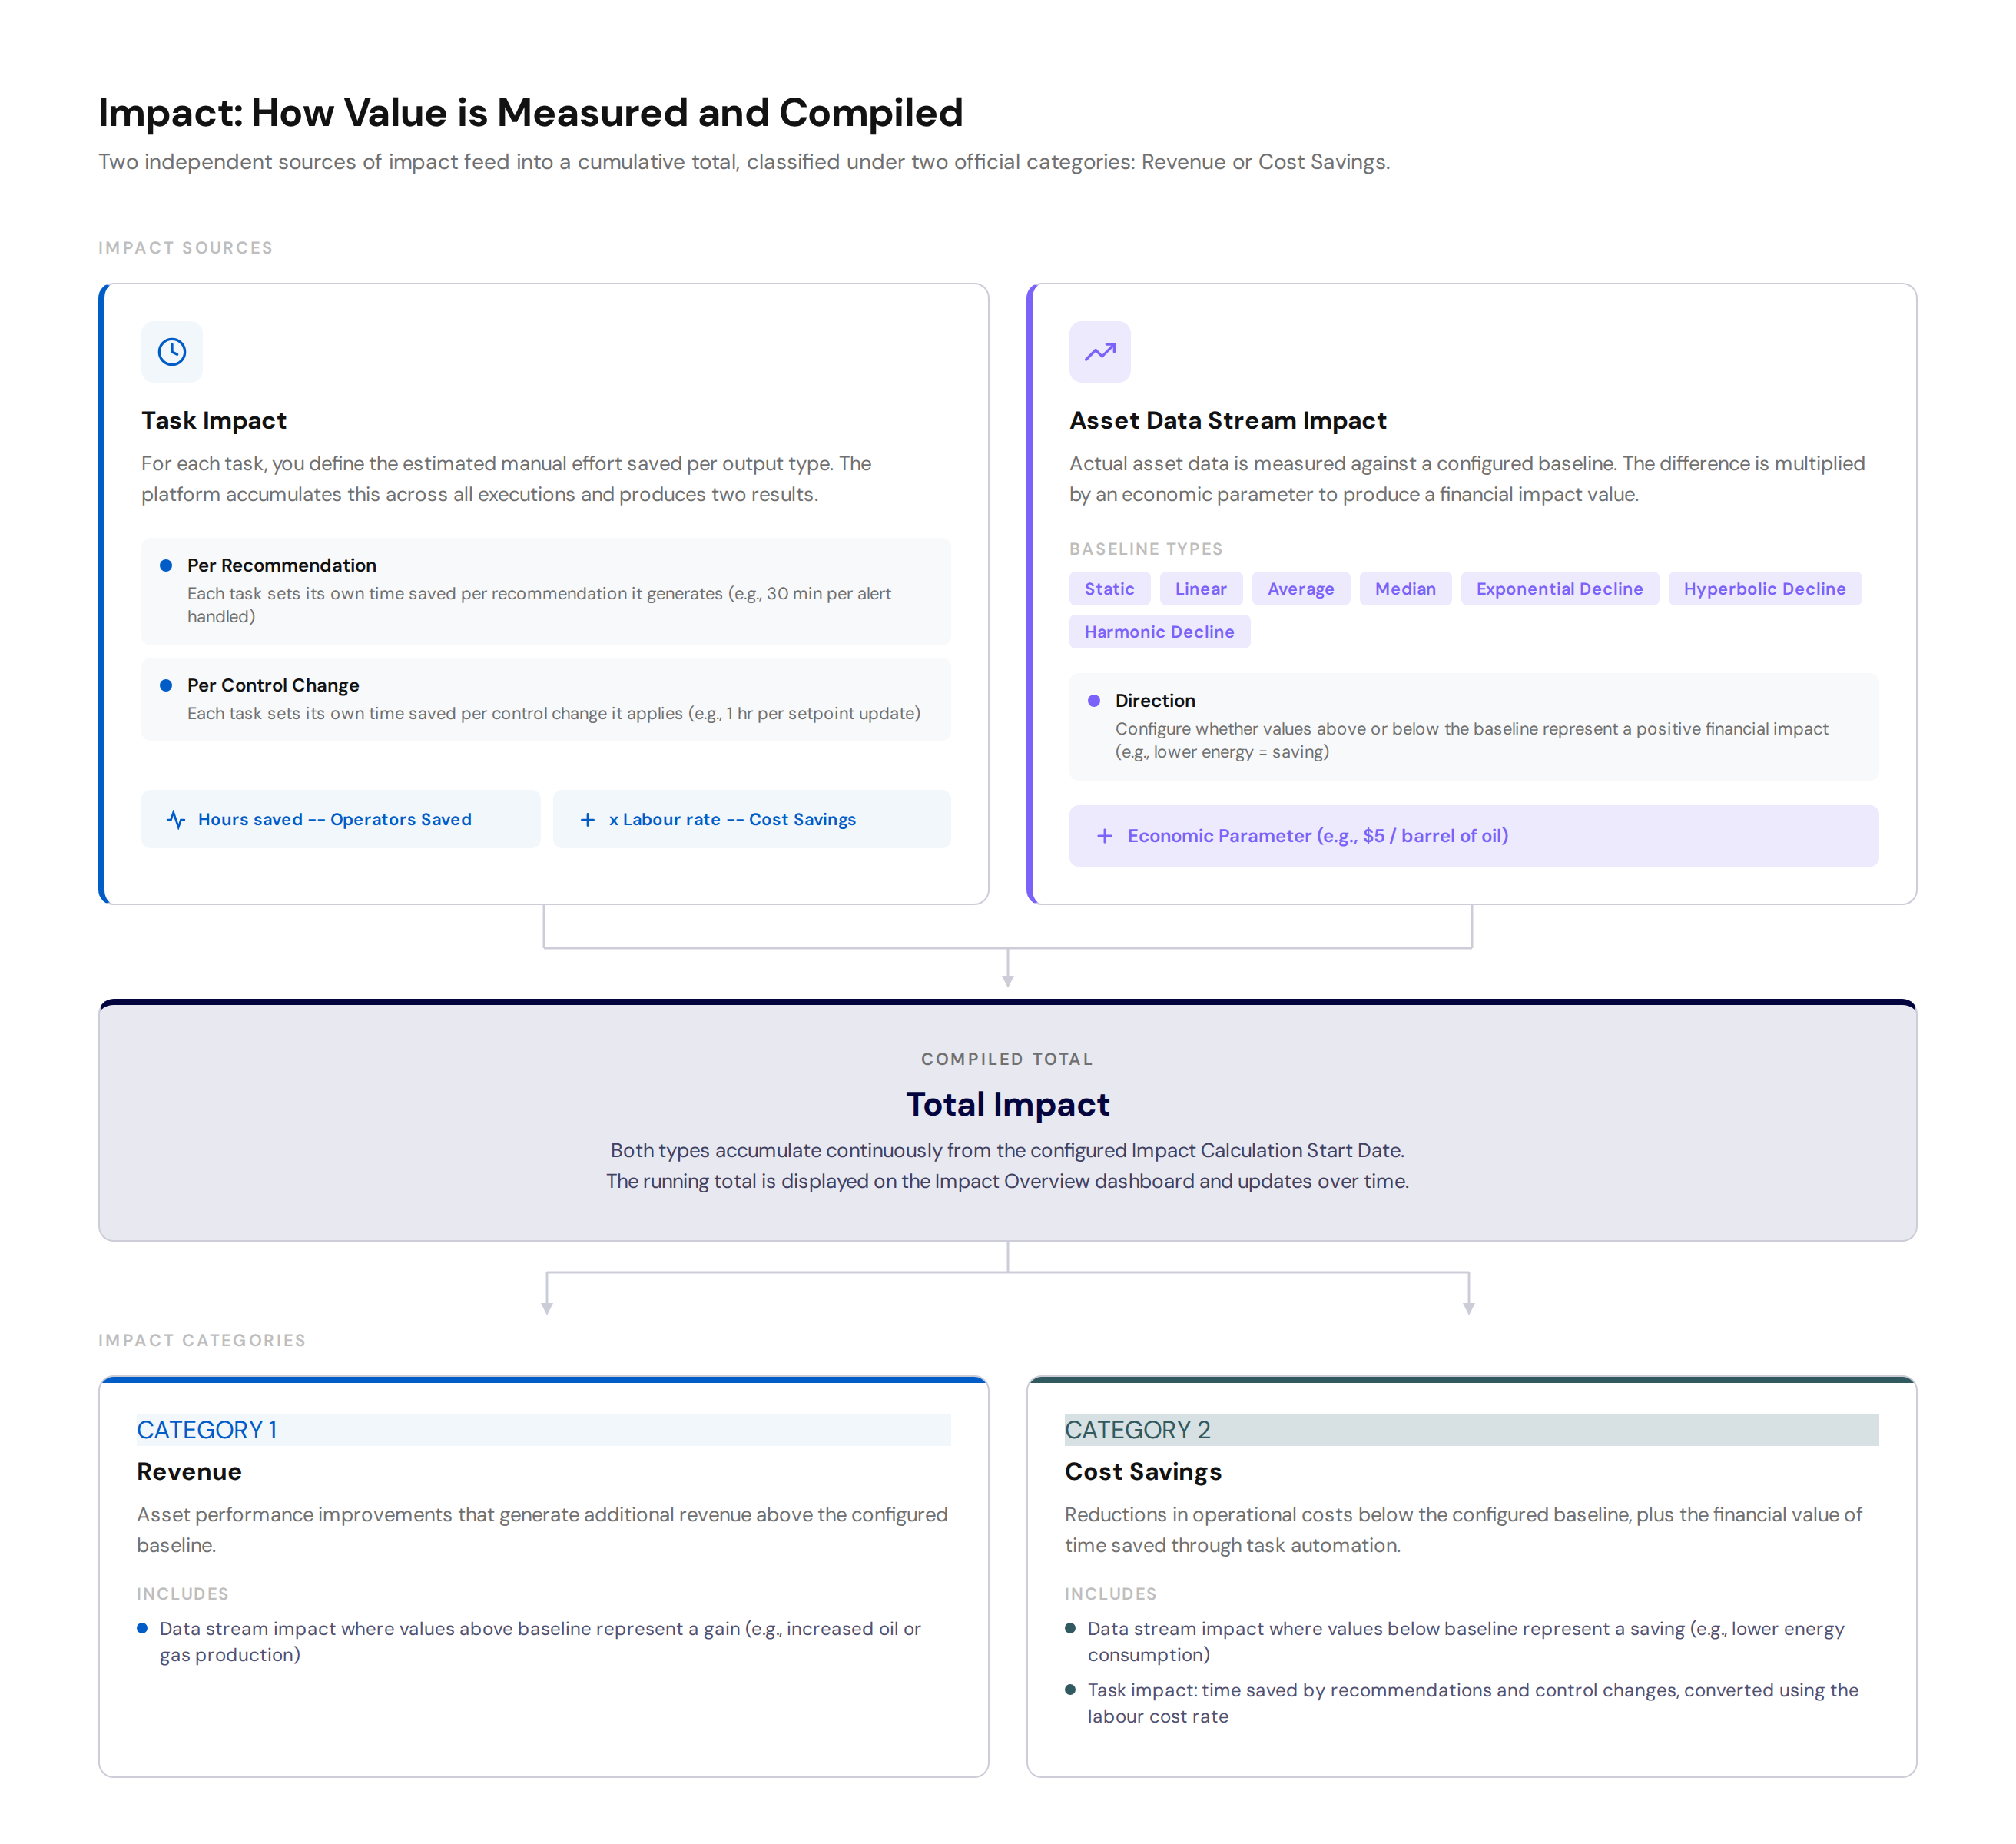
The Impact section gives Operations Engineers a clear, quantifiable view of the value that Kelvin's tasks, recommendations, and control changes are delivering to the business.
Instead of relying on qualitative judgement, Impact tracks two types of measurable value:
- Task Impact -- each task lets you define the estimated manual effort saved per recommendation and per control change it produces. The platform accumulates this across all executions to show total hours saved by Operations Engineers, and converts it to a financial saving using the configured labor cost rate. Time saved is configured per task in the Task Impact Metrics settings.
- Asset Data Stream Impact -- compares actual asset performance against a configured baseline to calculate the financial impact of deviations above or below that baseline. Each metric is assigned to either the Revenue or Cost Savings category depending on whether the deviation represents additional income (e.g., higher oil production) or a cost reduction (e.g., lower energy consumption).
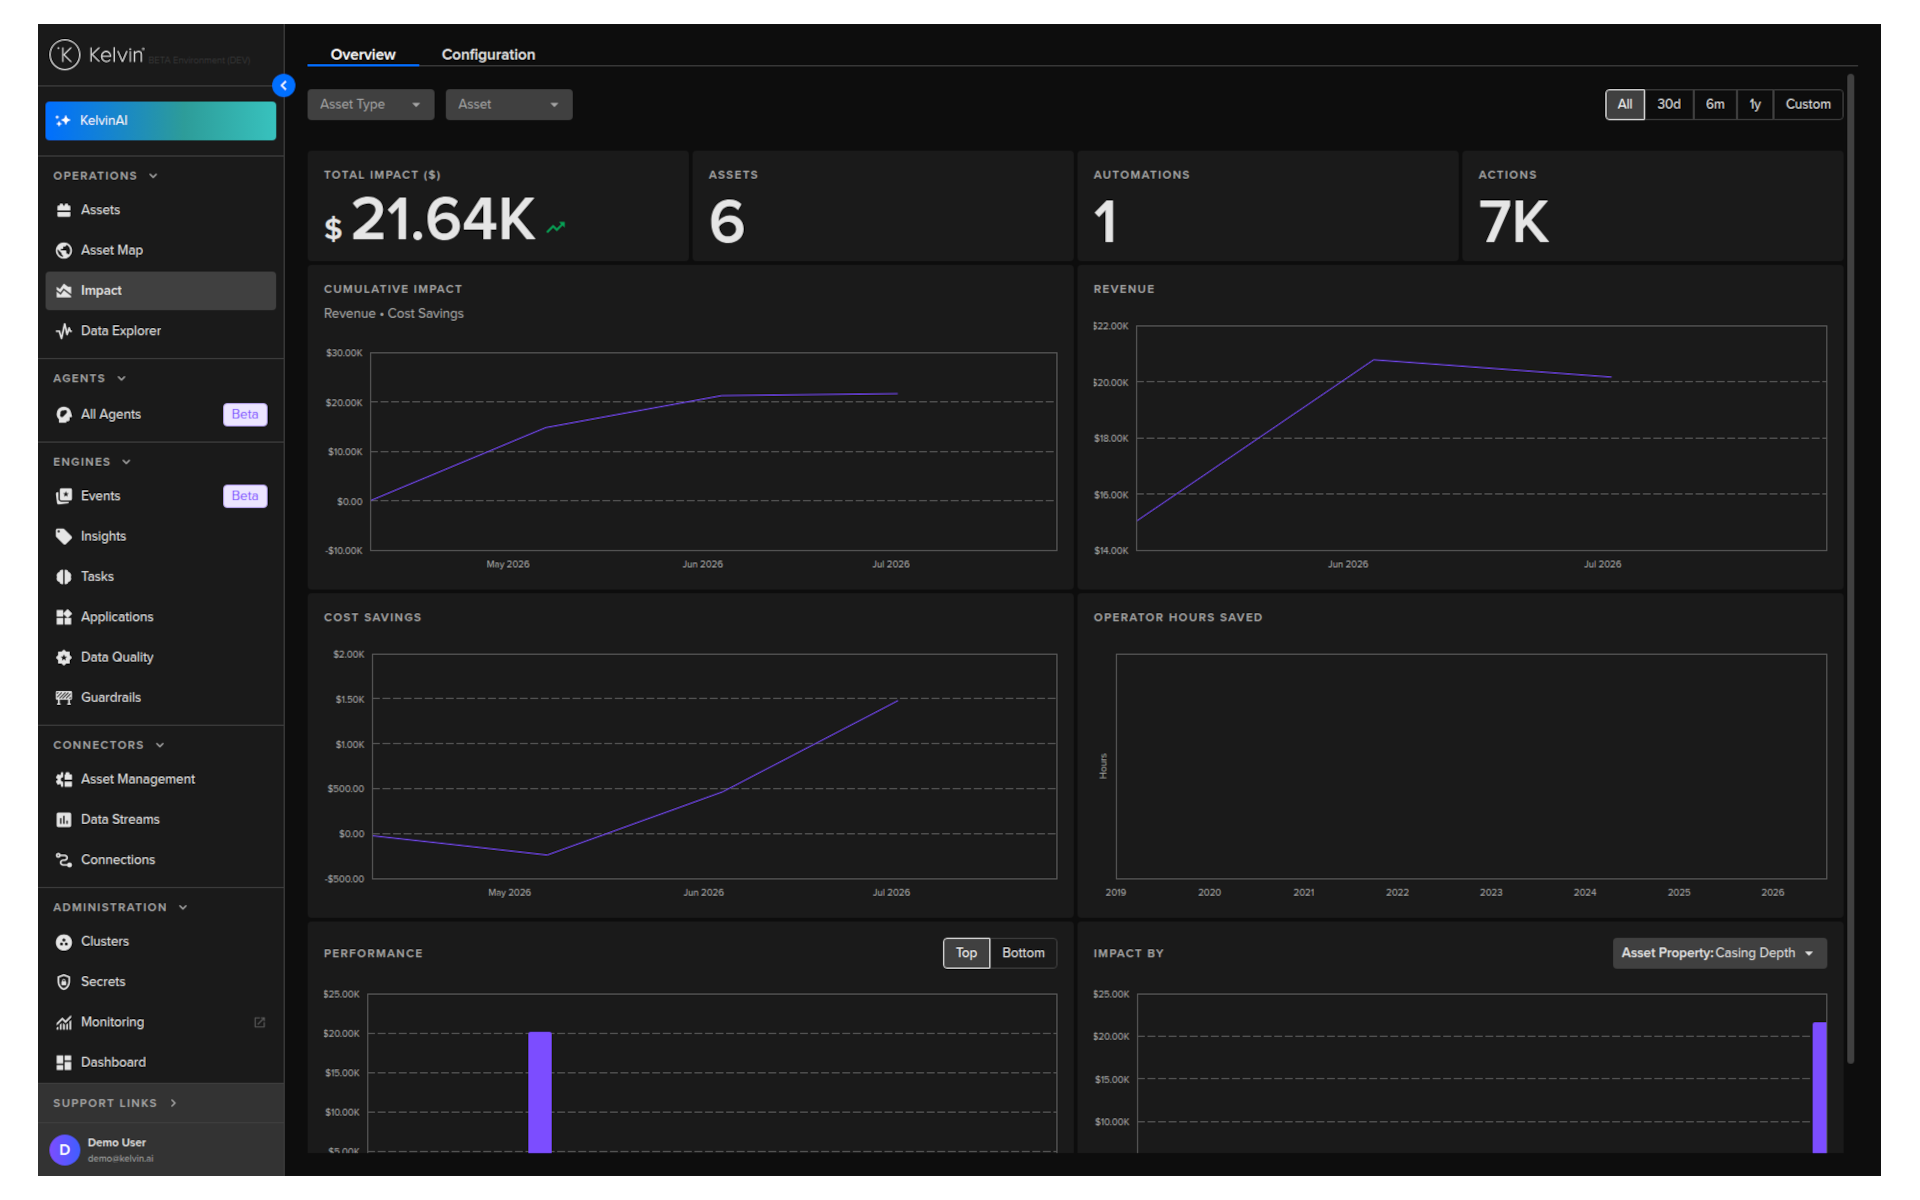
Both types of impact are accumulated over time and displayed on the Impact Overview dashboard.
Impact Overview Dashboard
The Impact Overview dashboard shows cumulative impact across all assets or a filtered subset. Impact is classified under two official categories.
| Category | What it measures |
|---|---|
| Revenue | Asset performance improvements above the configured baseline that generate additional income (for example, an increase in oil flow rate or gas production) |
| Cost Savings | Two sources: (1) asset data stream impact where values are below the configured baseline (e.g., lower energy consumption) calculated by Impact Metrics; and (2) the financial equivalent of hours saved through task recommendations and control changes, where the time per output is set on each task and converted using the Cost of Labor rate |
The dashboard also shows a number of compiled information alongside the category totals:
- Summary -- the totals impact in dollars, assets managed, number of automations and total actions taken.
- Operator Hours Saved -- the cumulative hours saved by Operations Engineers, drawn from the per-output time-saved values configured on each task. This is the raw time equivalent of the task contribution to Cost Savings.
- Performance -- per asset view of the performance above or below their configured baselines.
- Impact per Parameter - Total savings overview for a specific parameter.
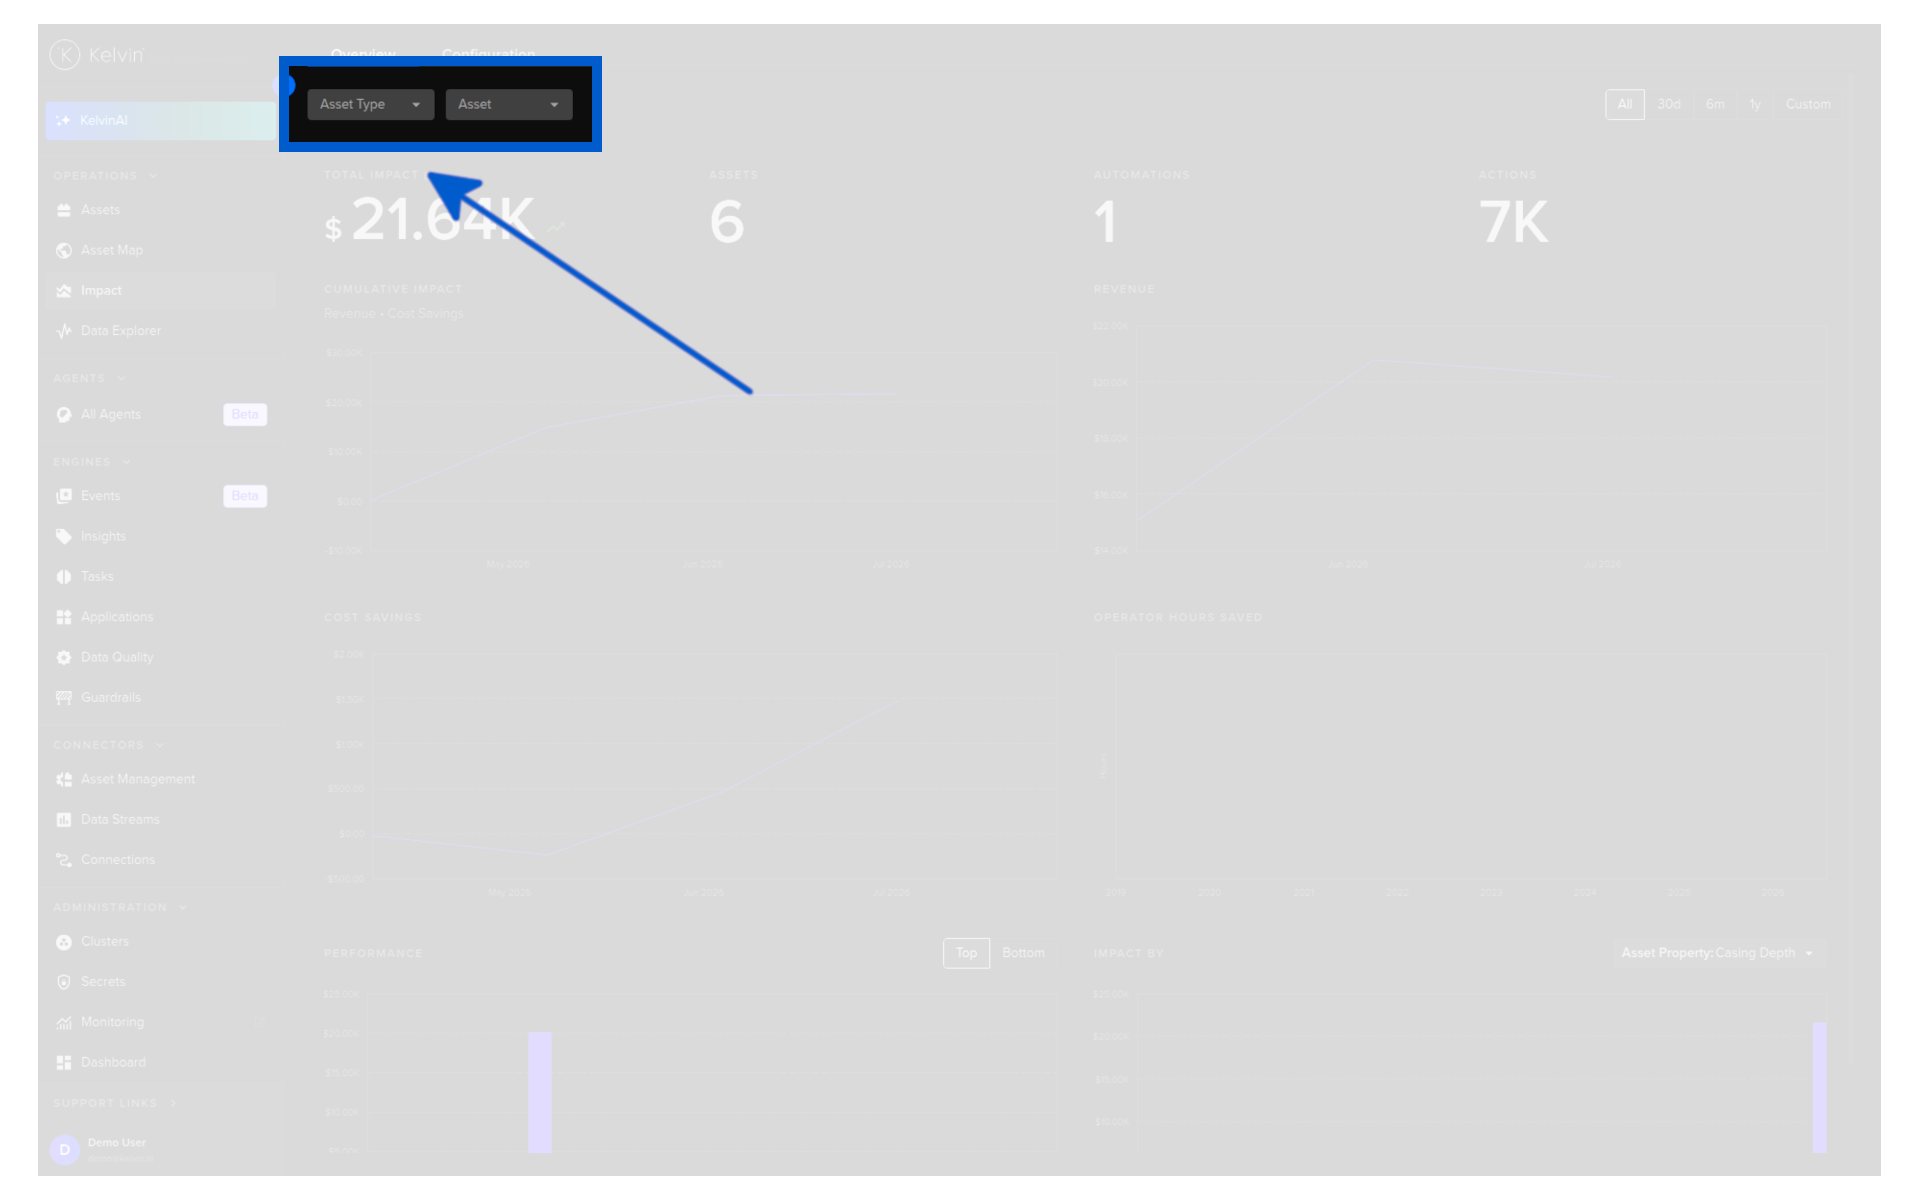
You can filter the dashboard by specific assets and group results by any asset property -- such as county, region, or manufacturer -- to compare performance across groups.
Configuration
Impact is configured in two places under Impact > Configuration in the navigation. The two work together: Economic Parameters define the financial values, and Impact Metrics use those values alongside a baseline to calculate impact for each category.
Info
The configuration below covers asset data stream impact only.
The task-based portion of the Impact dashboard -- Operator Hours Saved and the task contribution to Cost Savings -- is configured exclusively on each individual task, not here. See Task Impact Metrics for how to set the time saved per task output.
Economic Parameters
Economic Parameters define the financial values that Impact Metrics draw on when calculating Revenue and Cost Savings.
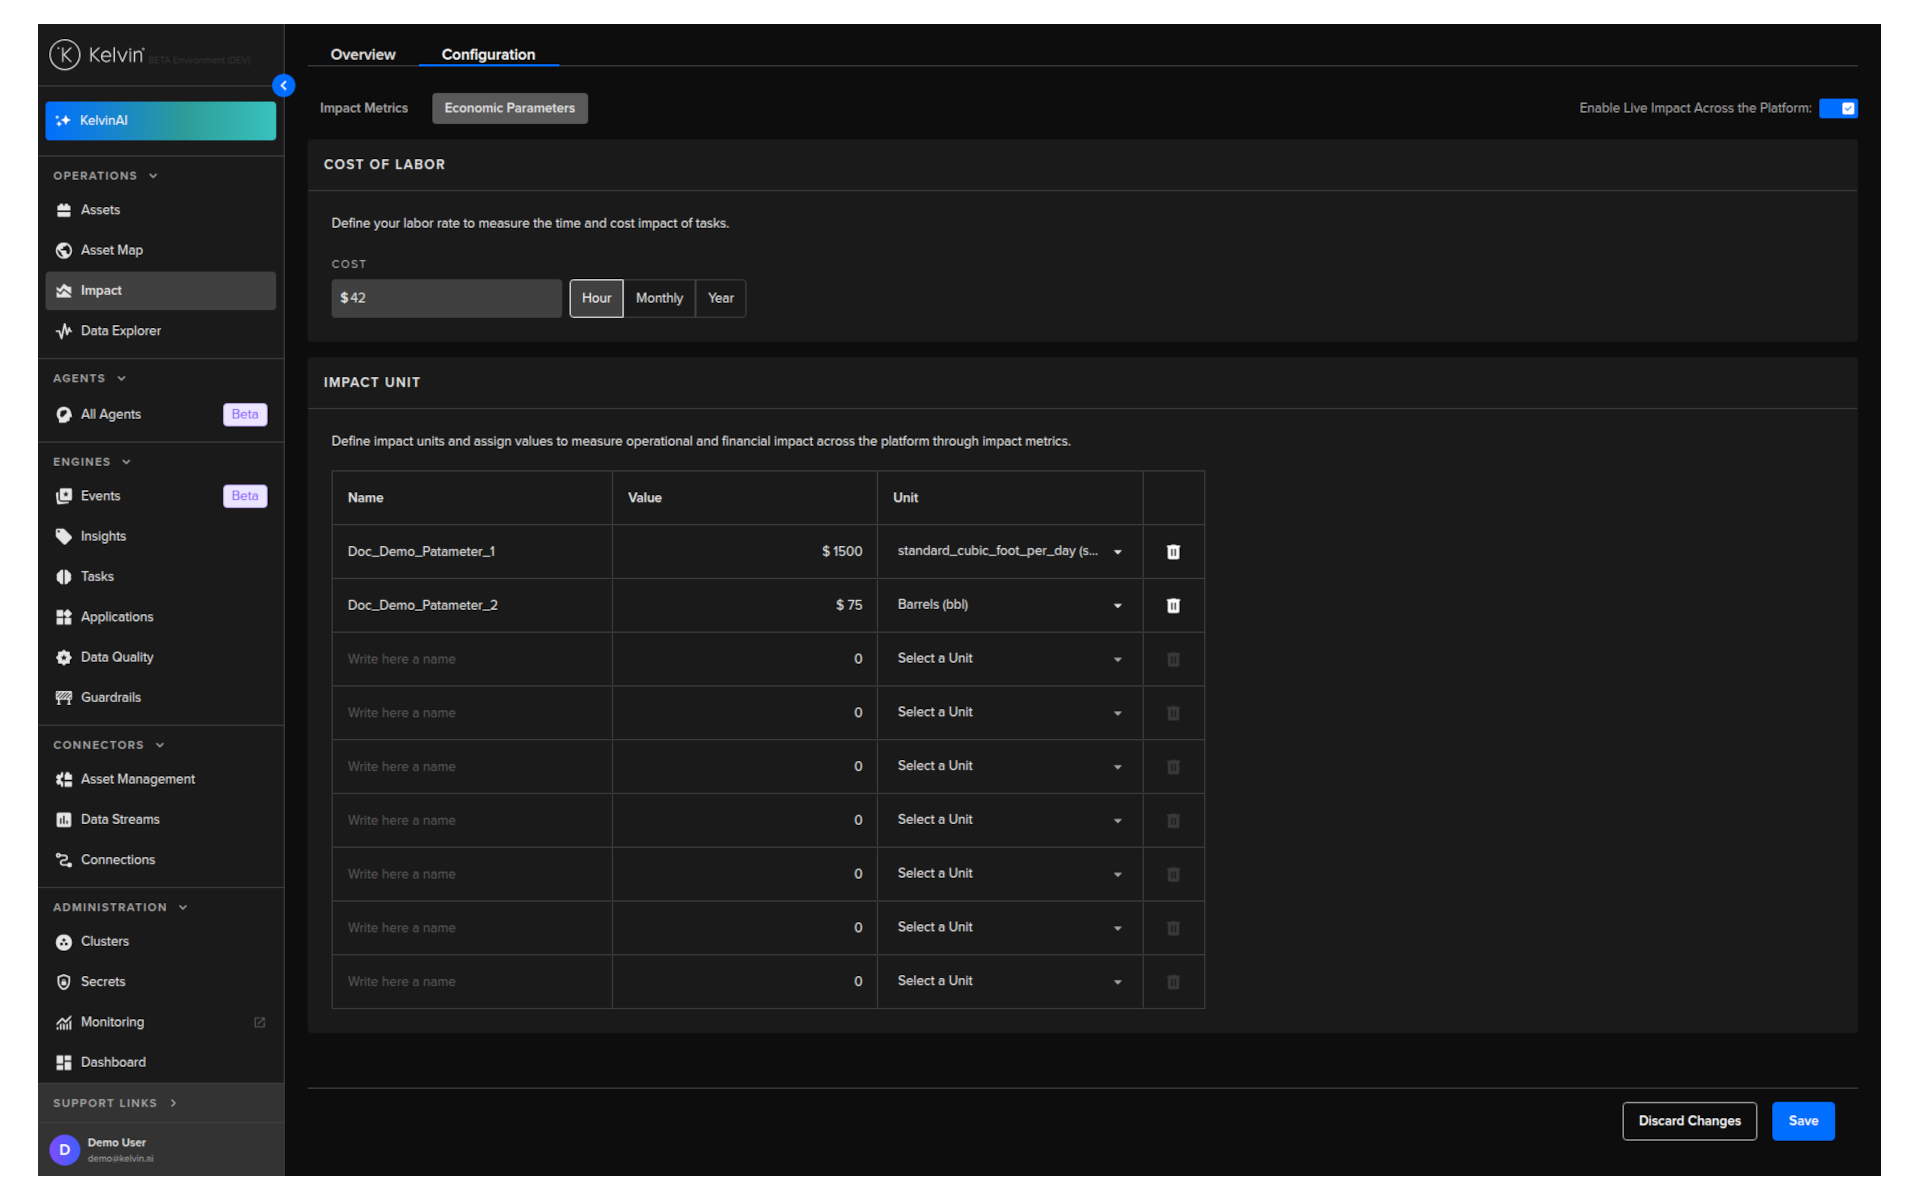
- Cost of Labor -- the rate used by task impact calculations to convert time saved into a Cost Savings figure. You can set this as an hourly, monthly, or yearly rate. The platform converts automatically:
- Monthly rate = hourly rate x 8 hours x 20 working days
- Yearly rate = hourly rate x 8 hours x 20 working days x 12 months
- Impact Units -- custom economic units with a name, value, and unit symbol. For example, the price of a barrel of crude oil or the price per mscf of natural gas. These units are referenced by Impact Metrics to convert a data stream difference into a Revenue or Cost Savings figure.
Note
Impact unit symbols use the same list as data stream units. New unit symbols cannot be created directly in the Impact configuration -- they are created when importing data via the CSV publisher connector.
Impact Metrics
Impact Metrics define how Revenue and Cost Savings are calculated for each asset data stream.
In the overview Impact Metrics you will see a list of all the individual calculations.
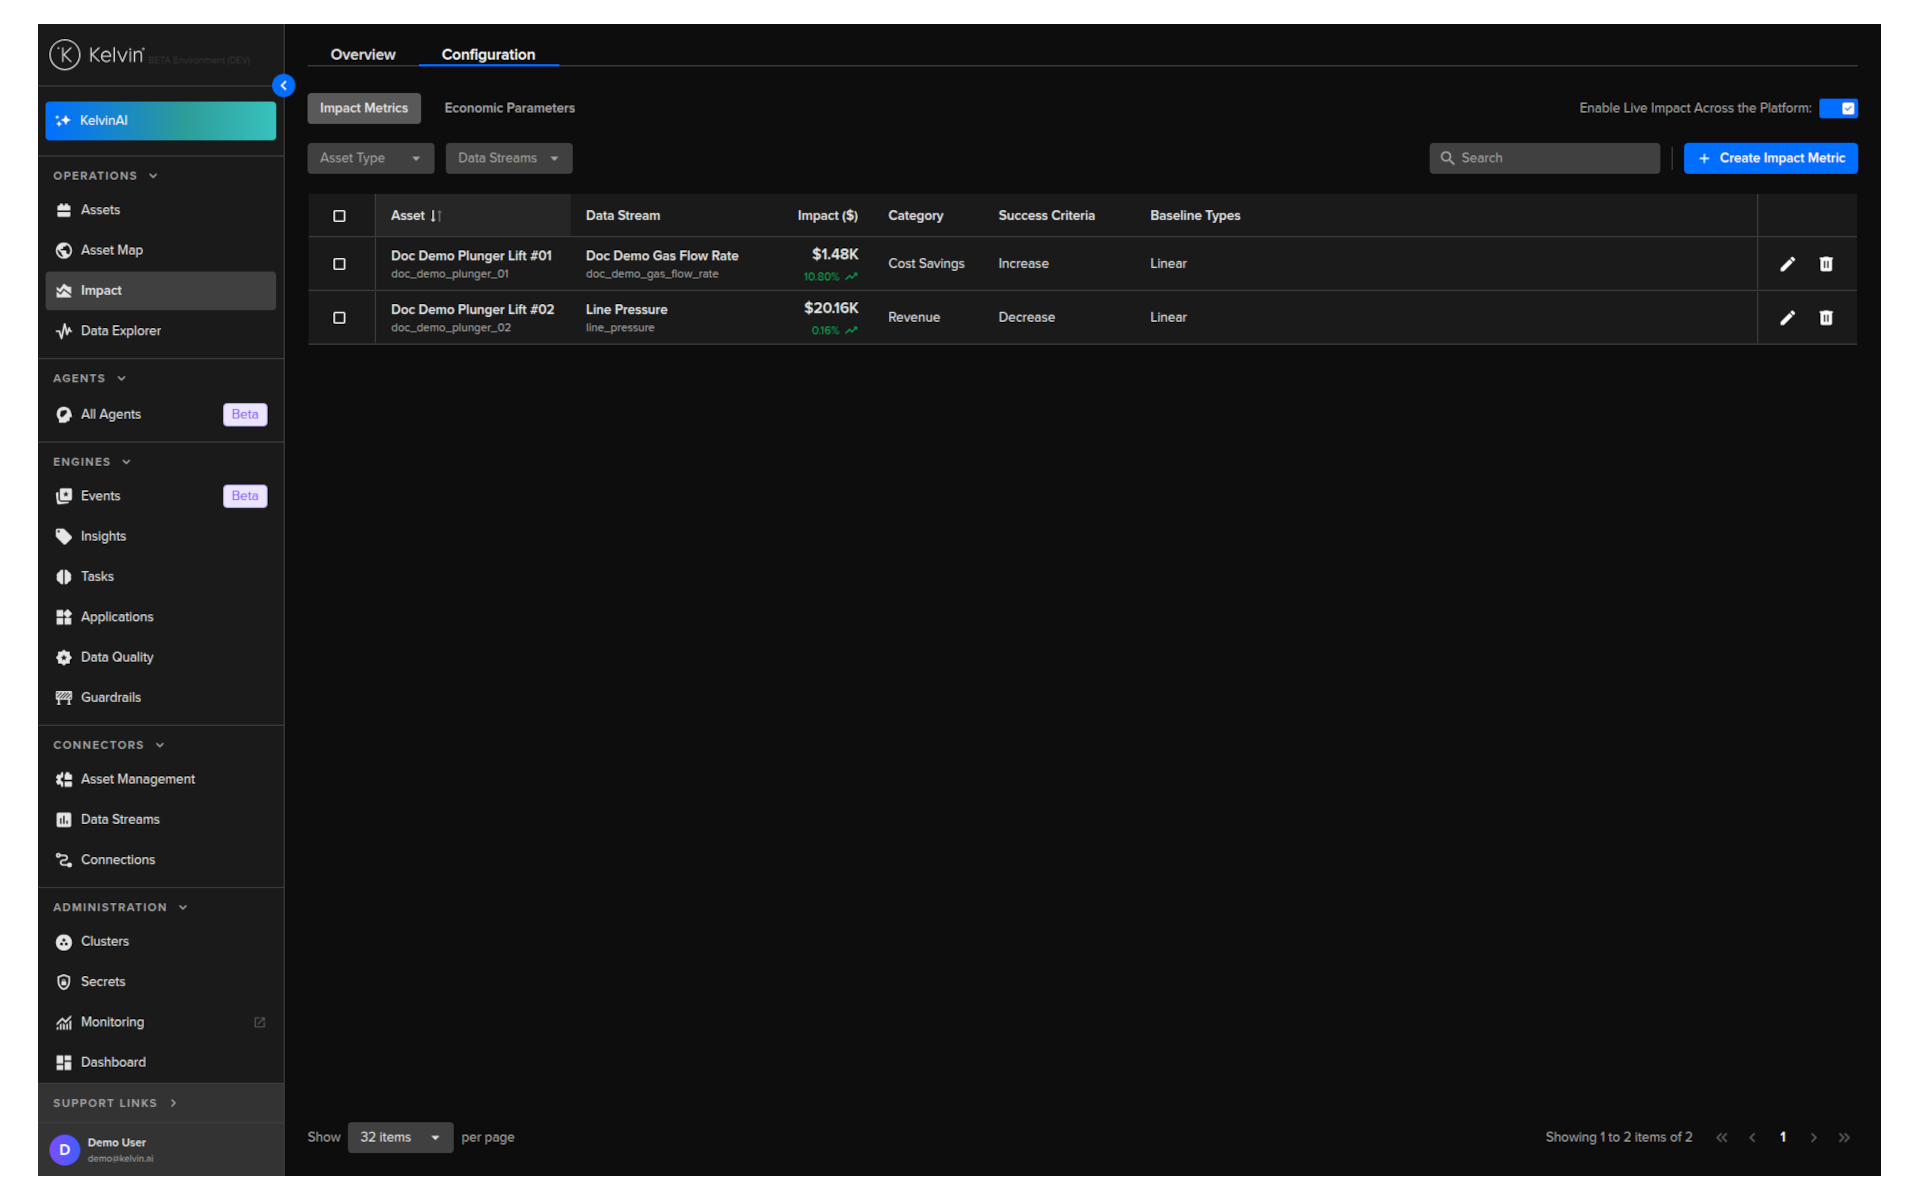
Each metric pairs a baseline (what the data stream should be doing) with an Economic Parameter (what the difference is worth) to produce the financial impact value.
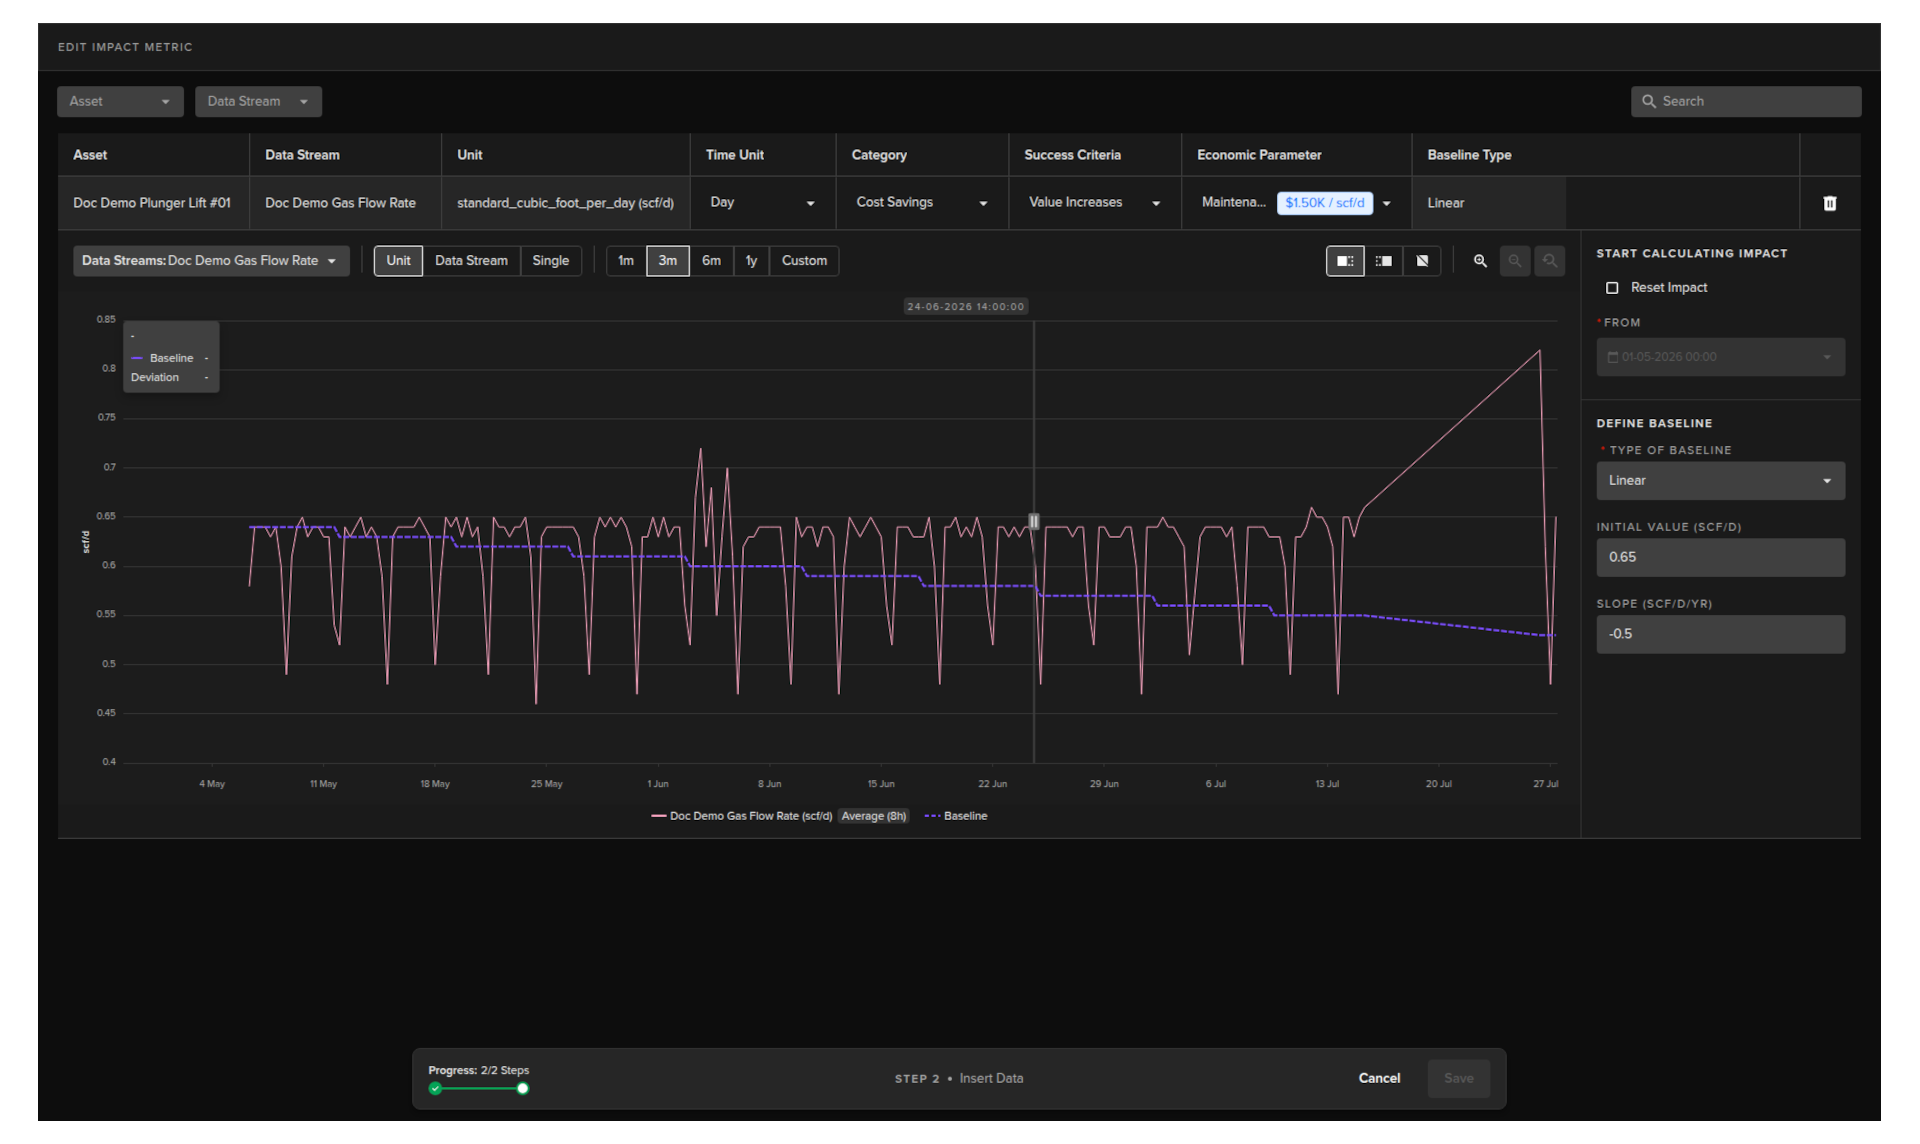
For each metric you select an asset and a data stream, assign an Economic Parameter, and choose a baseline type. The available baseline types are:
| Baseline Type | Description |
|---|---|
| Static | A constant value you set manually |
| Linear | An initial value with a slope, expressed as the data stream unit per year |
| Average | The average of the data stream over a selected historical time range |
| Median | The median of the data stream over a selected historical time range |
| Exponential Decline | A declining curve from an initial value; you can feed historical data to calculate the decline rate or set it manually |
| Hyperbolic Decline | An exponential decline with an Arps exponent (b-factor) for more complex decline curves |
| Harmonic Decline | A harmonic decline curve |
Each metric is also configured with:
- Impact Category -- whether this metric contributes to Revenue or Cost Savings. This determines which category on the dashboard receives the calculated value.
- Economic Parameter -- the Impact Unit from Economic Parameters used to convert the data stream difference into a financial figure (for example, $5 / barrel of oil multiplied by the barrels above or below the baseline).
- Direction -- whether values above the baseline represent a saving (positive impact) or a loss (negative impact).
- Time Unit -- the time period used to aggregate data points before calculating the difference against the baseline. Required because assets may produce data at variable rates.
- Baseline Start Date -- the date from which the baseline curve is anchored. This tells the platform what period of historical data to use when calculating the expected shape and level of the data stream. It does not start accumulating impact values.
- Impact Calculation Start Date -- the date from which financial impact values begin accumulating in your totals. This is completely independent of the Baseline Start Date.
Two dates -- two different purposes
These two dates do different jobs and are set independently.
The Baseline Start Date answers: "What historical data should I use to define what normal looks like?" You might set this years in the past to build a reliable curve.
The Impact Calculation Start Date answers: "From when should I start counting financial savings?" You might set this to today, or to a date in the past to capture savings that have already occurred.
A common example: define a baseline from 3 years of historical production data, but only start counting impact from the date you deployed Kelvin.
How Impact is Calculated
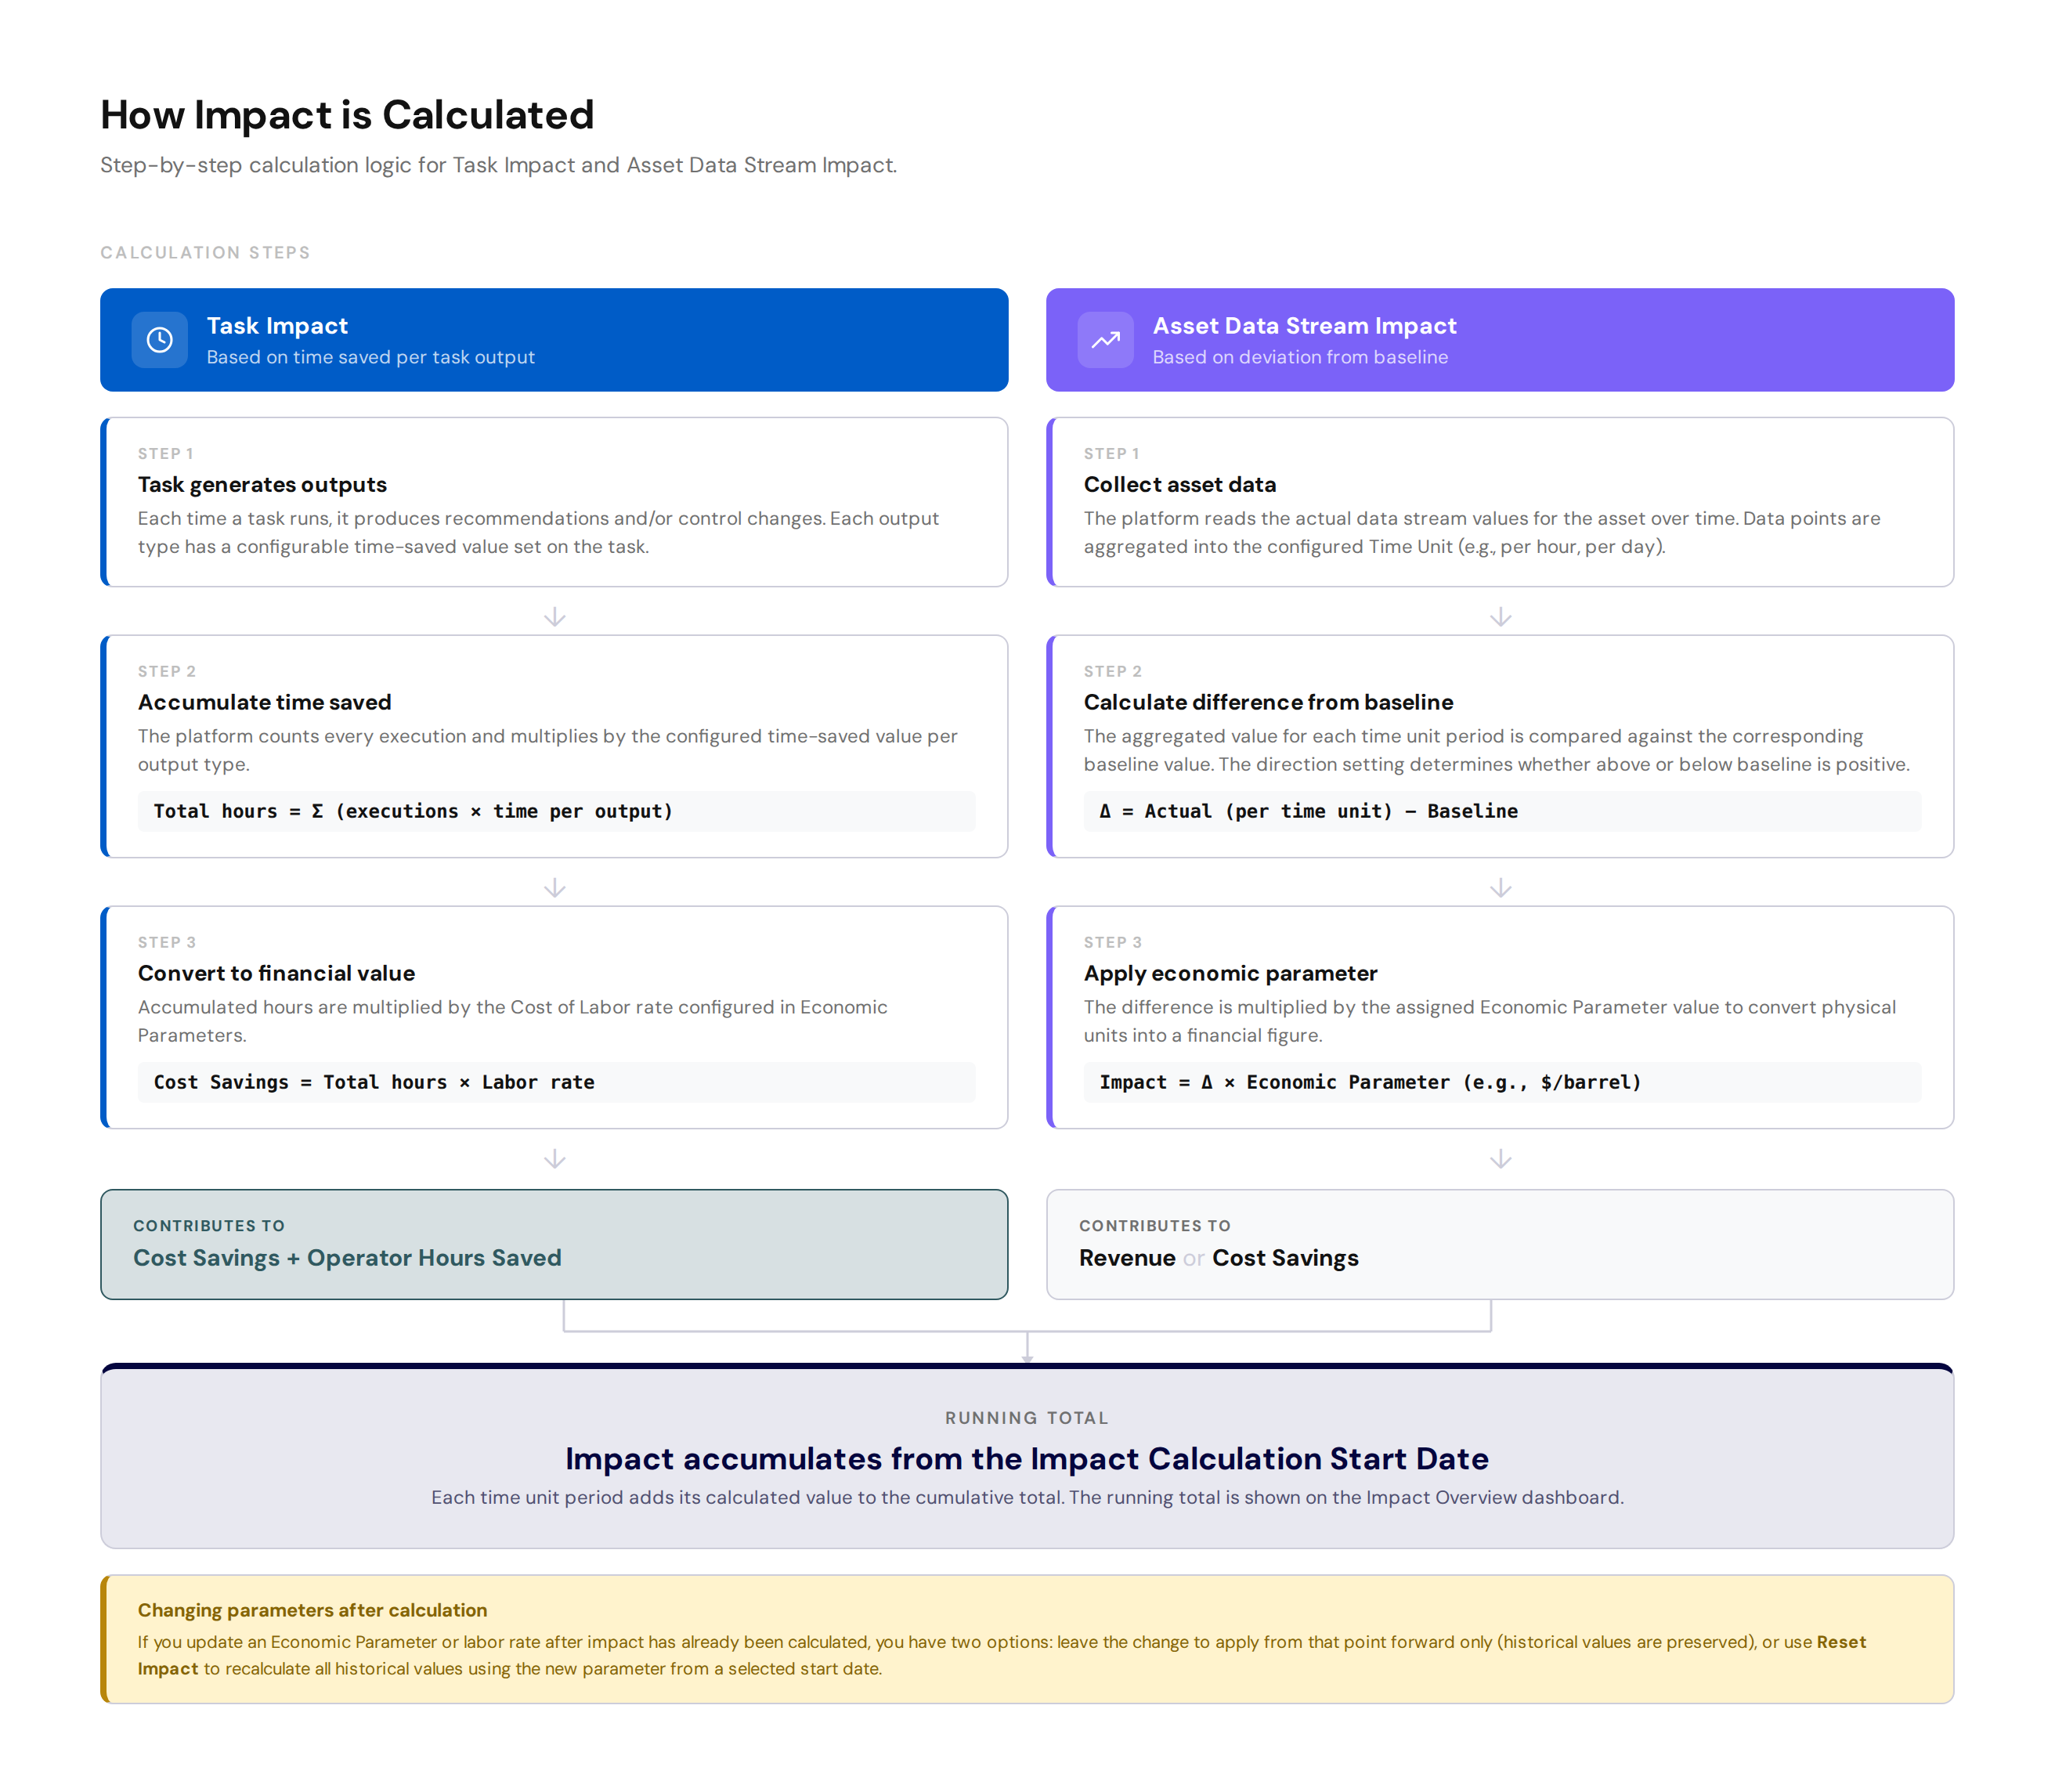
For task impact, each time a recommendation or control change is generated by a task, the configured time-saved value for that action type is added to the running total. The platform multiplies this accumulated time by the labor cost to produce the cost saving figure.
For asset data stream impact, the platform periodically calculates the difference between actual asset data and the baseline value for the configured time unit. This difference is then multiplied by the relevant economic parameter to produce the financial impact value. The results accumulate from the configured impact start date.
If you change an economic parameter value after impact has already been calculated, you have two options:
- Leave the change to apply from that point forward only (historical values are preserved).
- Use Reset Impact to recalculate all historical values using the new parameter.
Multi-Asset Configuration
When creating an Impact Metric you can configure it for a single asset or apply it across multiple assets at once by locking on a data stream name.
When using multi-asset mode:
- If you let the platform fit the baseline from historical data, each asset gets its own individually calculated baseline values.
- If you manually override a parameter value, the same value is applied to all assets in the group.
This makes it efficient to set up impact tracking across large fleets while still allowing per-asset precision where needed.