Tasks Beta
Beta Release
Tasks is currently in beta. Improvements and new capabilities will continue to be added quickly with each new release.
On this page you will learn how to create a Task from an Insight, understand the flowchart it generates, and manage your Tasks from the overview table.
Overview
A Task defines what should happen when a specific event pattern is detected on an asset.
You describe your intent in plain language, the AI asks a series of clarifying questions to make sure it understands, and then generates a logical flowchart showing exactly how the task will run.
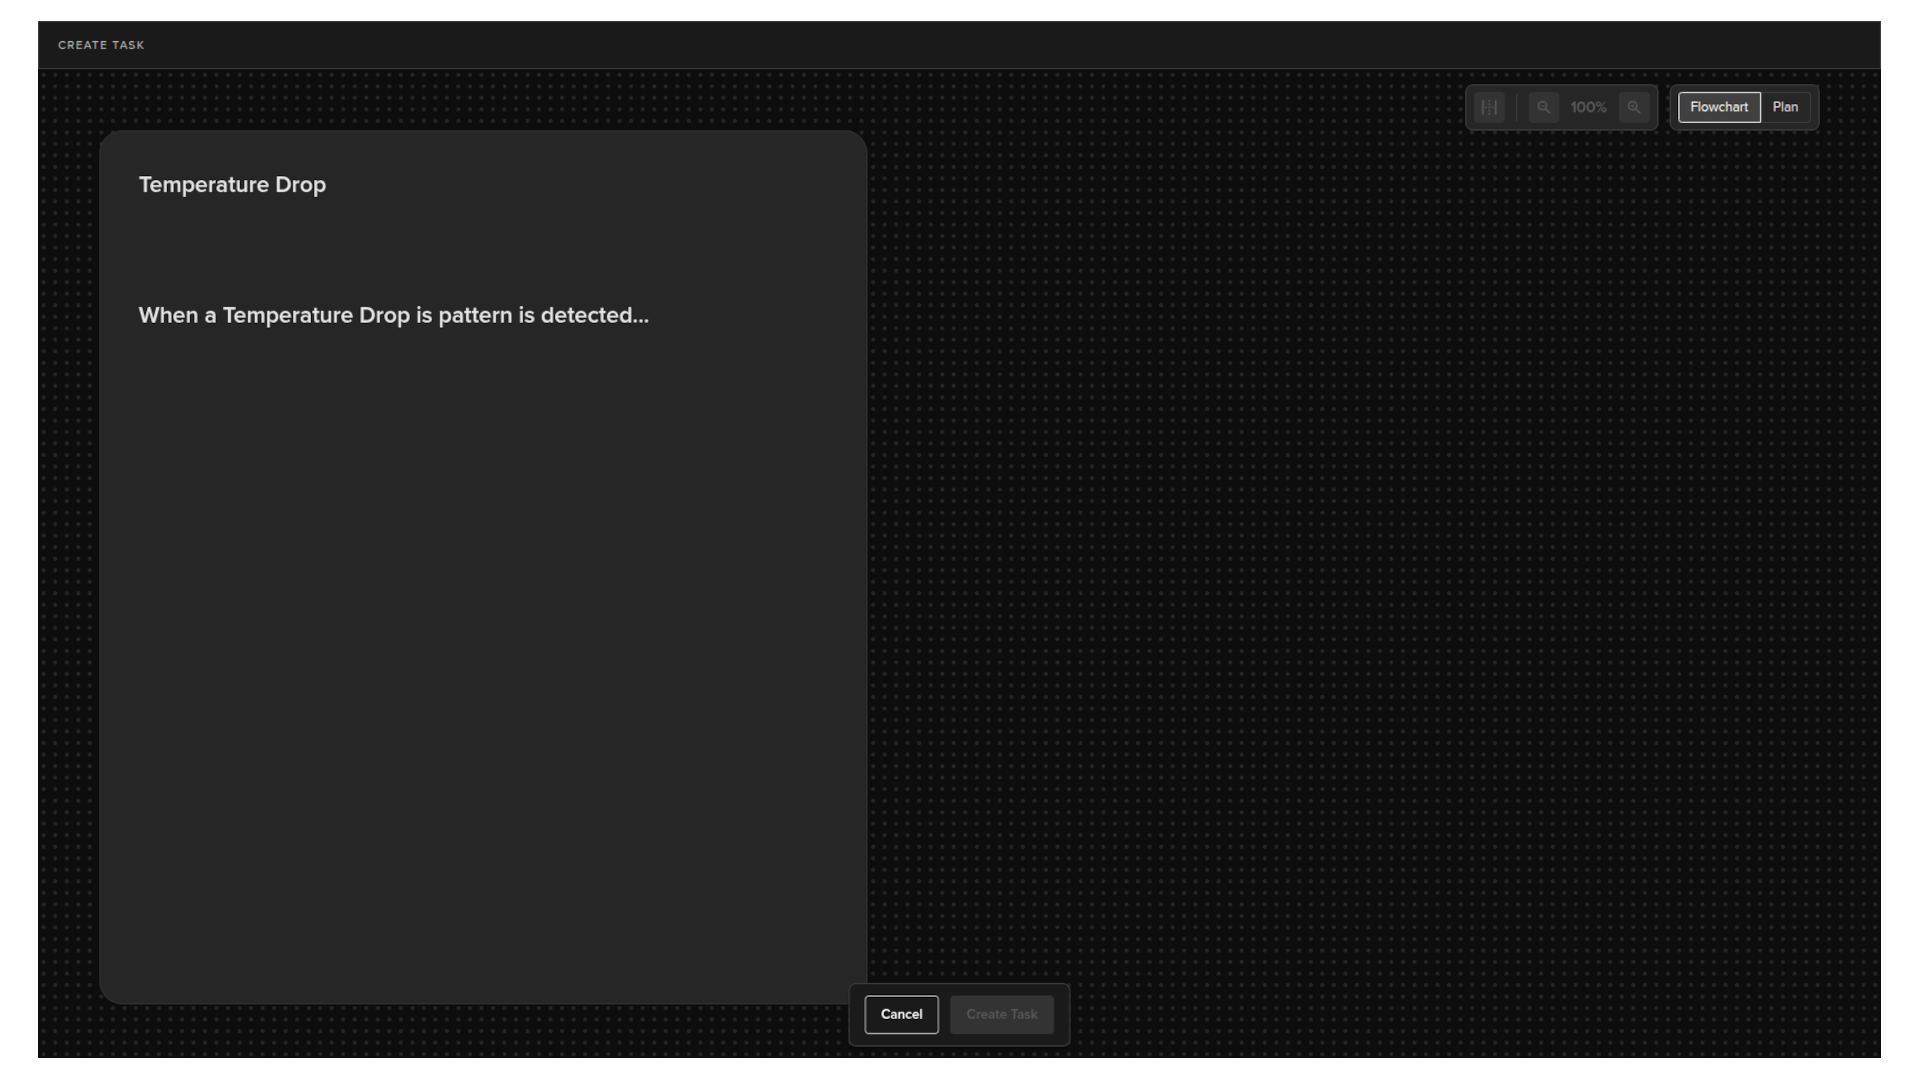
Create Task
You will either create the task from the Insights page or directly from the Tasks page.
From the tasks page click Create Task in the top right to create a new task from scratch, without starting from an Insight.
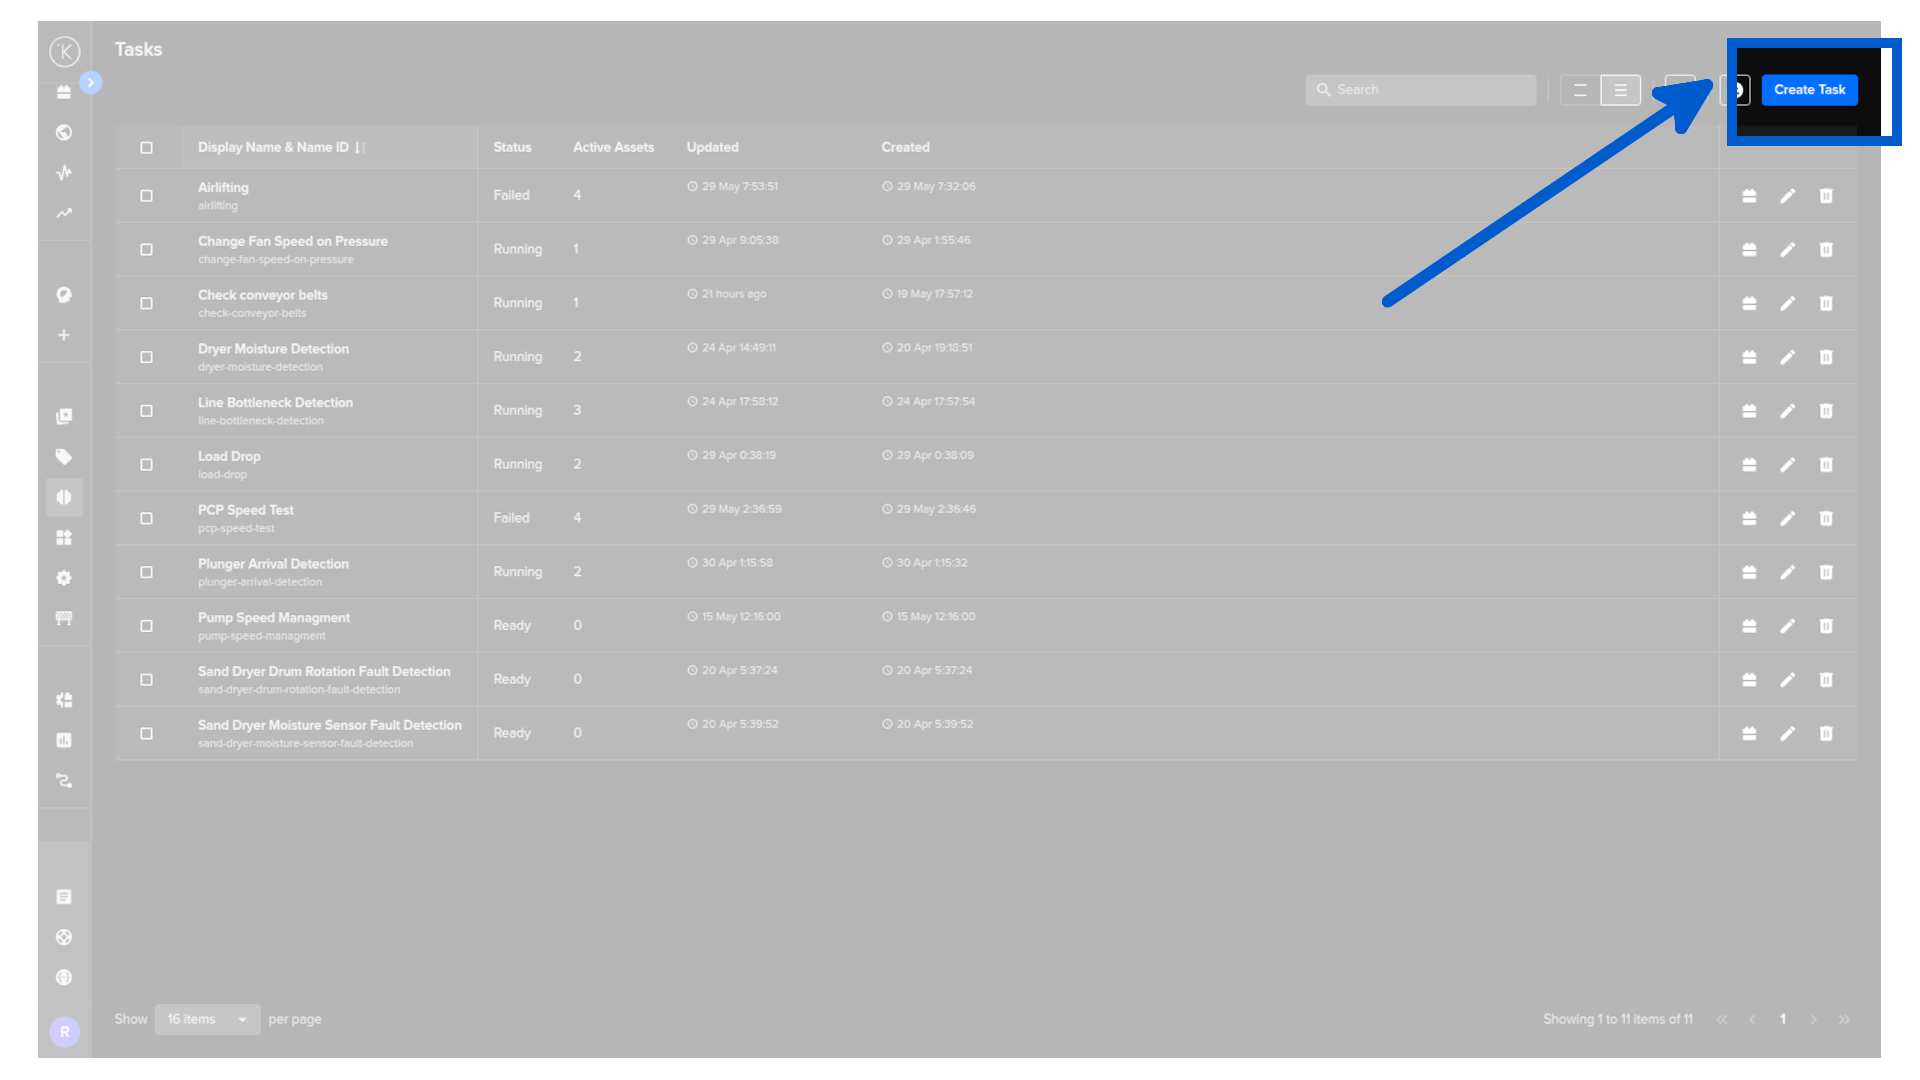
Note
The rest of the task creation steps are the same regardless if you come from the Insights page or from the Task page directly.
Write your task
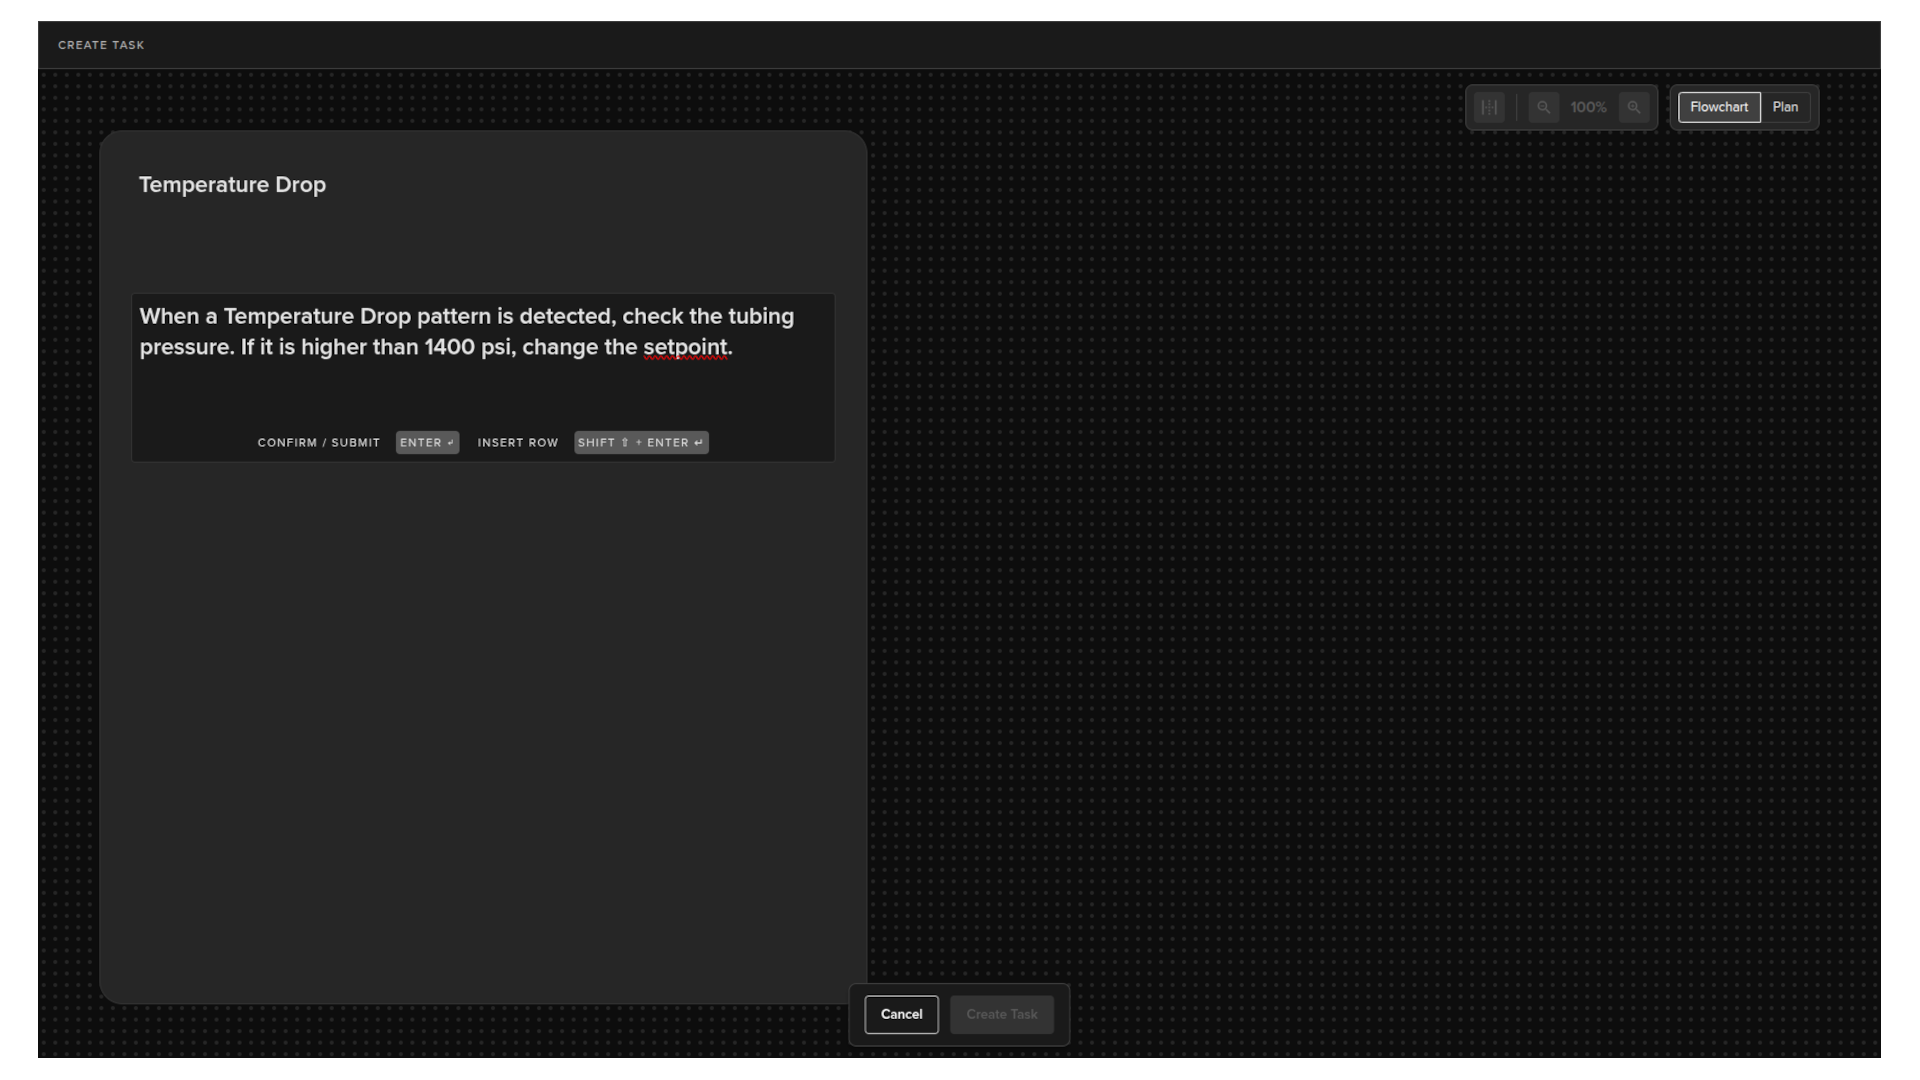
The left side of the screen is an interactive chat panel. You describe what you want the task to do, and the AI responds -- asking clarifying questions, offering suggestions, and updating the flowchart on the right as the conversation progresses.
You do not need to be precise or technical. Describe the situation and the outcome you want in your own words. For example:
When a Temperature Drop pattern is detected, check the tubing pressure. If it is higher than 1400 psi, change the setpoint.
Note
The conversation is genuinely interactive. You can ask the AI questions, challenge its interpretation, or request changes in plain language at any point -- not just at the start. The flowchart on the right updates as you go.
Press Enter to submit each message and let the AI update the flowchart to reflect your intent.
AI clarification
After you submit your description, the AI will ask a series of questions to confirm it has understood your intent correctly. Answer each question to help it build an accurate picture of what you want the task to do.
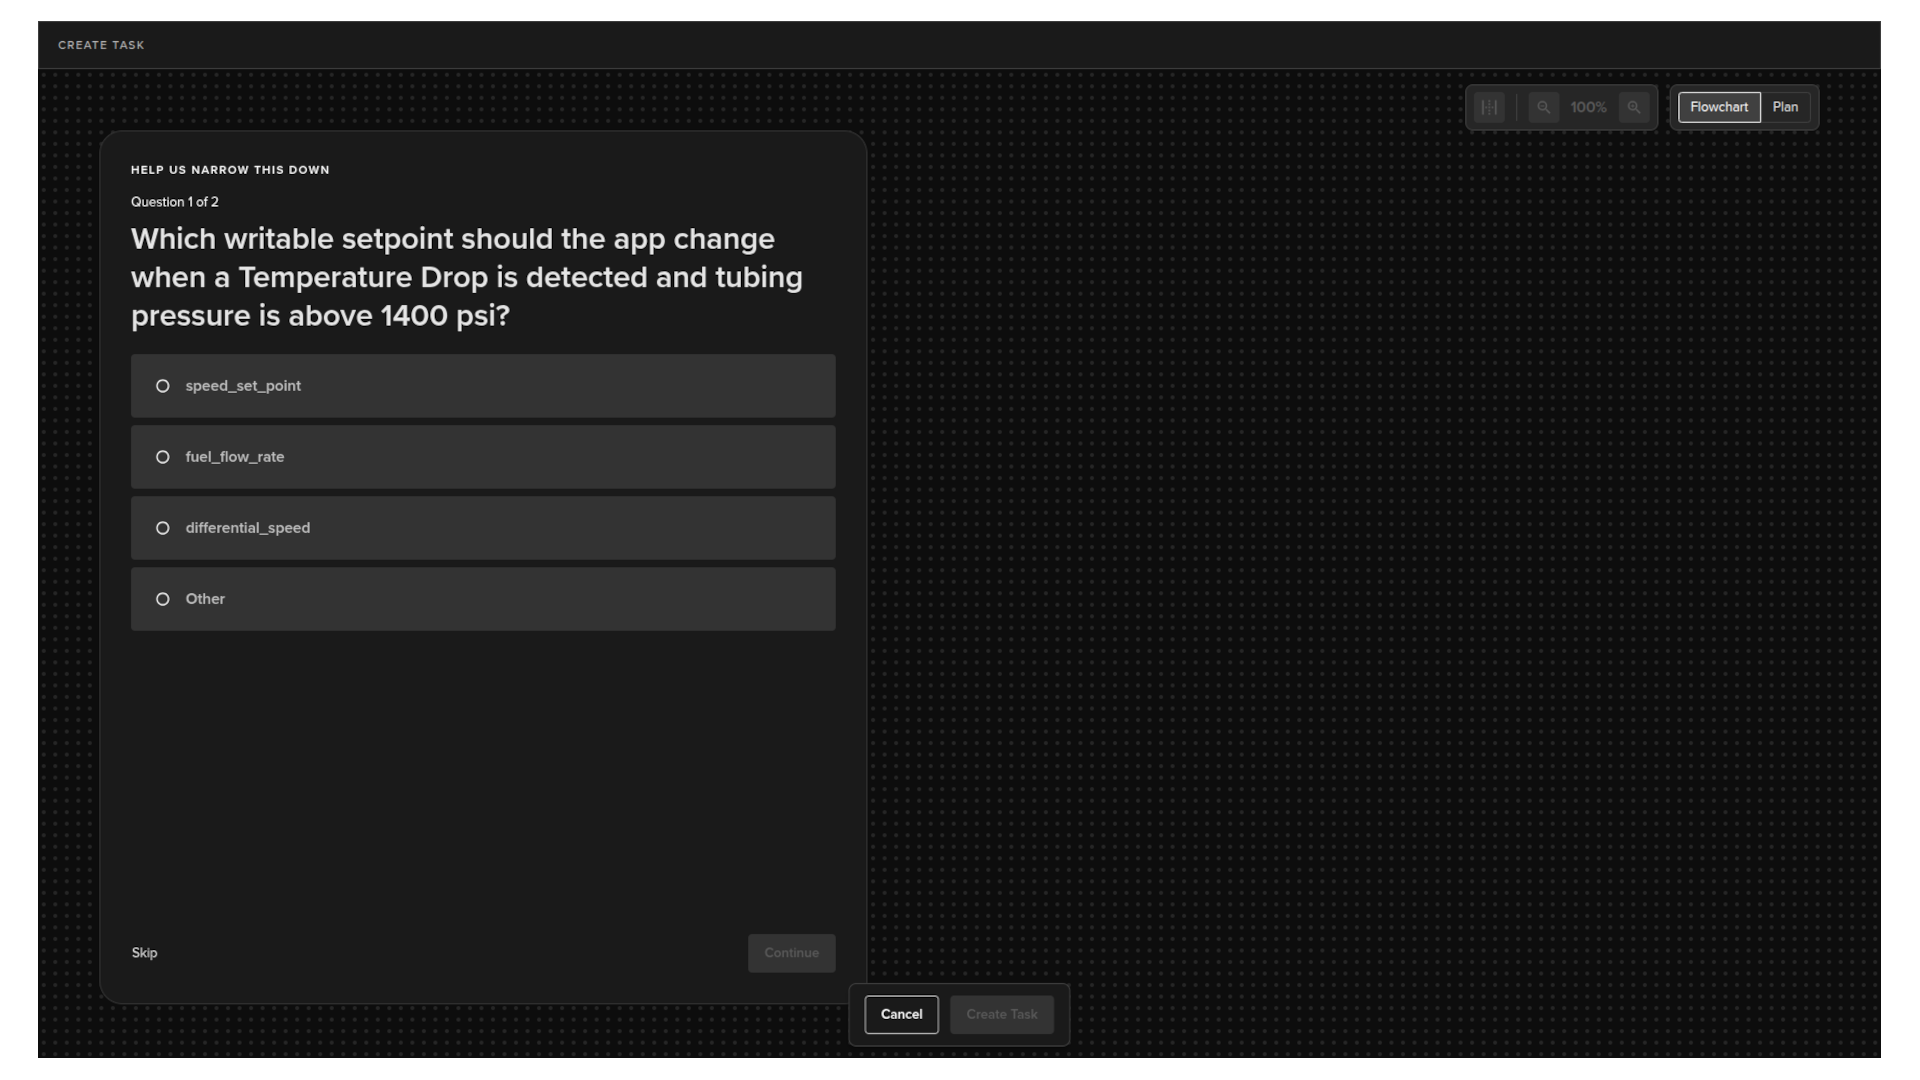
Once the questions are complete, the AI cleans up your original prompt and generates the task logic automatically.
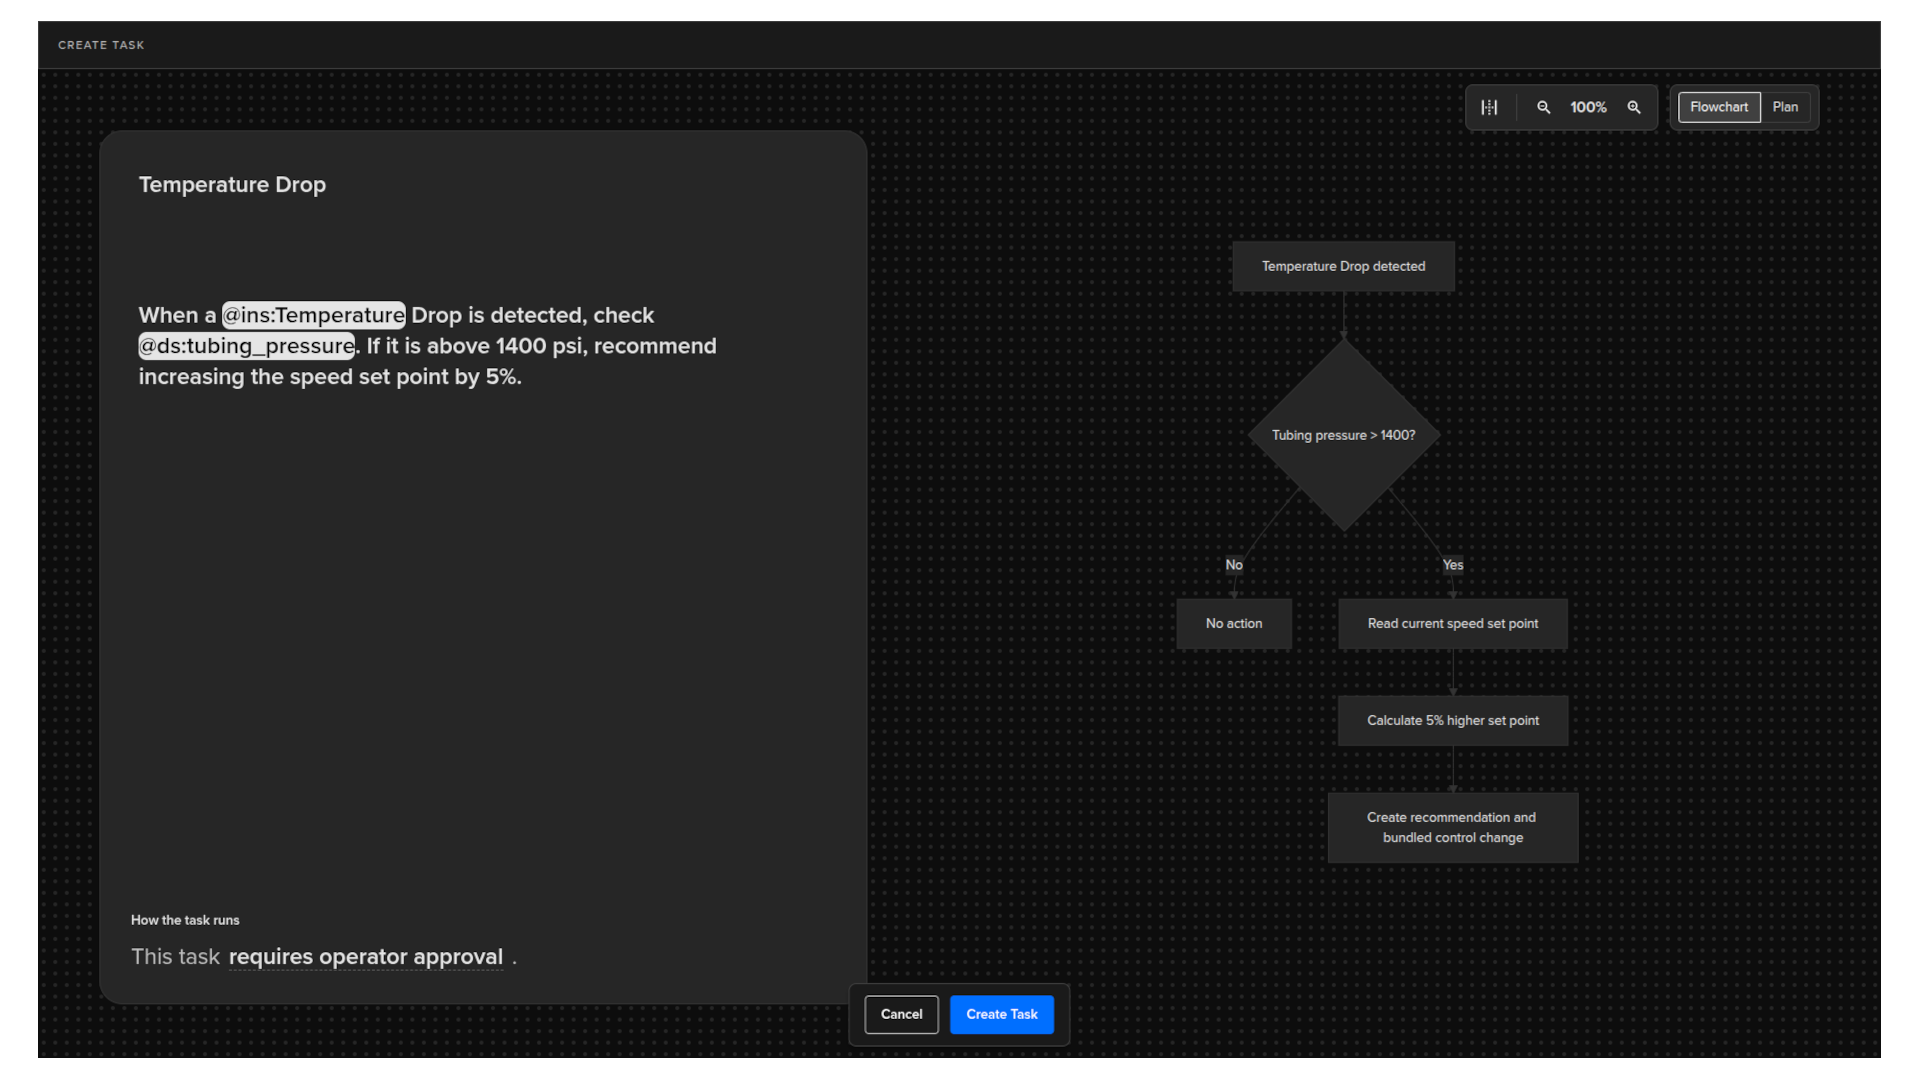
The flowchart
The right side of the screen shows the generated task as a visual flowchart.
You can switch between two views using the toggle in the top right corner:
Note
You can not edit the Flowchart or Plan directly.
TO make adjustments, modify your prompt on the left side and press Enter to initiate the AI to update the flowchart/plan.
- Flowchart: a visual diagram showing the decision branches and actions in the task.
- Plan: a structured text layout of the same logic.
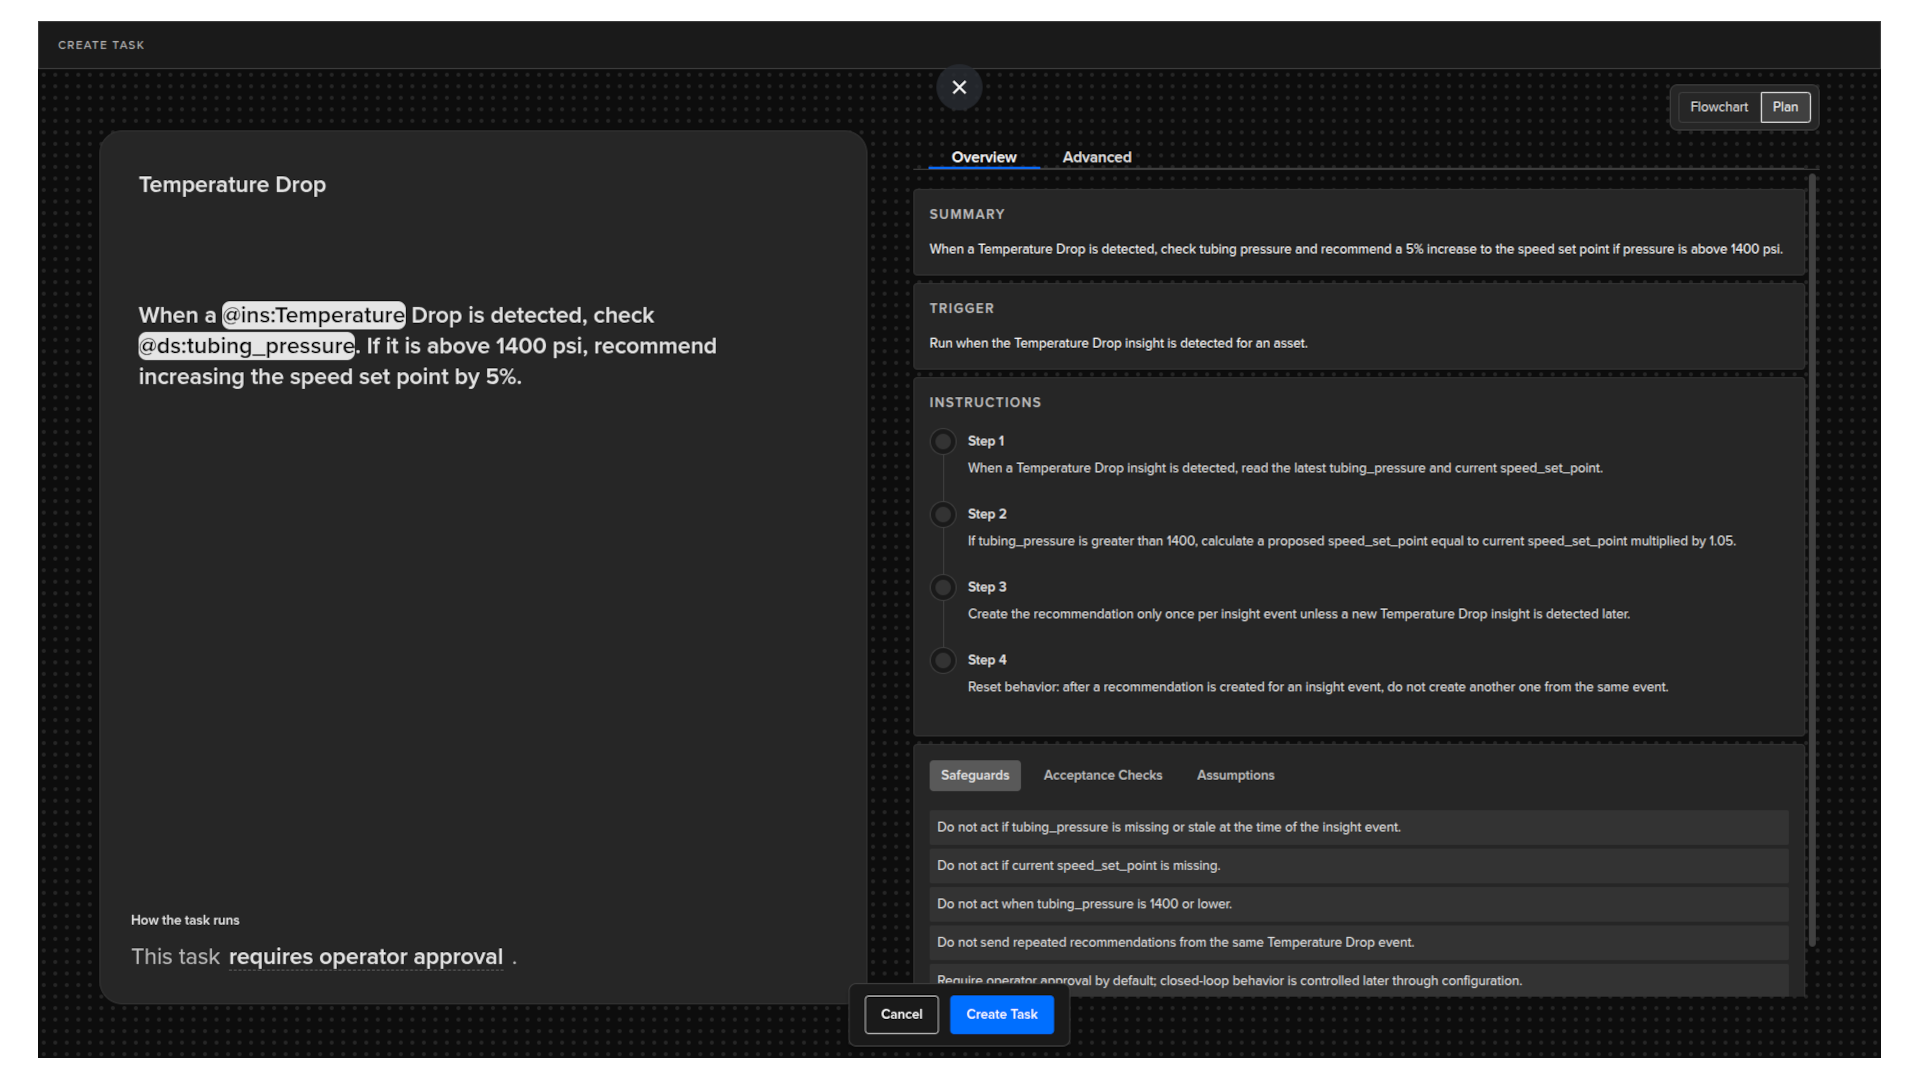
To navigate the flowchart:
- Click and drag to move around the canvas.
- Use the zoom controls to zoom in or out.
- Click the fit-to-page icon to recentre the view and show the full flowchart on screen.
Execution mode
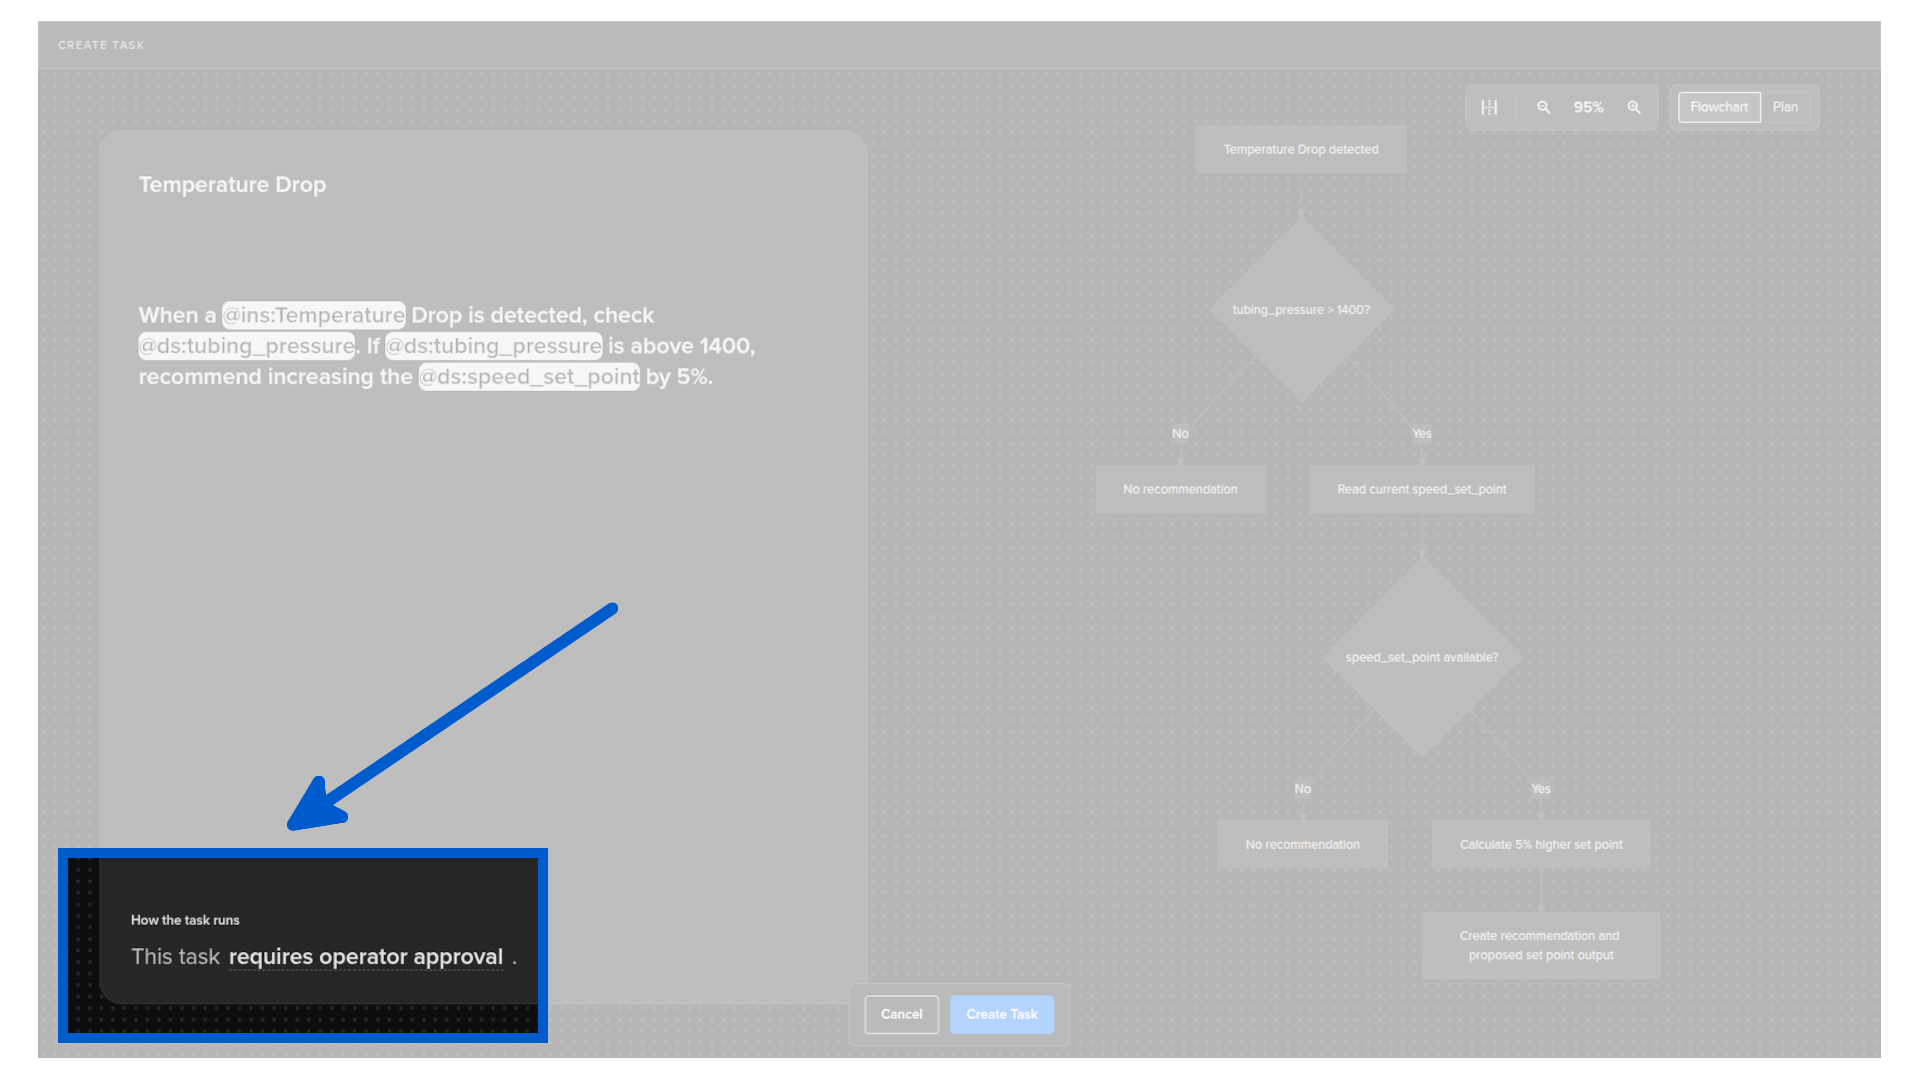
At the bottom of the left panel, choose how the task runs when it detects a matching event:
- Runs autonomously: the task executes its actions automatically without any manual approval.
- Requires operator approval: the task prepares its recommended actions and waits for an operator to approve before anything is executed.
Tune and Save
You can edit your prompt on the left side at any time and the flowchart/plan will update to reflect your changes. Keep refining the prompt until the flowchart matches exactly how you want the task to respond.
Note
The task that is created uses standard logic-based execution. AI is not involved in carrying out the actions when the task runs. The AI is only used to help you define and create the logic.
When you are satisfied, click Create Task to save.
Task Impact Metrics
After clicking Create Task, a popup appears where you can configure the expected time saved per task output. This feeds directly into the Impact dashboard.
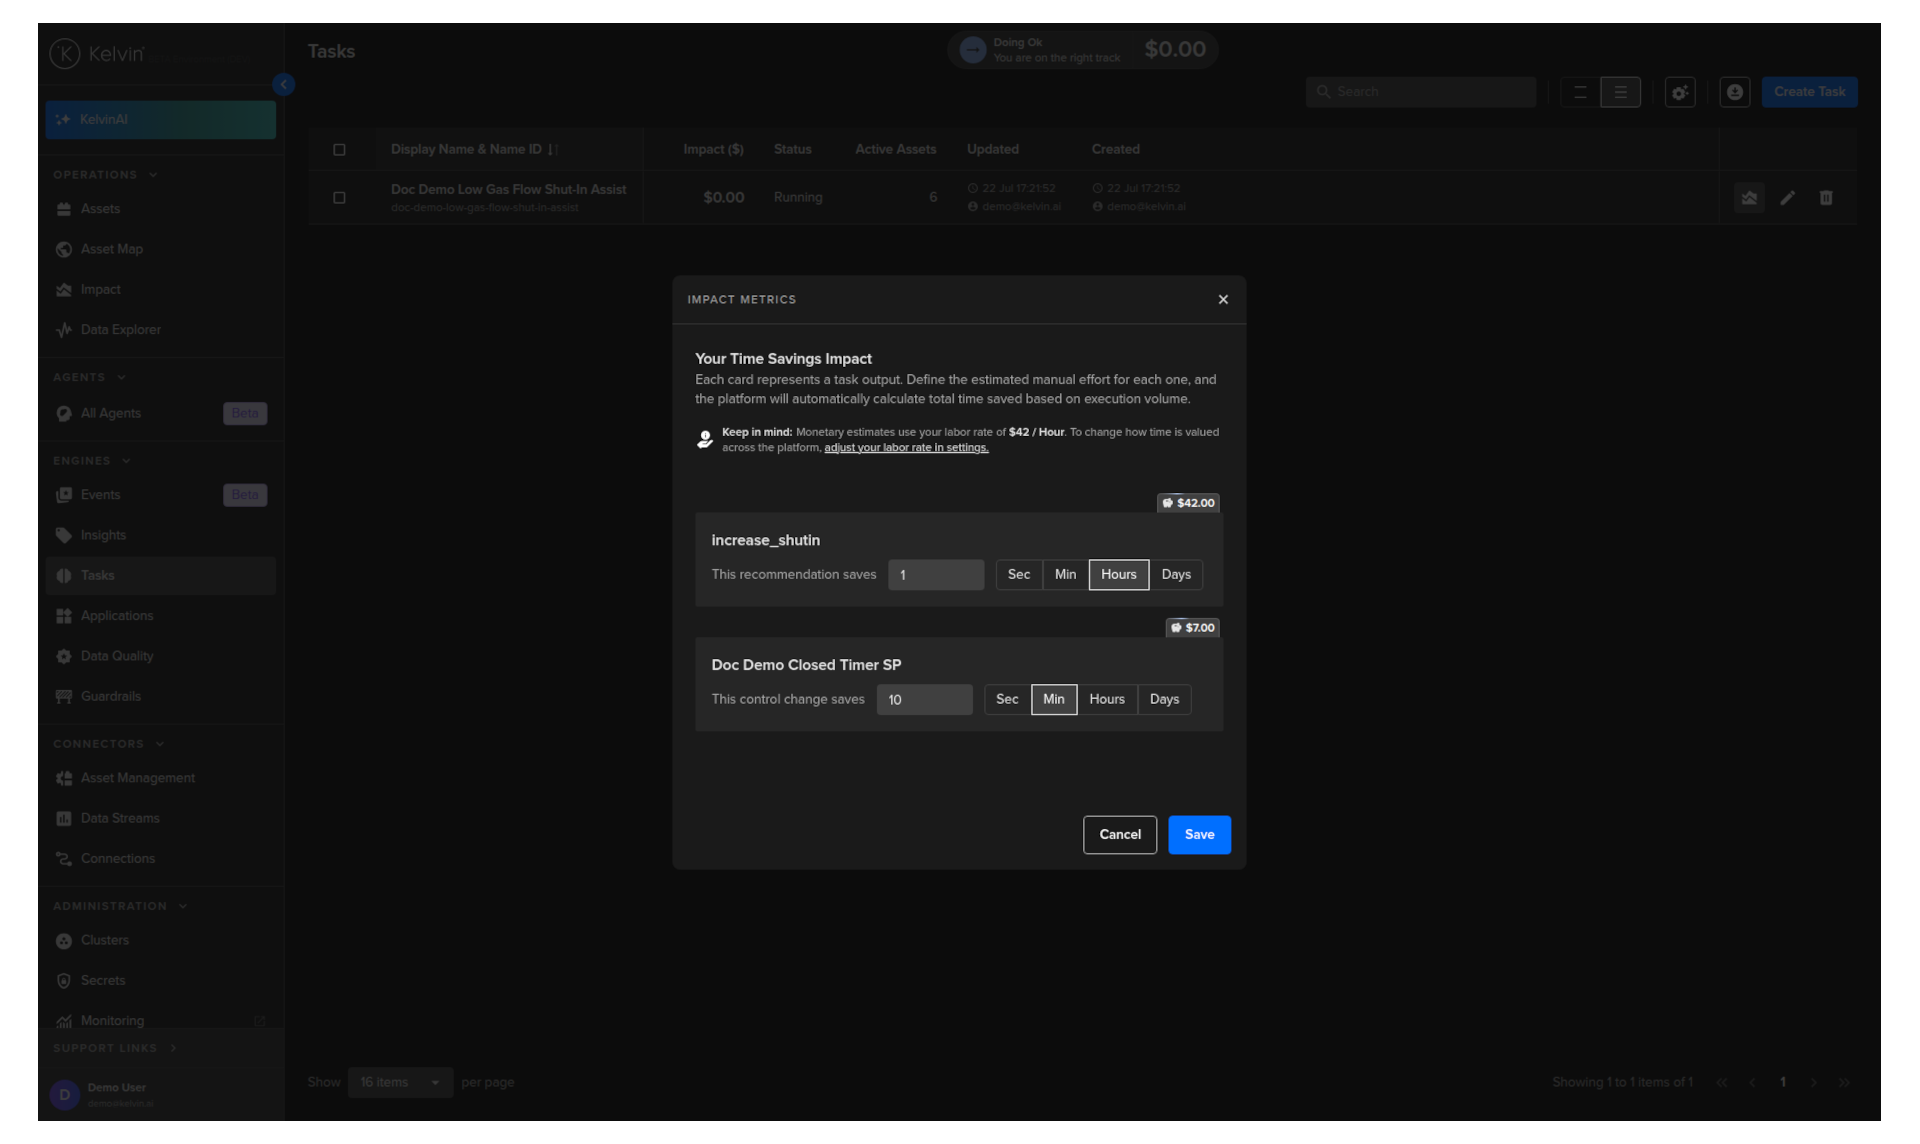
For each recommendation and control change the task produces, enter the estimated time saved and choose the time unit (Seconds, Minutes, Hours, or Days). The monetary value is calculated automatically using the Cost of Labor rate from your Economic Parameters.
Note
This step is optional. You can skip it now and configure or update it at any time from the Tasks overview using the Impact Metrics icon on the task row.
You can also backdate the start of impact calculations, so historical executions are included in the totals.
Click Save to confirm the impact settings, or Cancel to skip and go straight to the Tasks overview.
Edit Impact Metrics
You can edit the Impact Metrics configurations by clicking on the icon in the Task row.
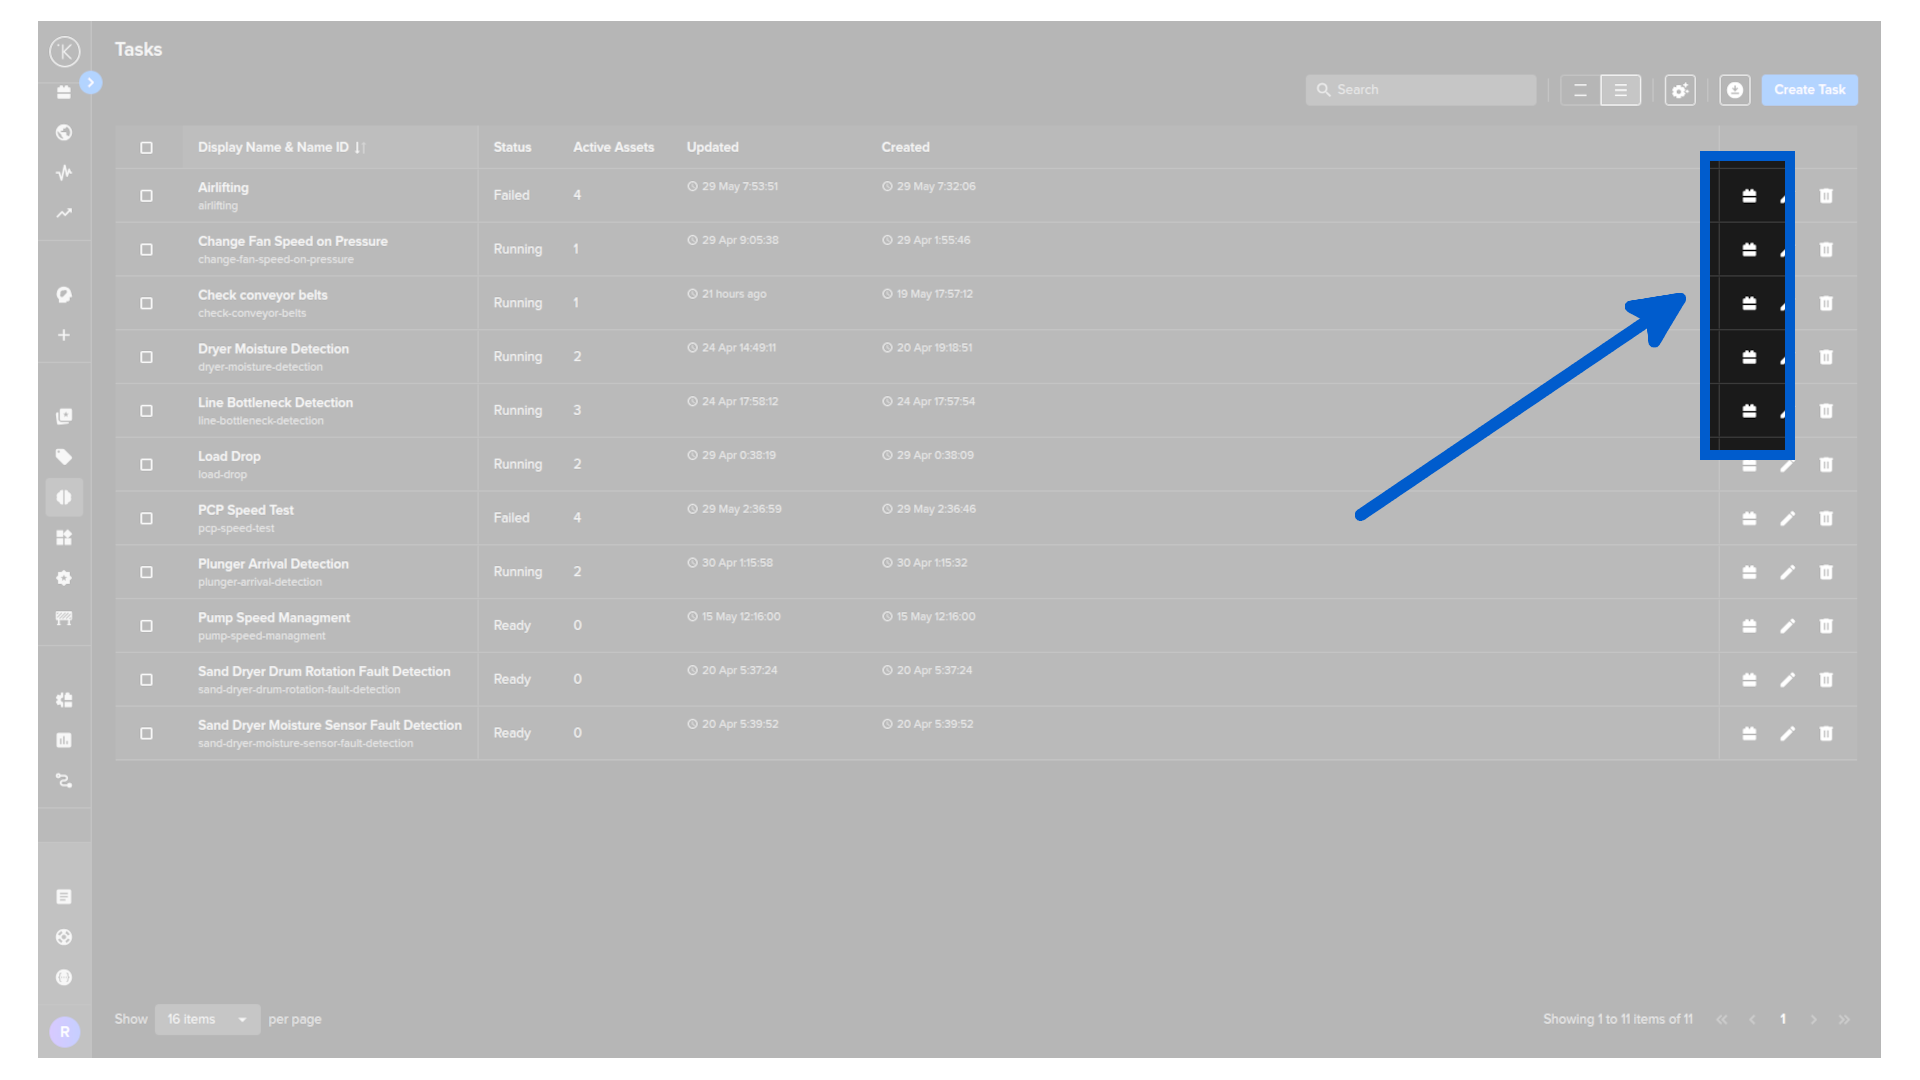
Then you can update the configuration values.
Tasks Overview
After saving, you are taken to the Tasks overview table. You can also reach it at any time by clicking Tasks in the left sidebar under Engines.
The table lists all tasks that have been created, with their current status and activity.
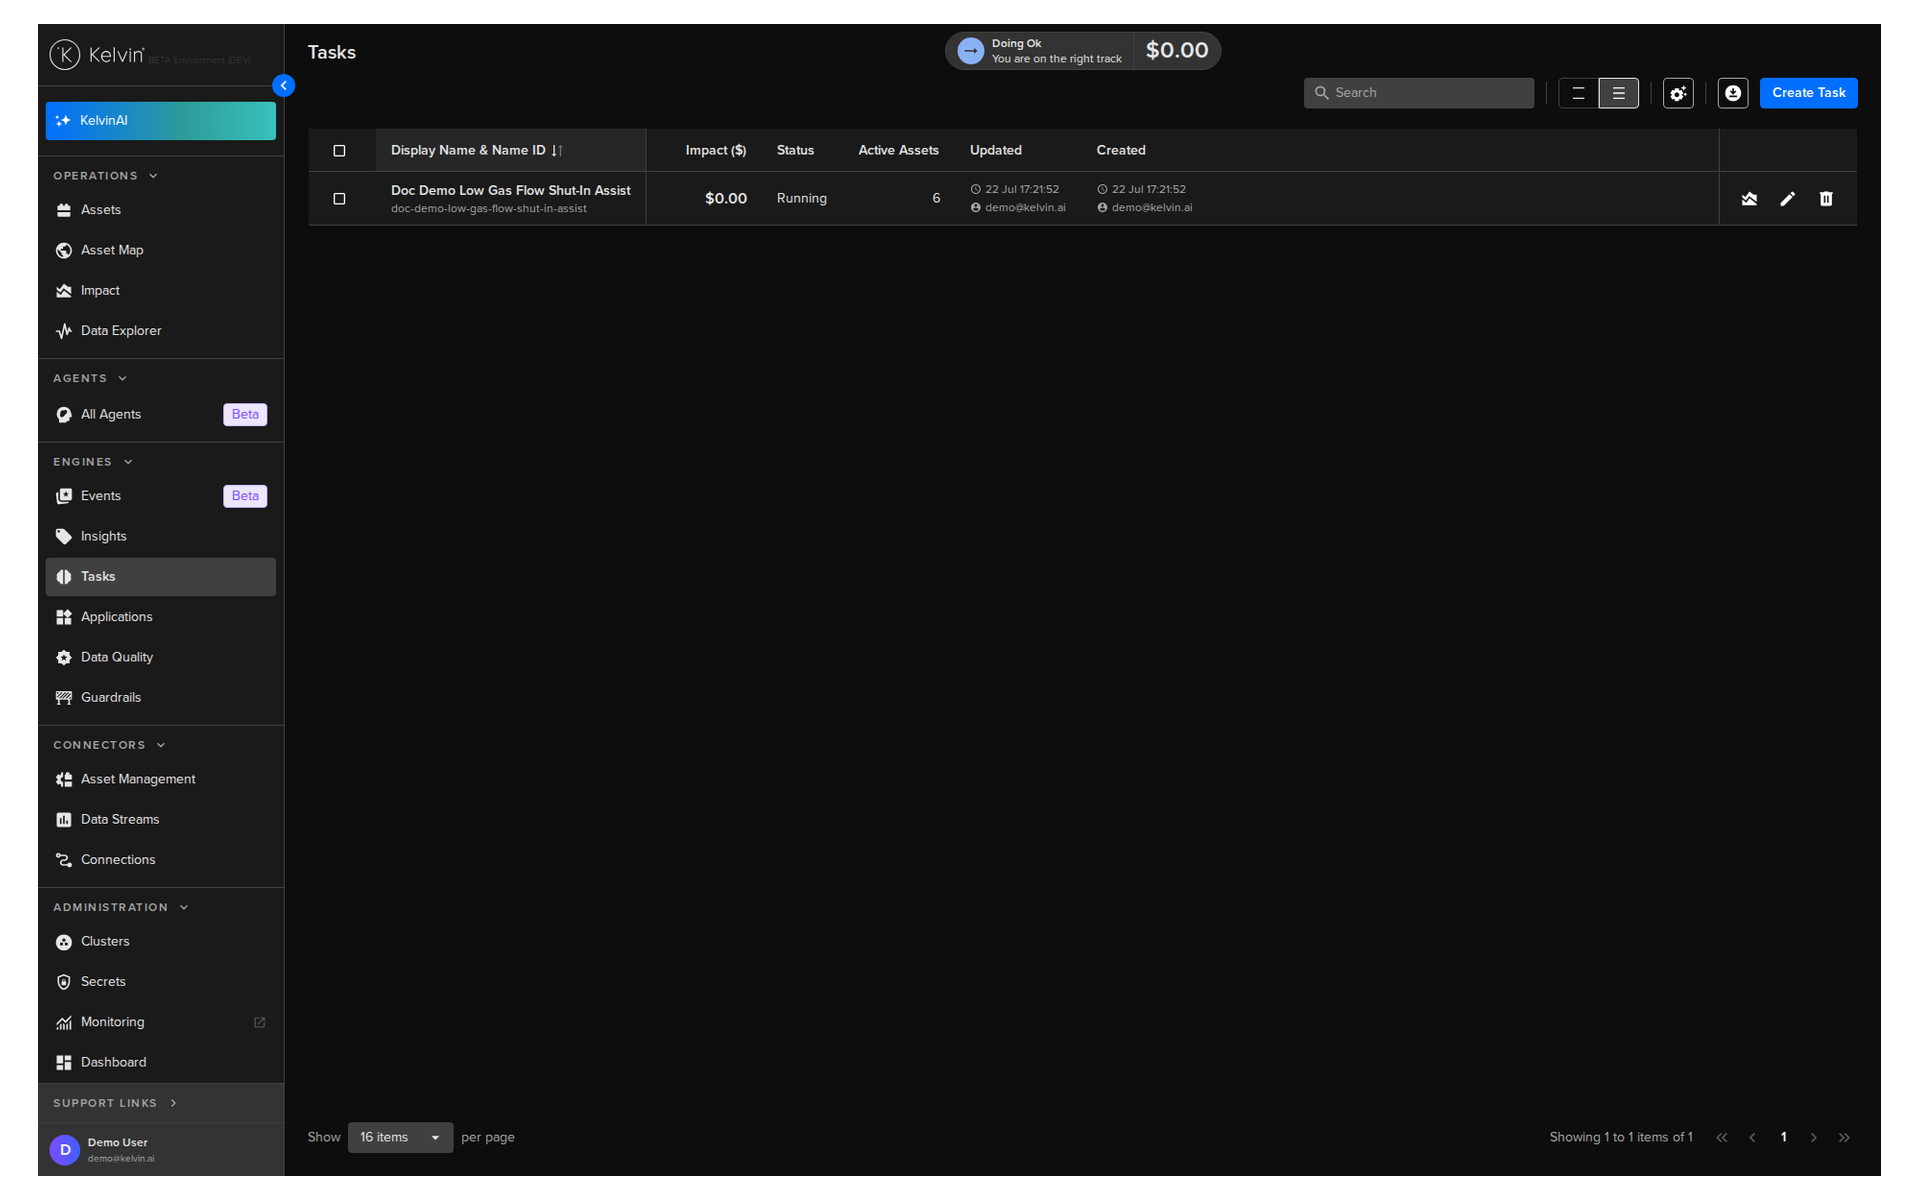
Impact Widget
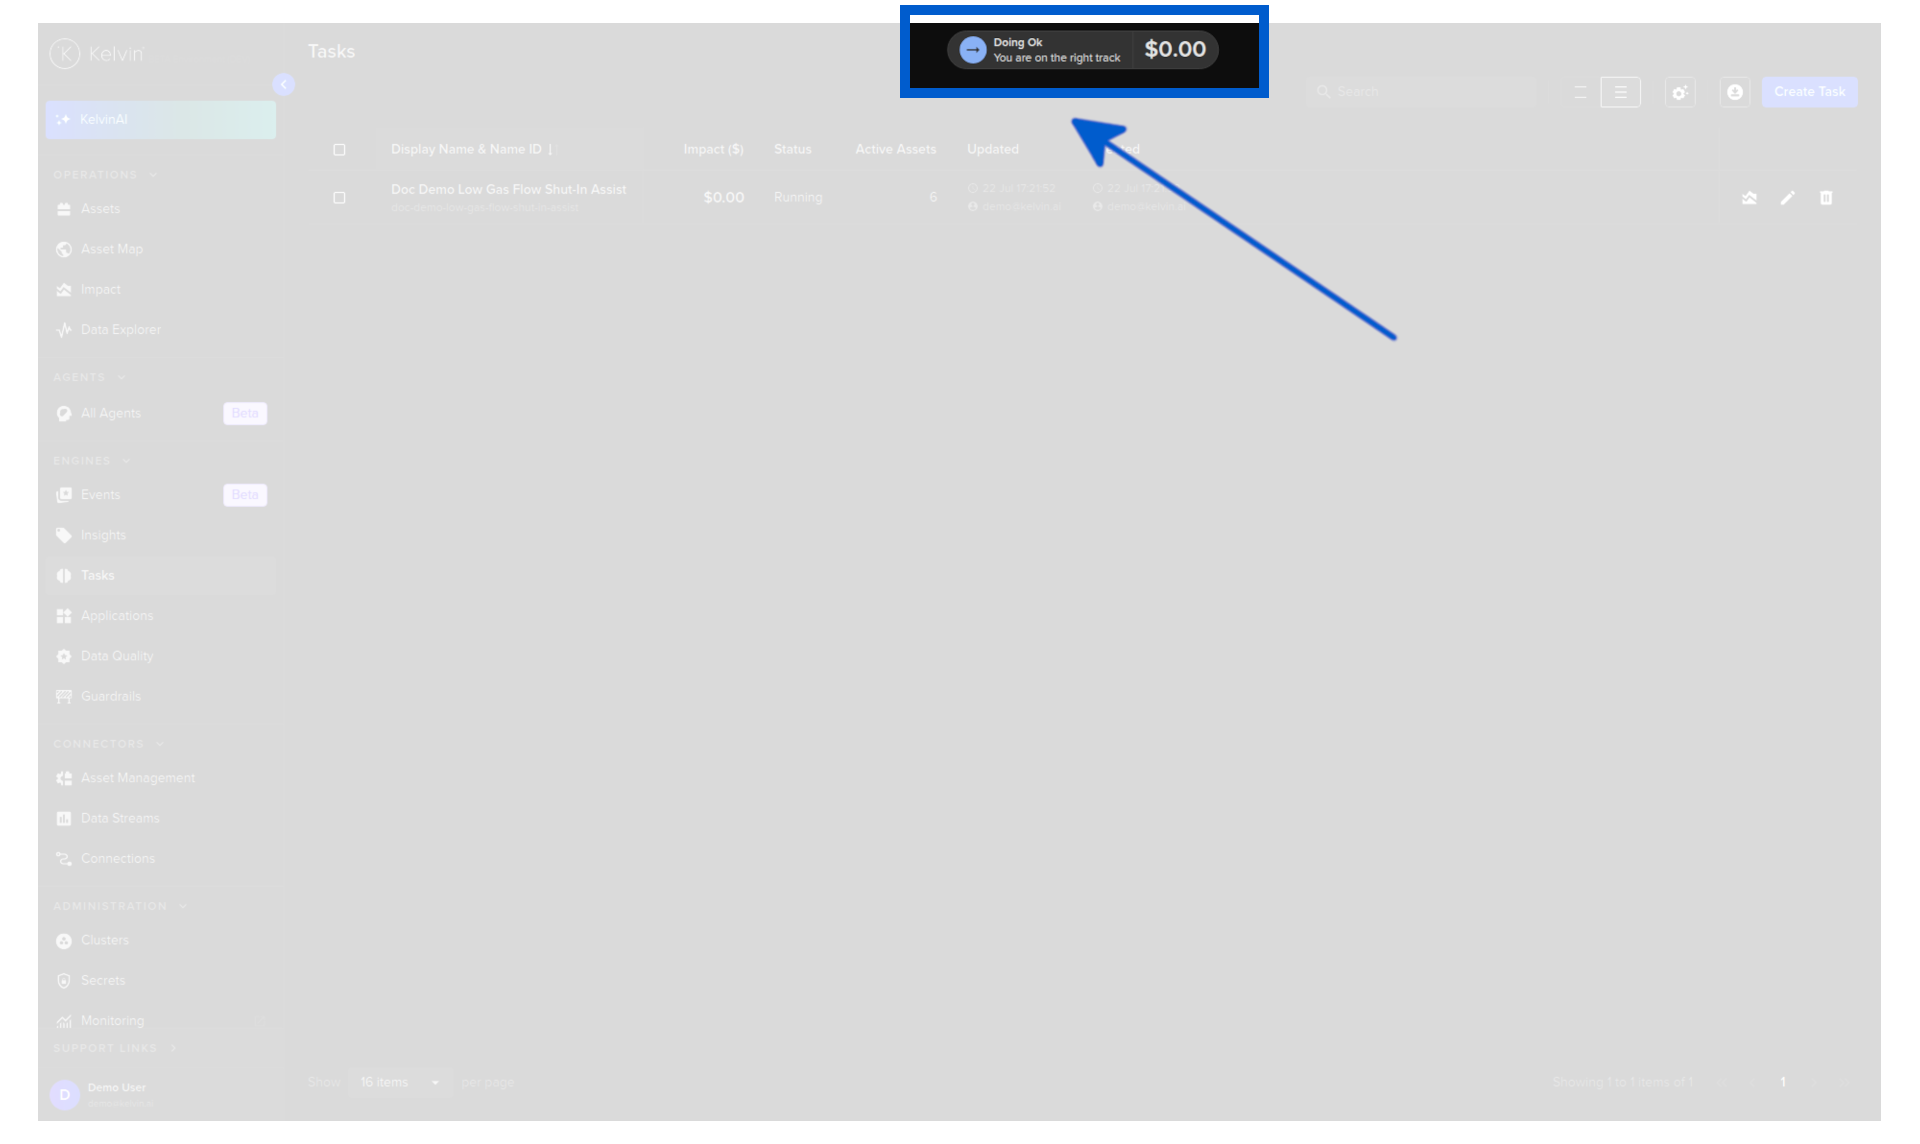
At the top of the Tasks overview there is an Impact widget showing the current overall impact metrics for the tasks visible in the table. The figures update as you filter or search, always reflecting the tasks currently shown.
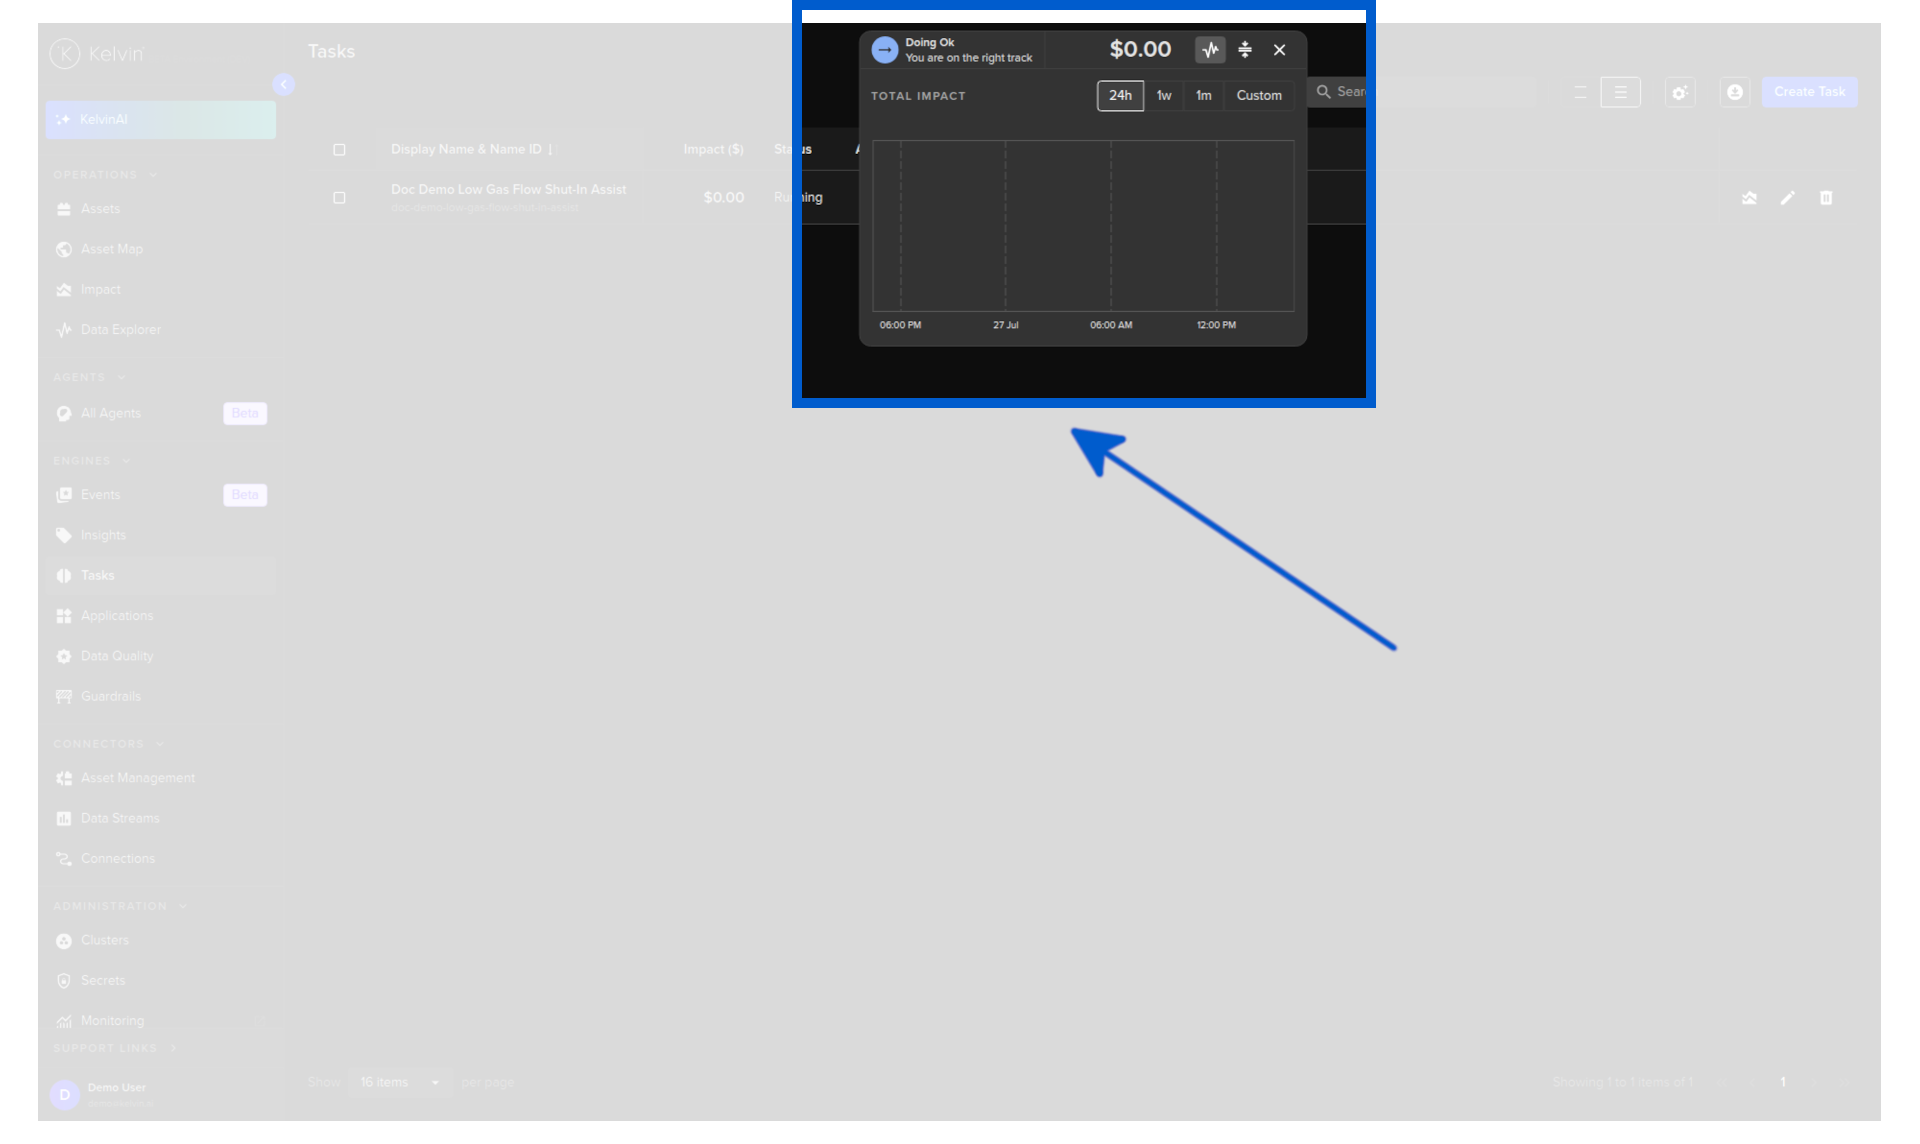
To view the historical trend of the overall impact, click the graph icon in the widget. This expands a chart showing how the cumulative impact has developed over time for the current selection.
Basic features
The Tasks overview includes several features to help you find and manage your tasks.
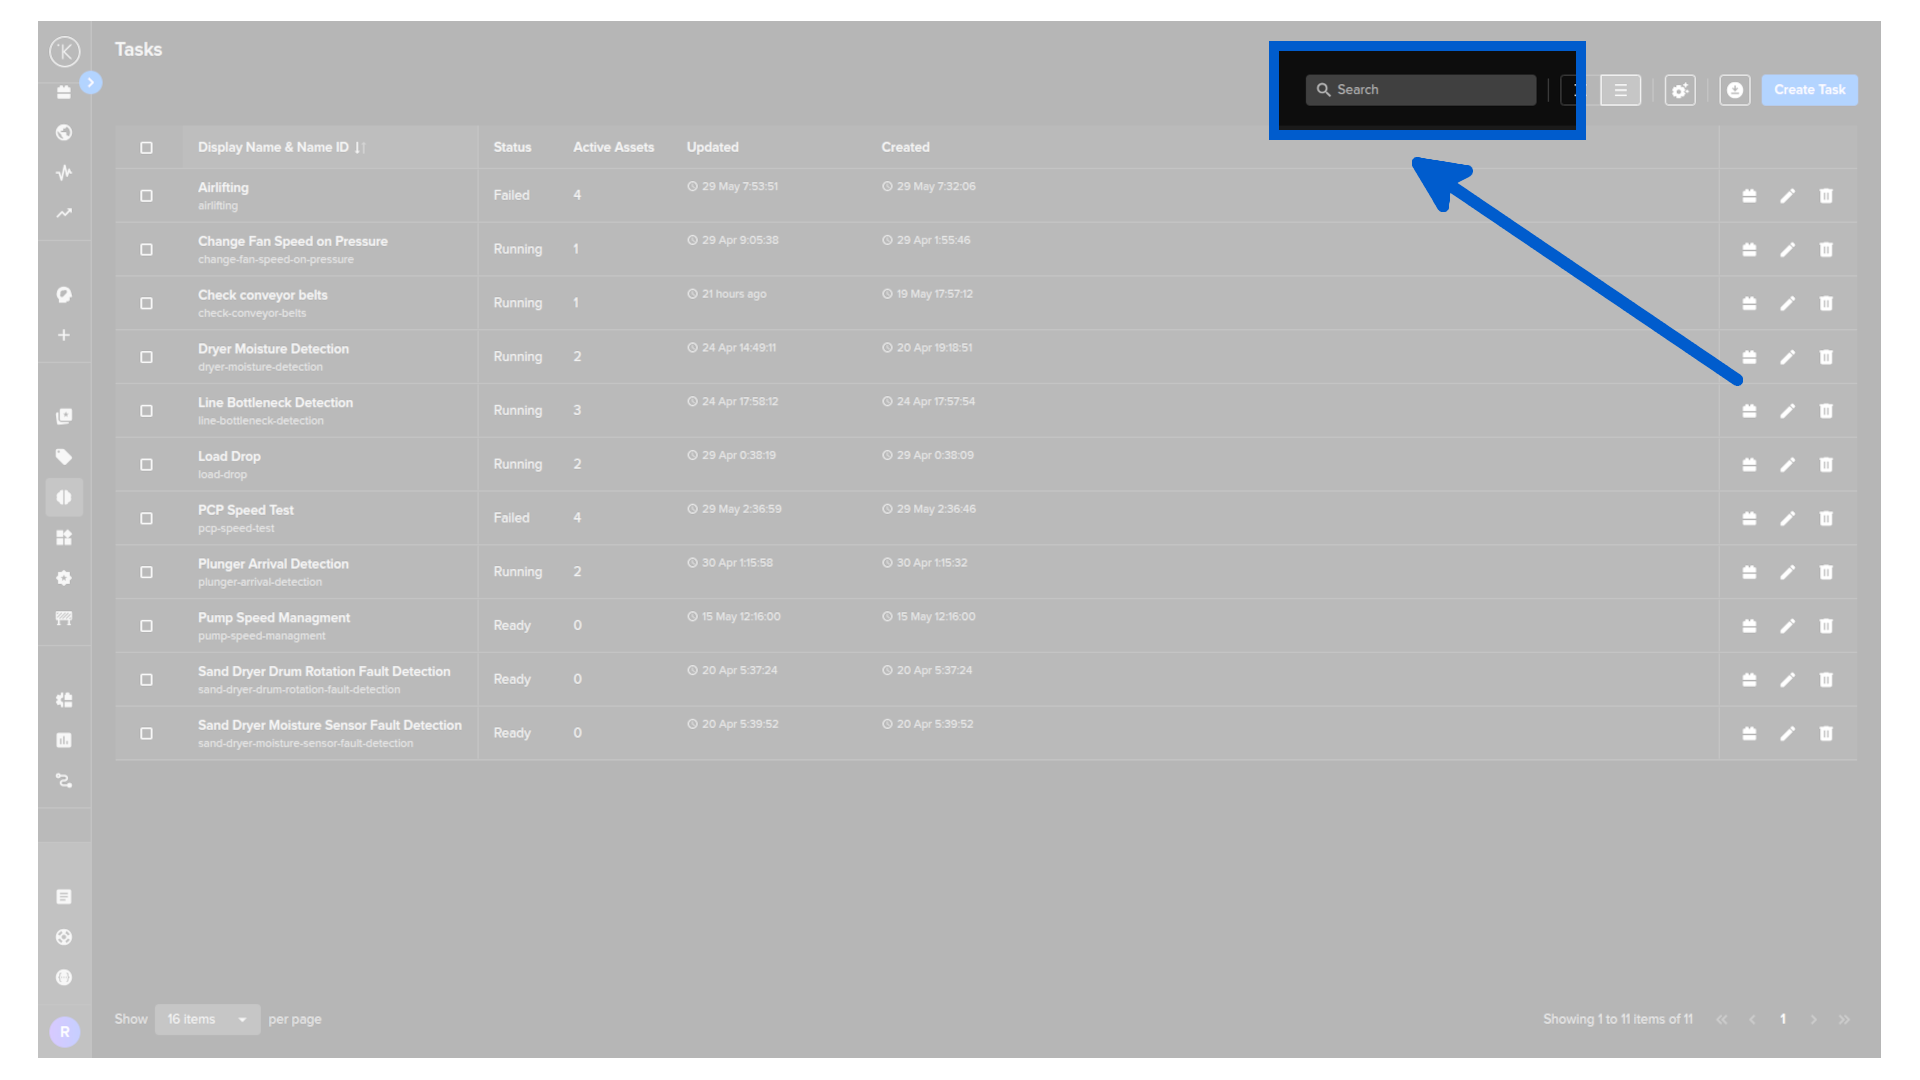
Use the search bar at the top right to find tasks by name. The list filters as you type.
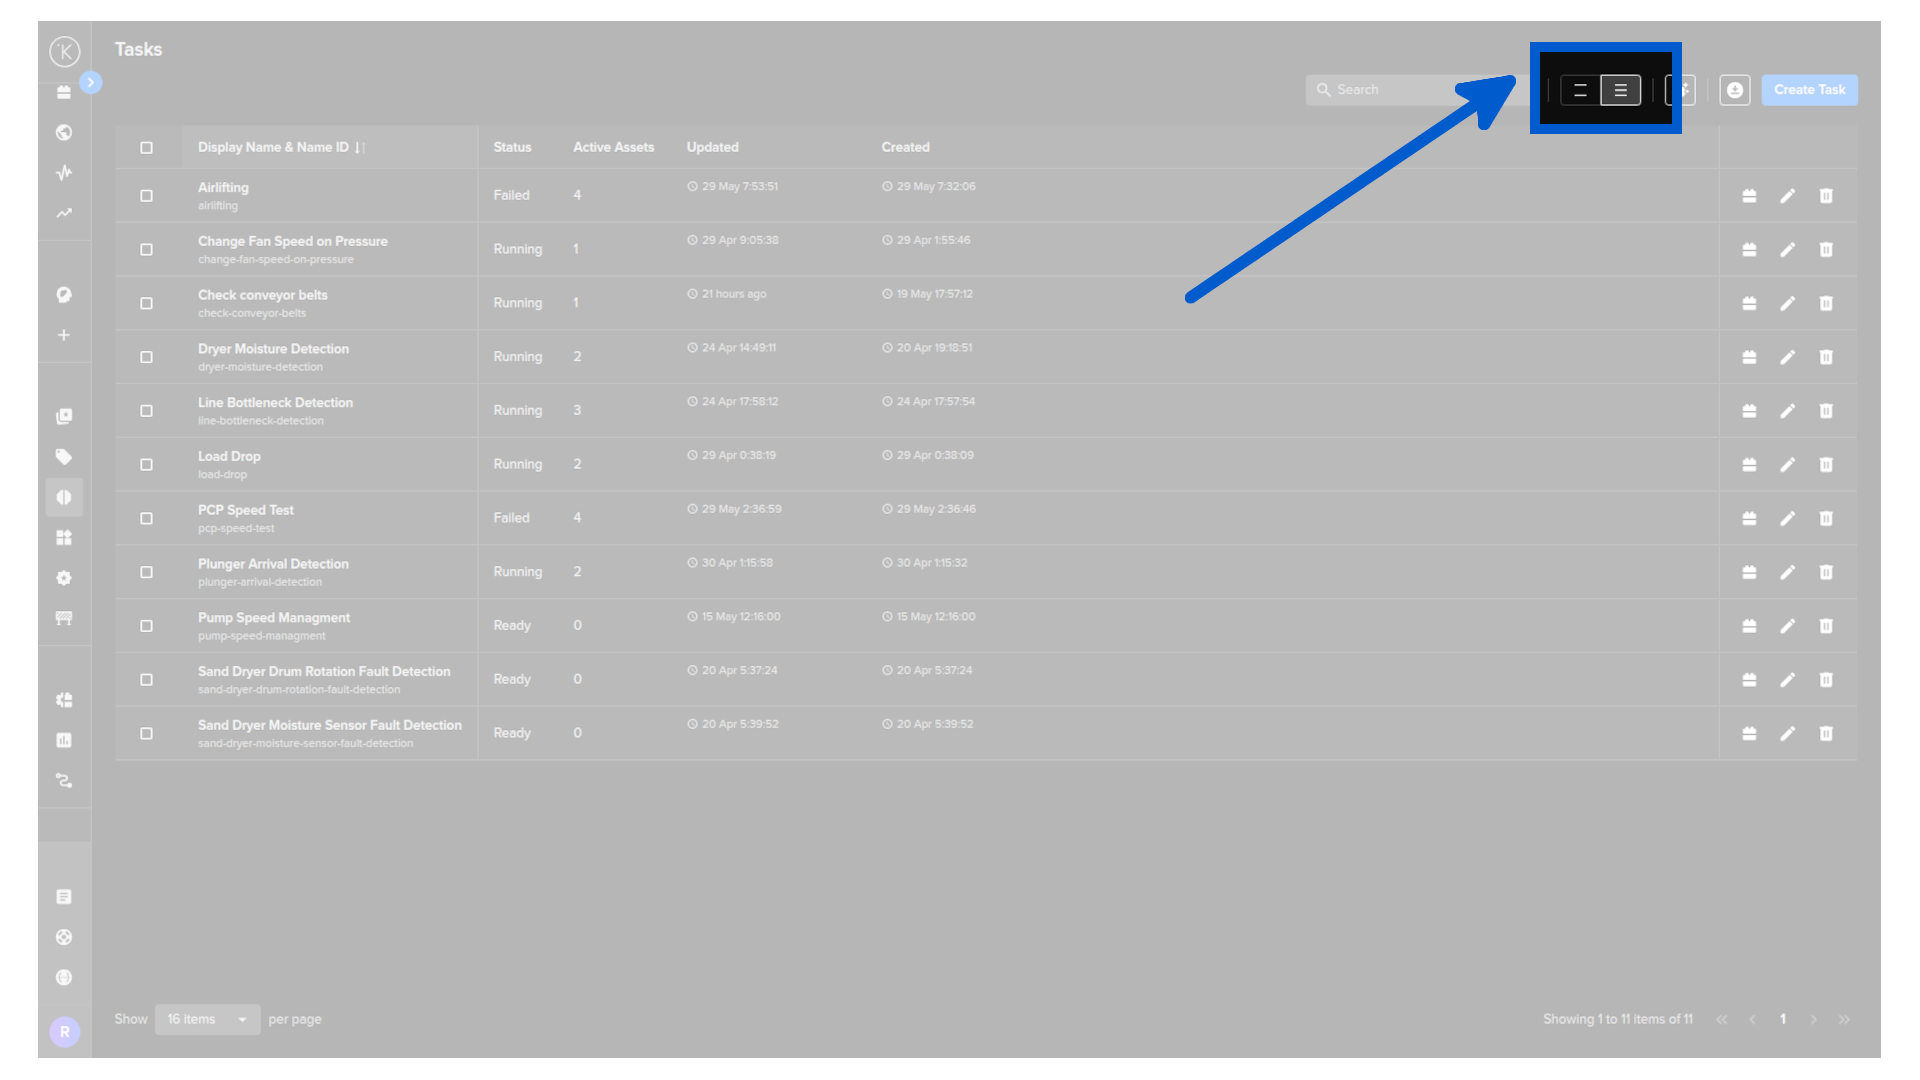
Use the row spacing control to adjust how compact or spaced out the rows appear.
Click the download icon to export the table as a CSV file. The export contains exactly the columns and rows visible on screen at the time of download.
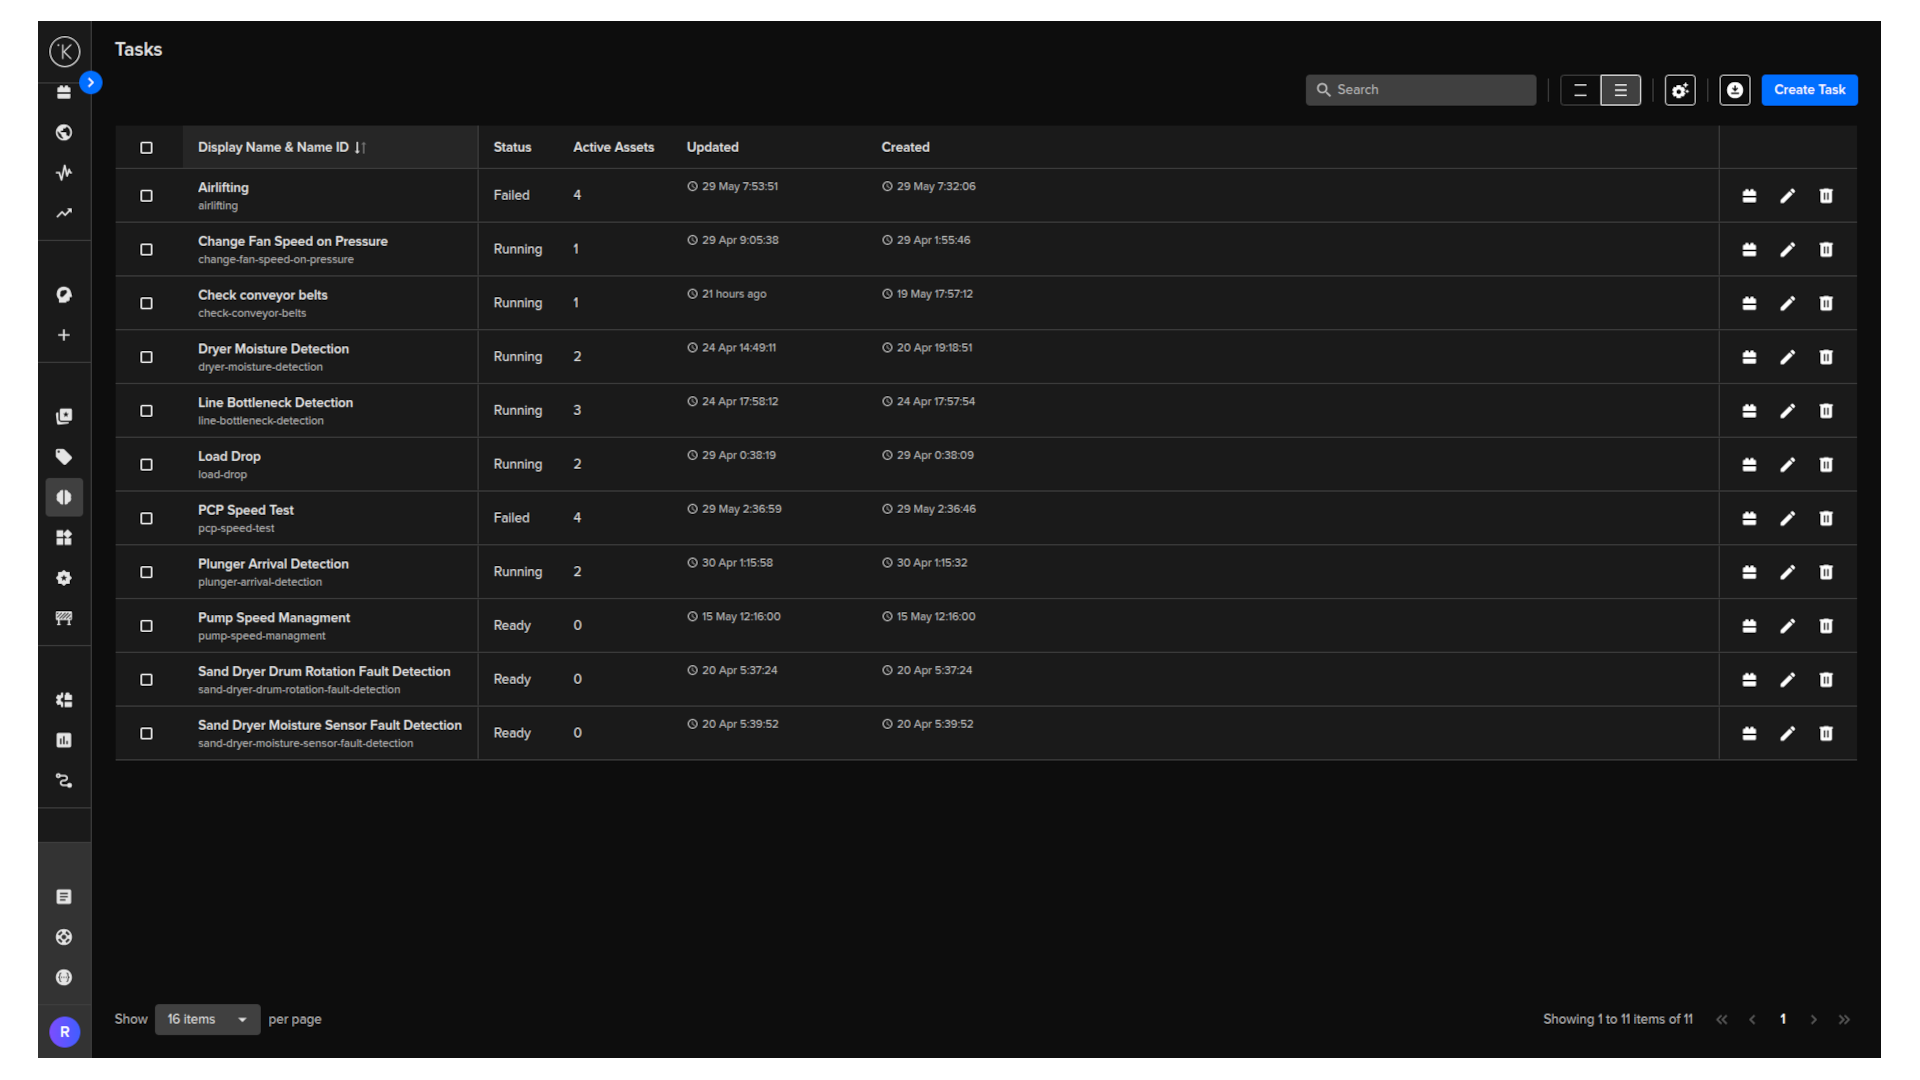
Table columns
The Tasks table has a fixed set of columns. You can reorder, freeze, hide, or show them, but no custom columns can be added.
| Column | Description |
|---|---|
| Display Name & Name ID | The task name and its system identifier. This column is frozen to the left by default. |
| Status | The current state of the task: Running, Ready, or Failed. |
| Active Assets | The number of assets the task is currently monitoring. |
| Updated | When the task was last modified, and by whom. |
| Created | When the task was created, and by whom. |
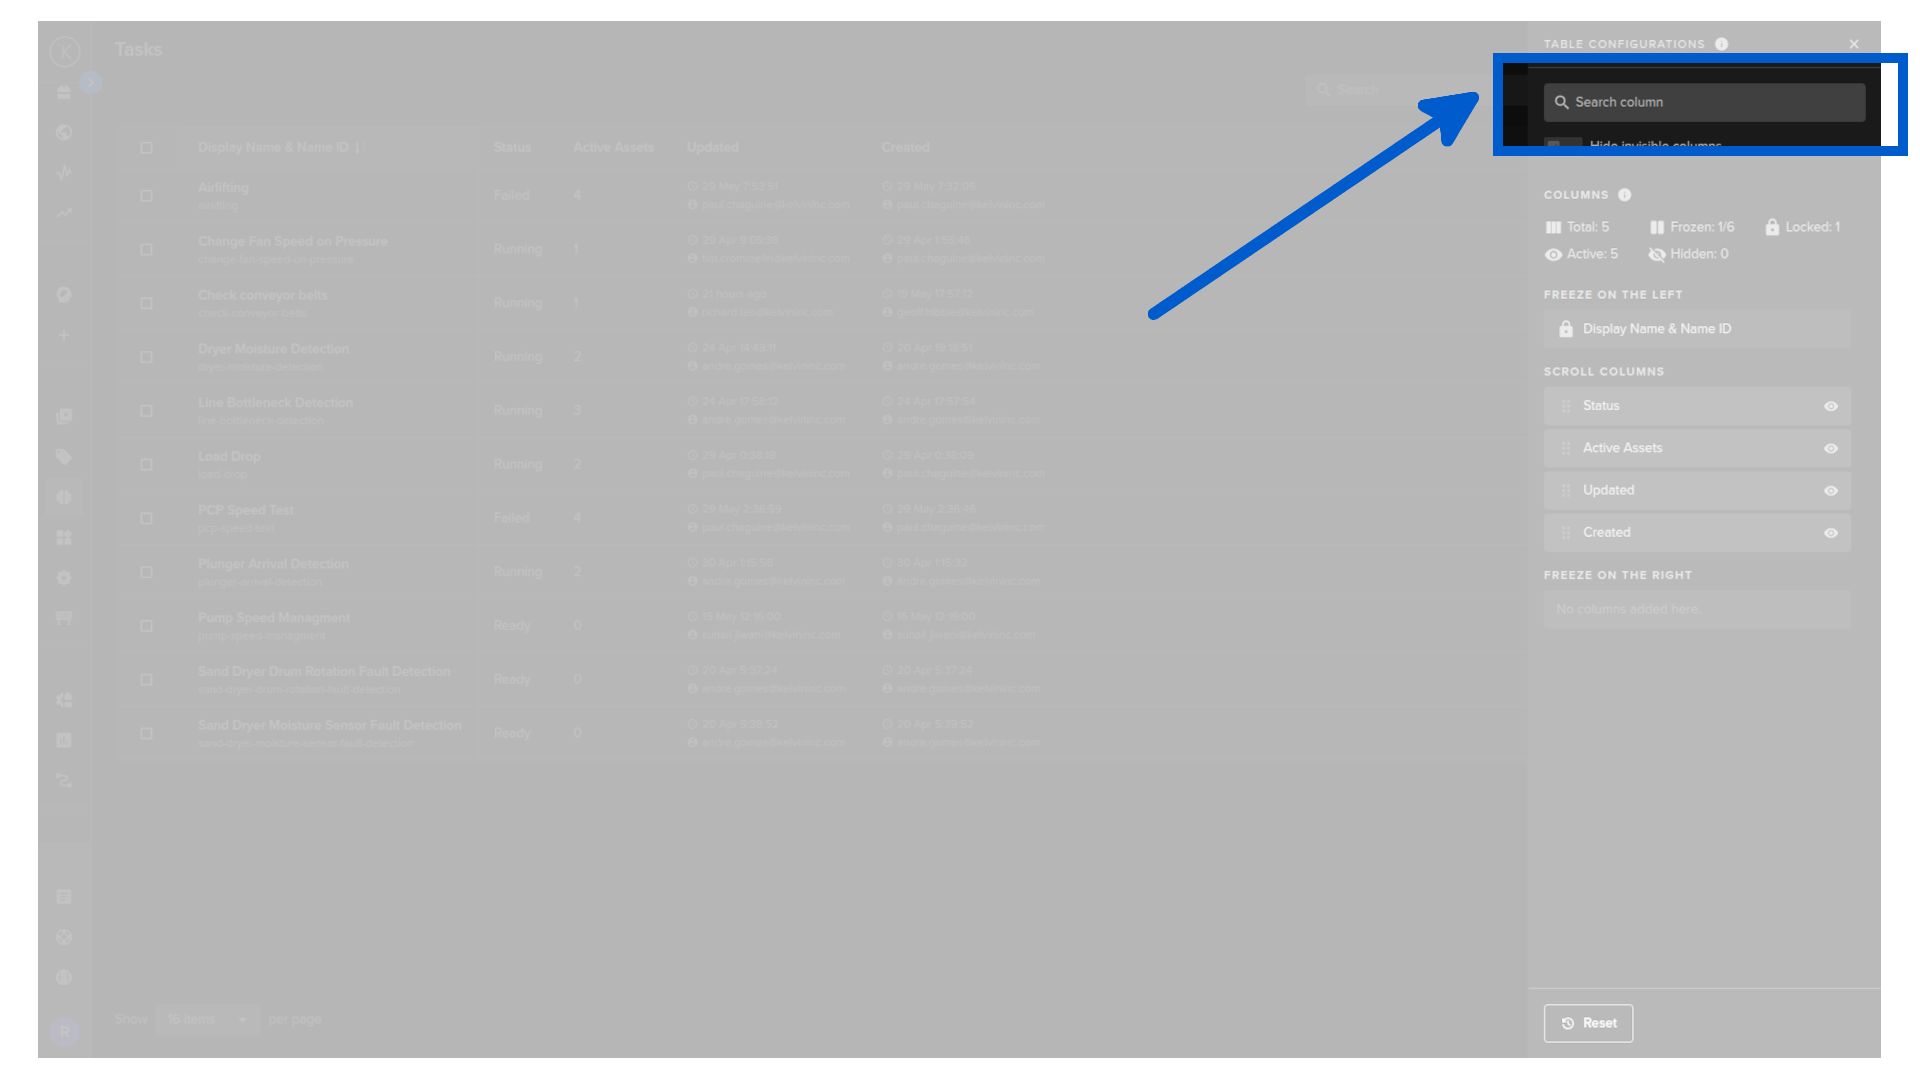
To edit the column header, click on the Configuration icon.
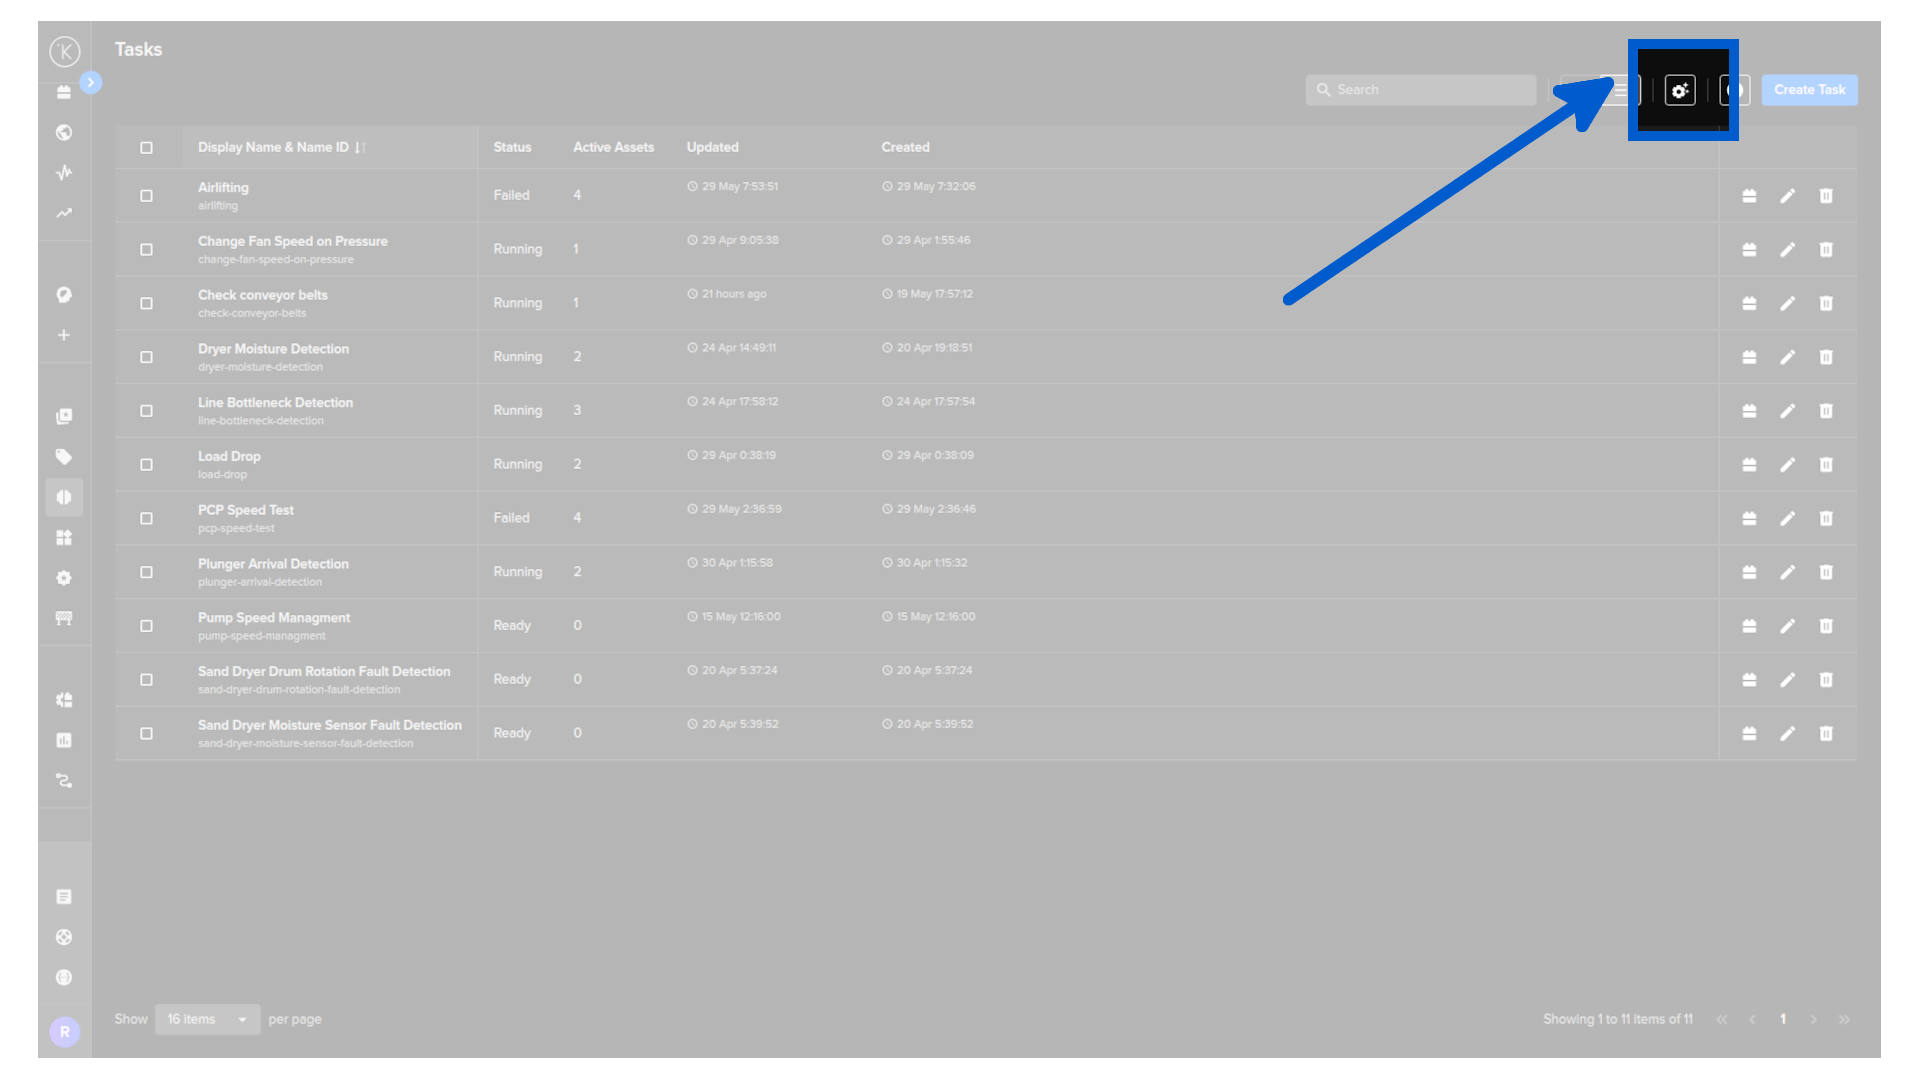
And the table column configuration menu will appear.
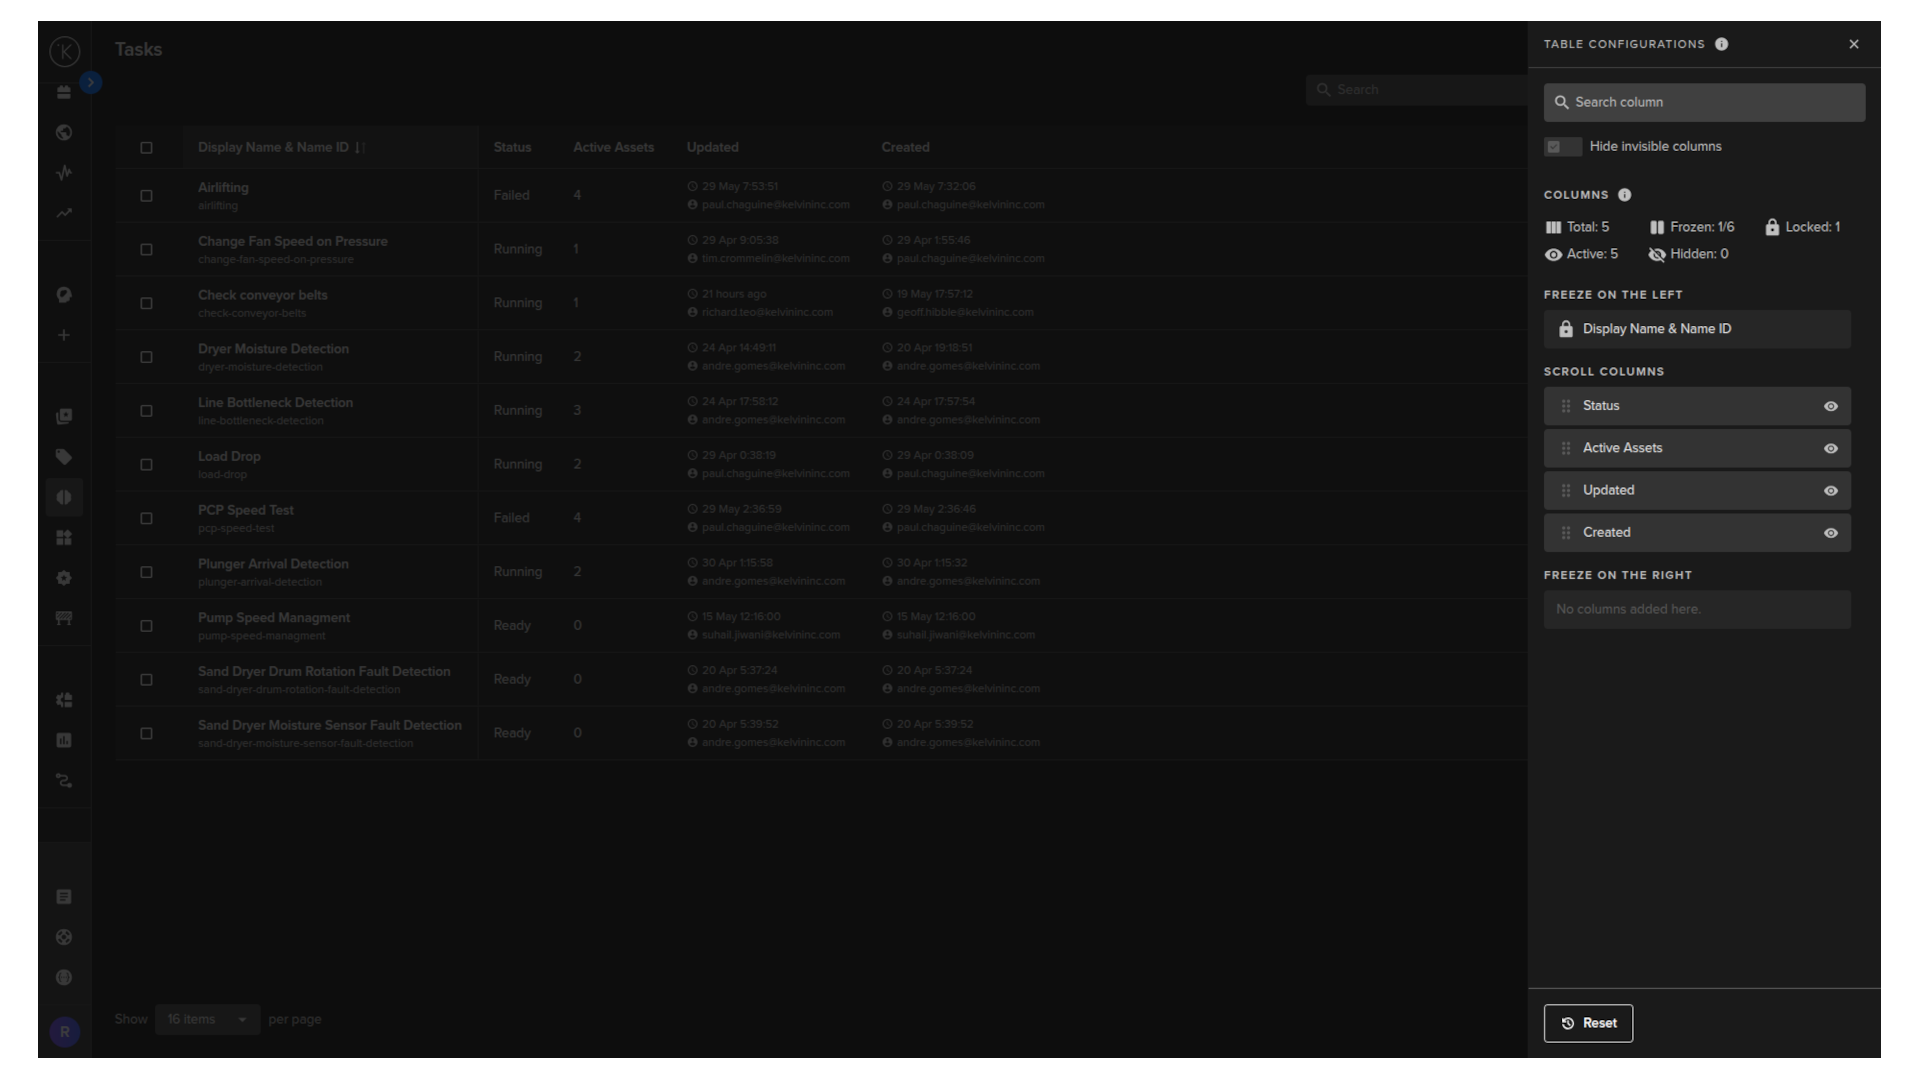
When you are inside the column settings you can freeze columns left and right. This ensures the columns will always show, even when you scroll left or right to see all the columns.
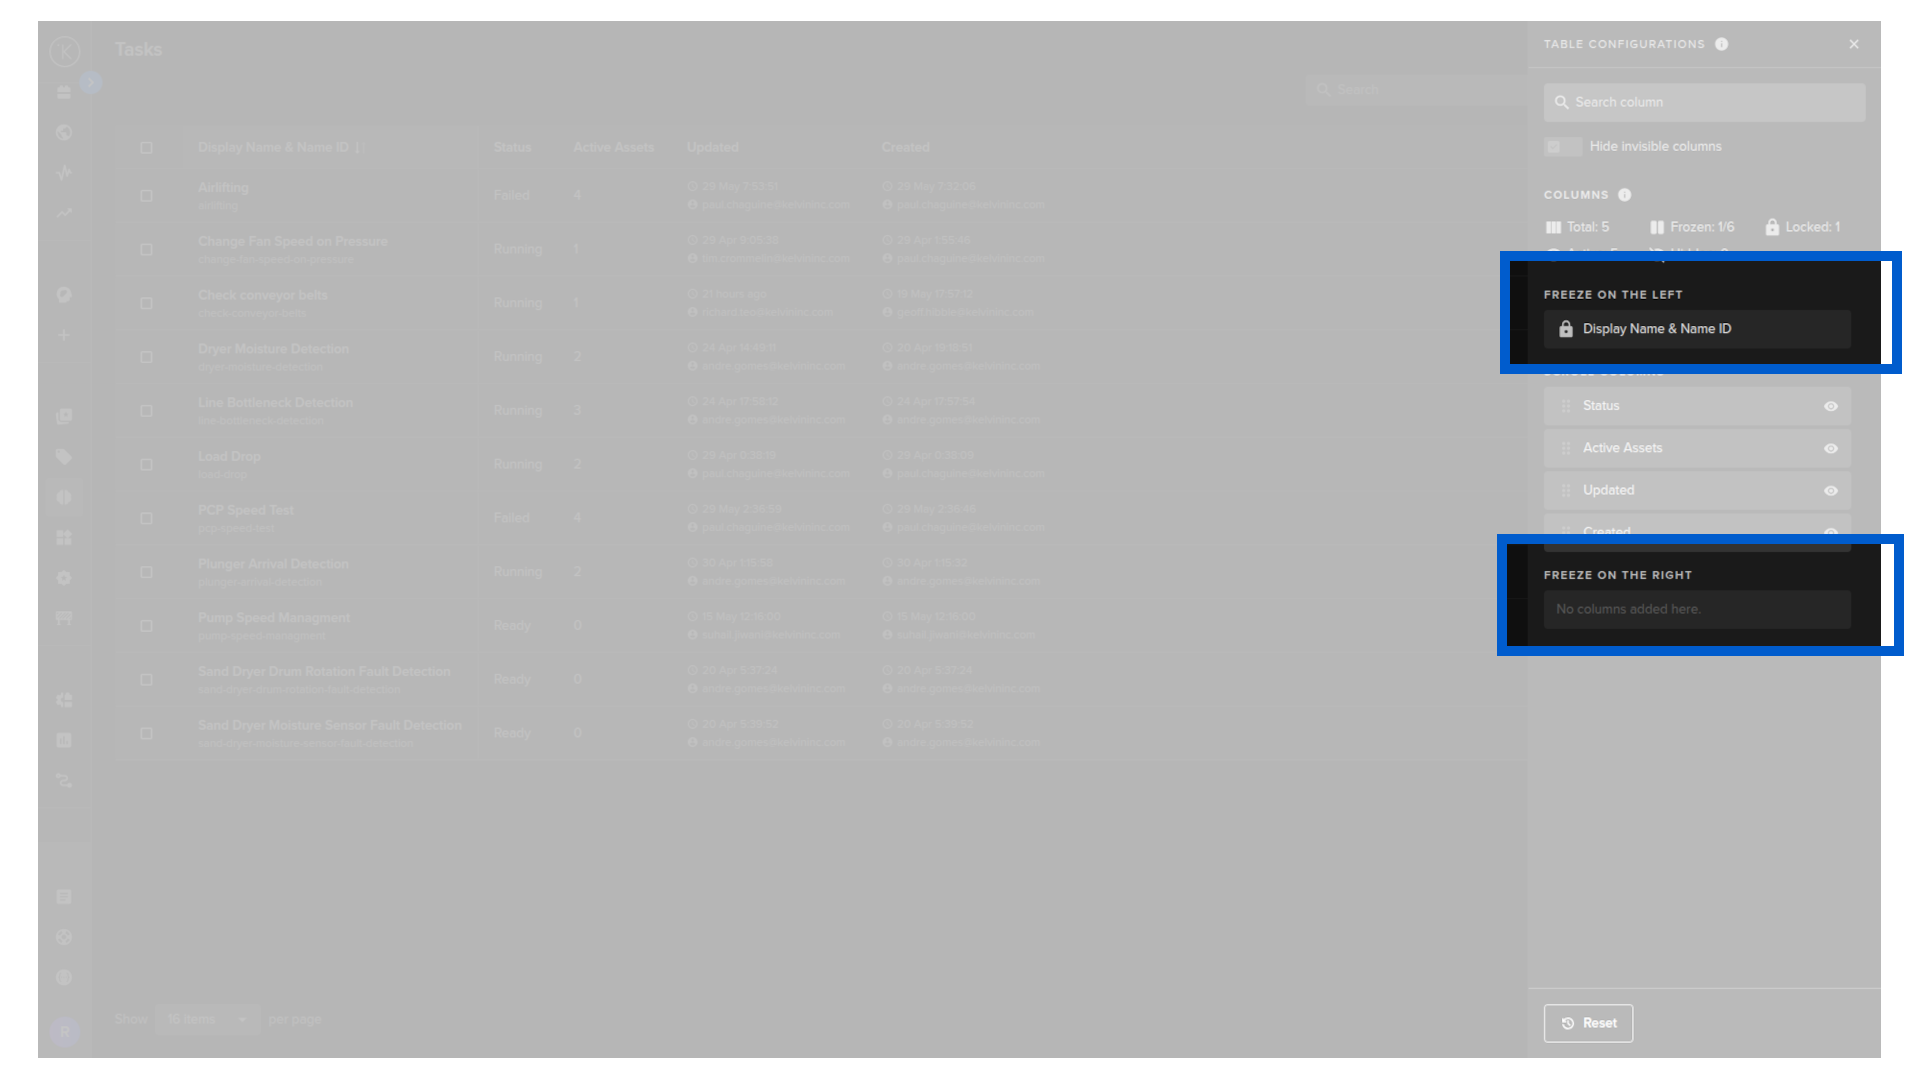
When you are inside the column settings you can show or hide columns to ensure you only see what you need to see.
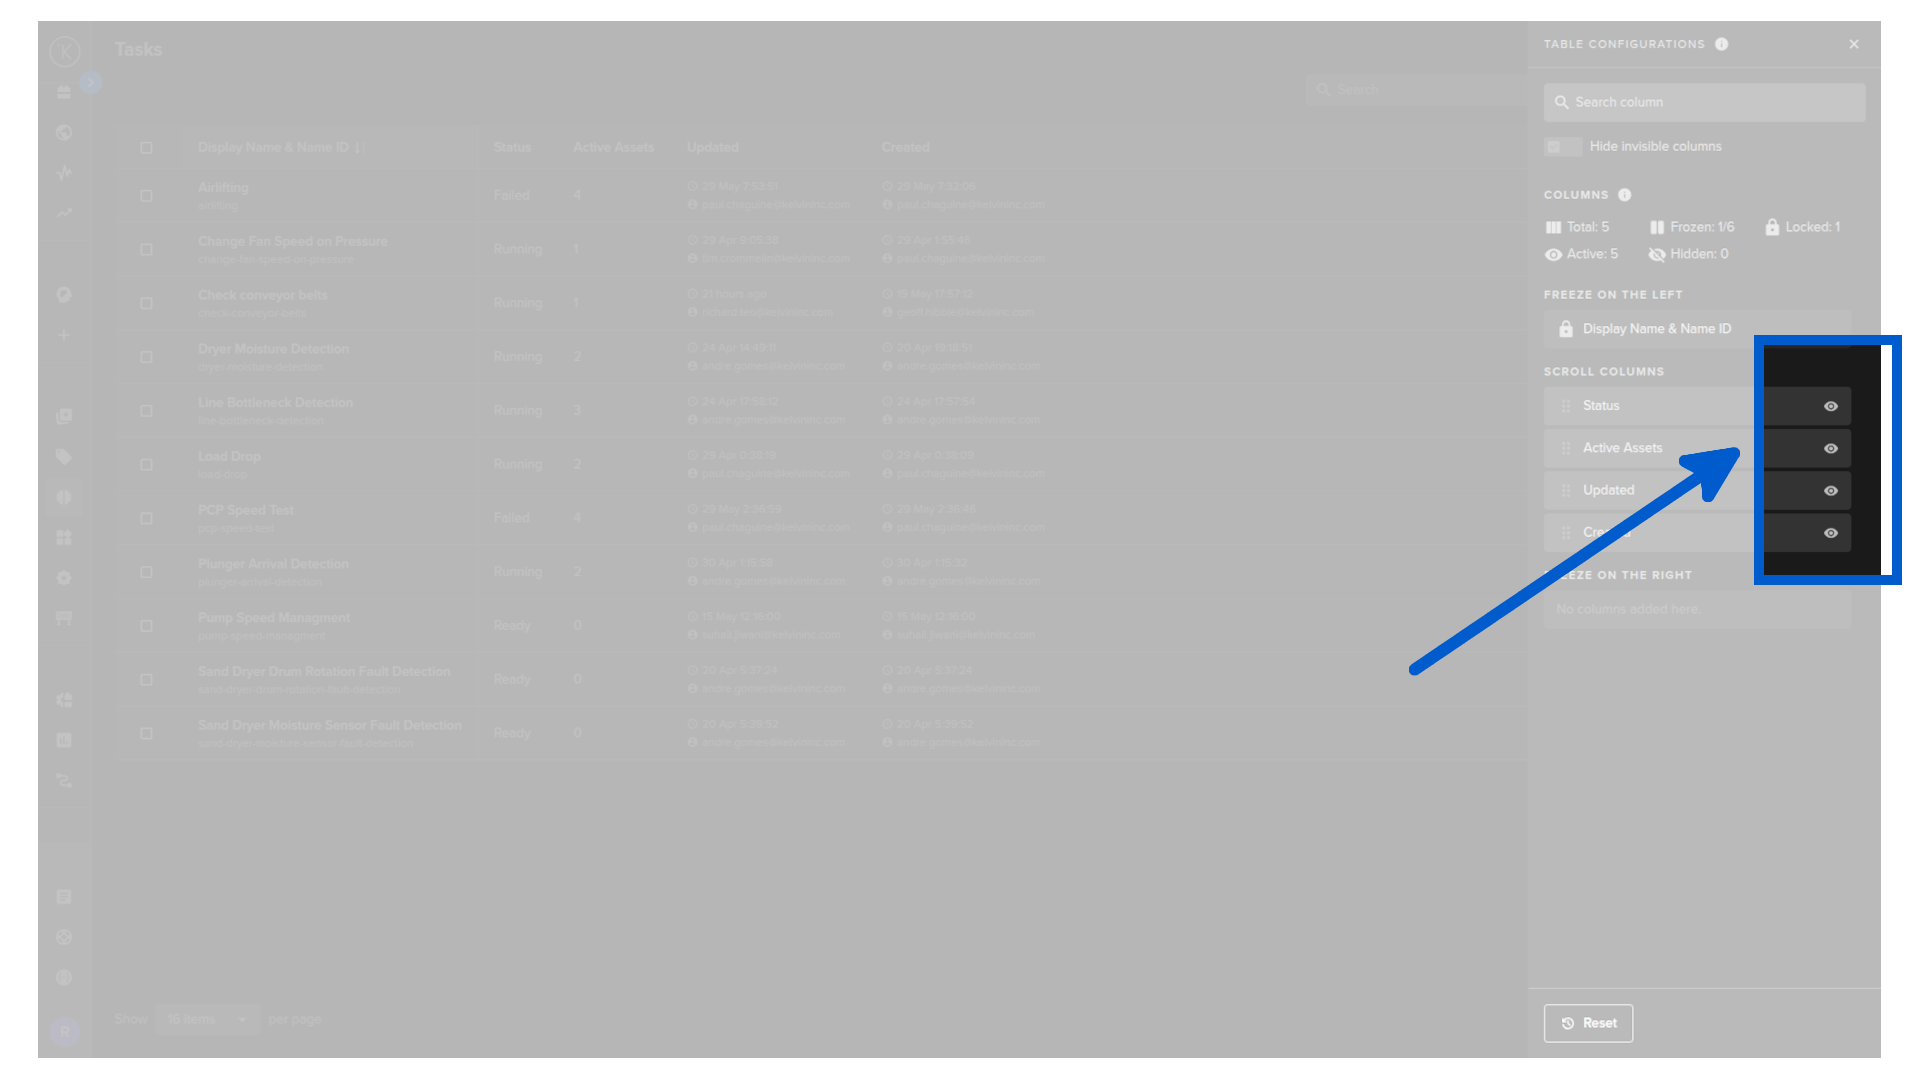
When you are inside the column settings you can see an overview of the columns available and showing.
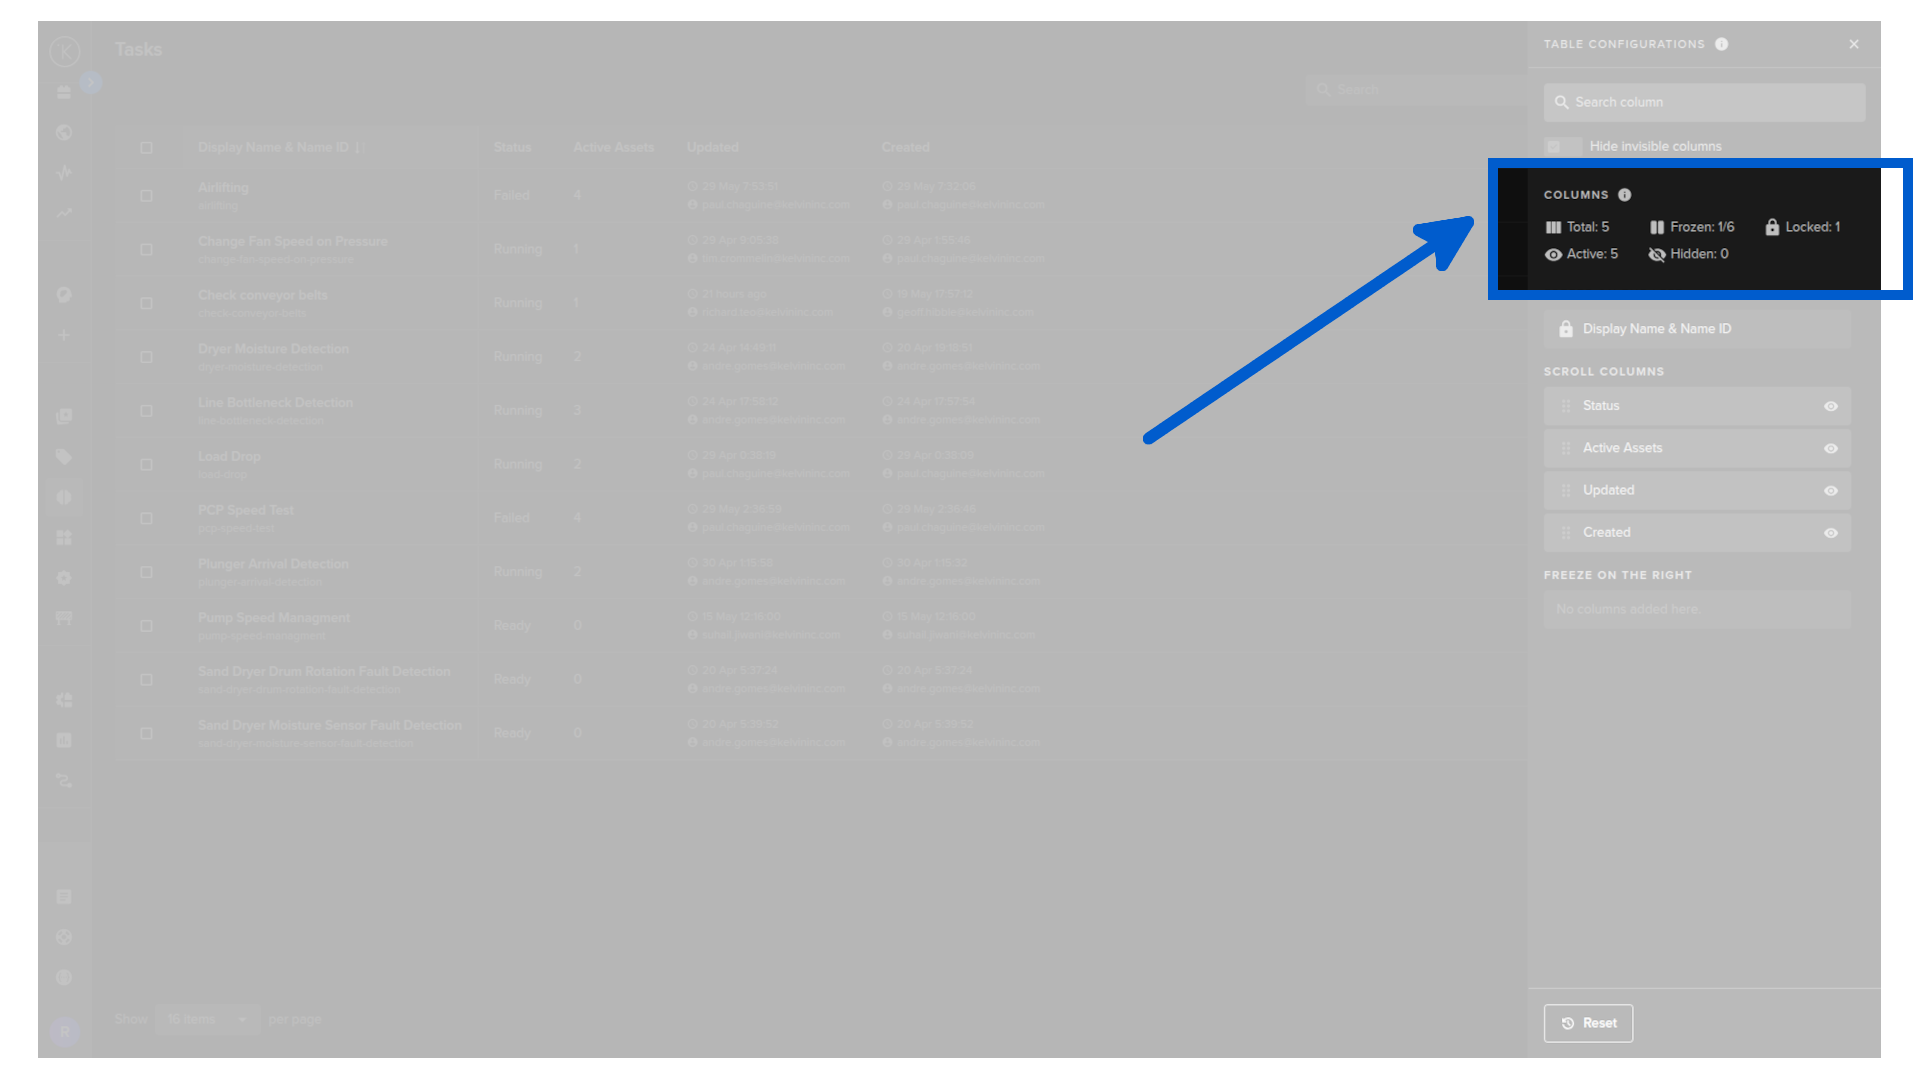
| Item | Description |
|---|---|
| Total | Total number of columns available (both active and hidden) |
| Frozen | Total number of columns that are in the left or right freeze positions out of a total number of columns that can be moved to the frozen sections |
| Locked | Total number of columns that can not be moved or edited |
| Active | Total number of columns that will be shown on the table |
| Hidden | Total number of columns that will not be shown on the table |
When you are inside the column settings with a large number of columns, this feature is useful to find columns and to hide the hidden columns from the list to make it easier to see what is relevant.
Edit Task
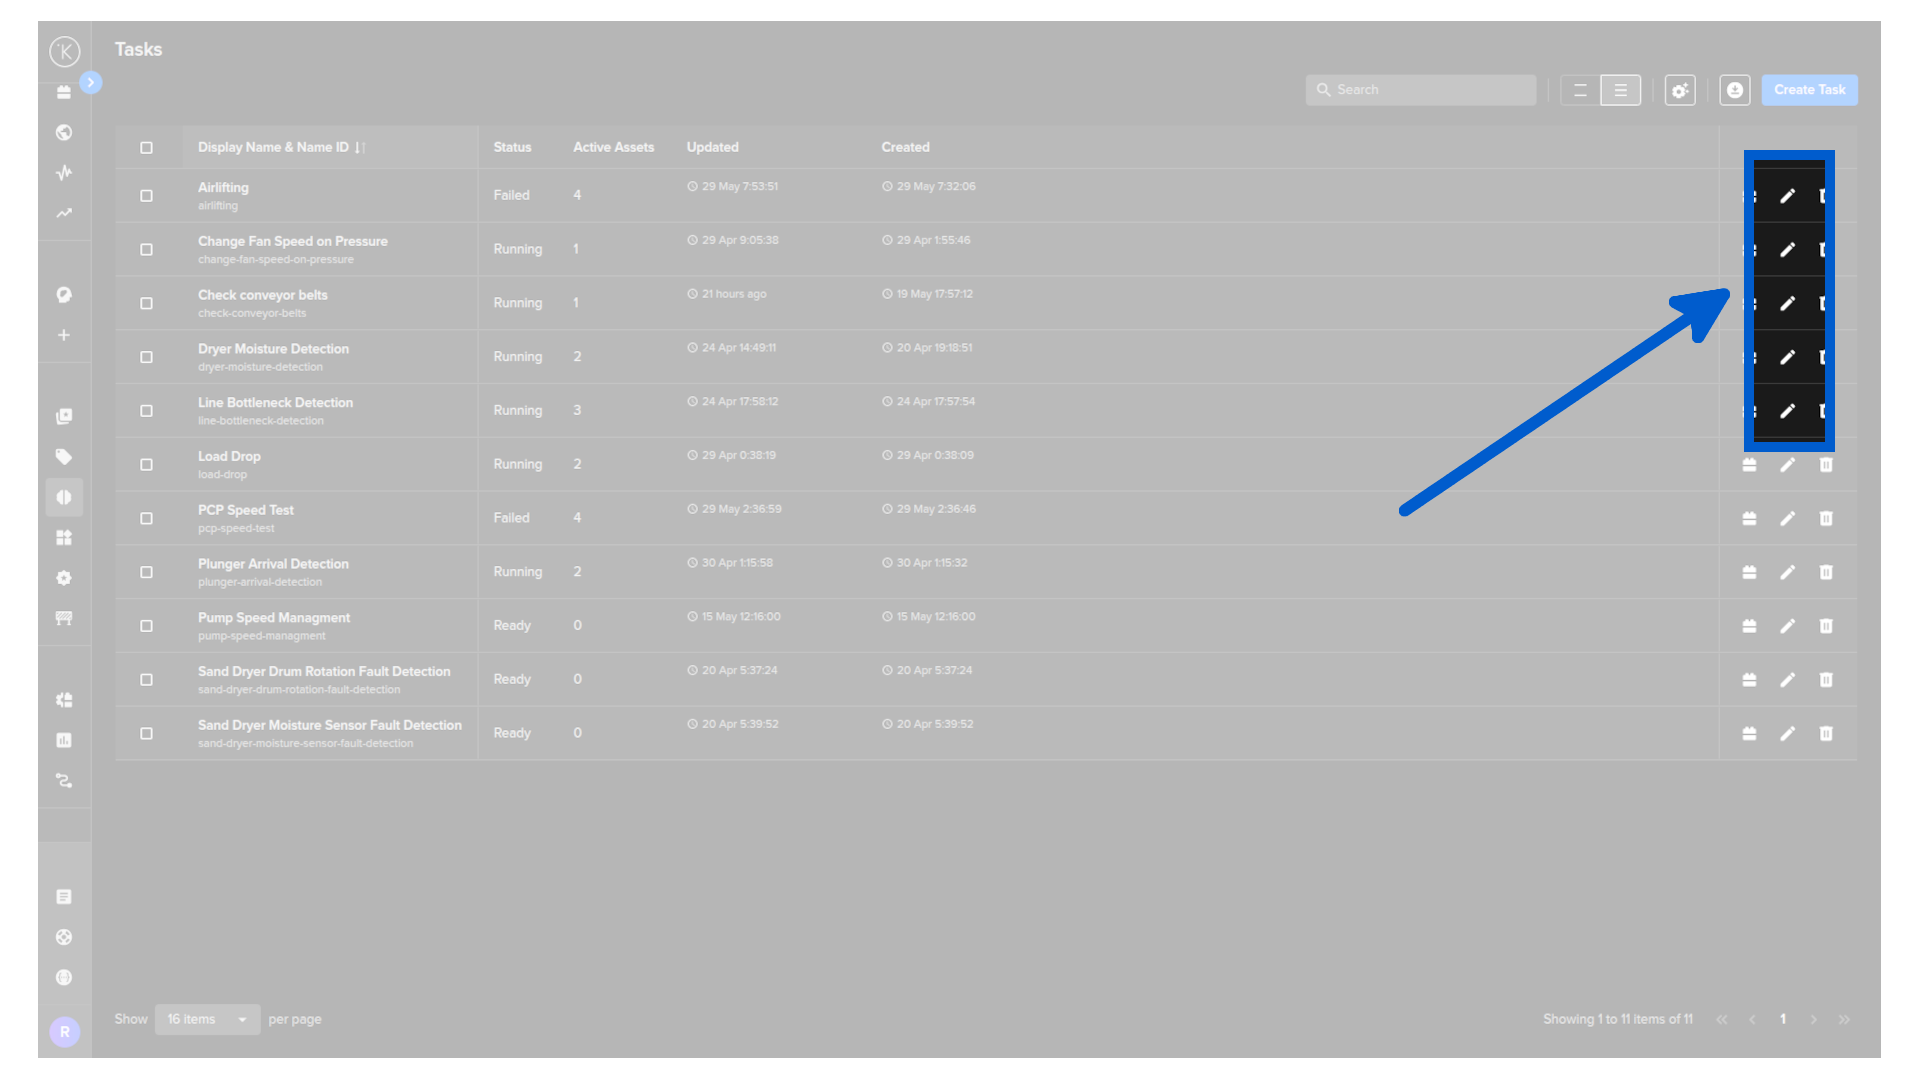
Click the edit icon to return to the Create Task screen for that task. You can update the description, re-run the AI clarification, and adjust the flowchart before saving.
Delete Task
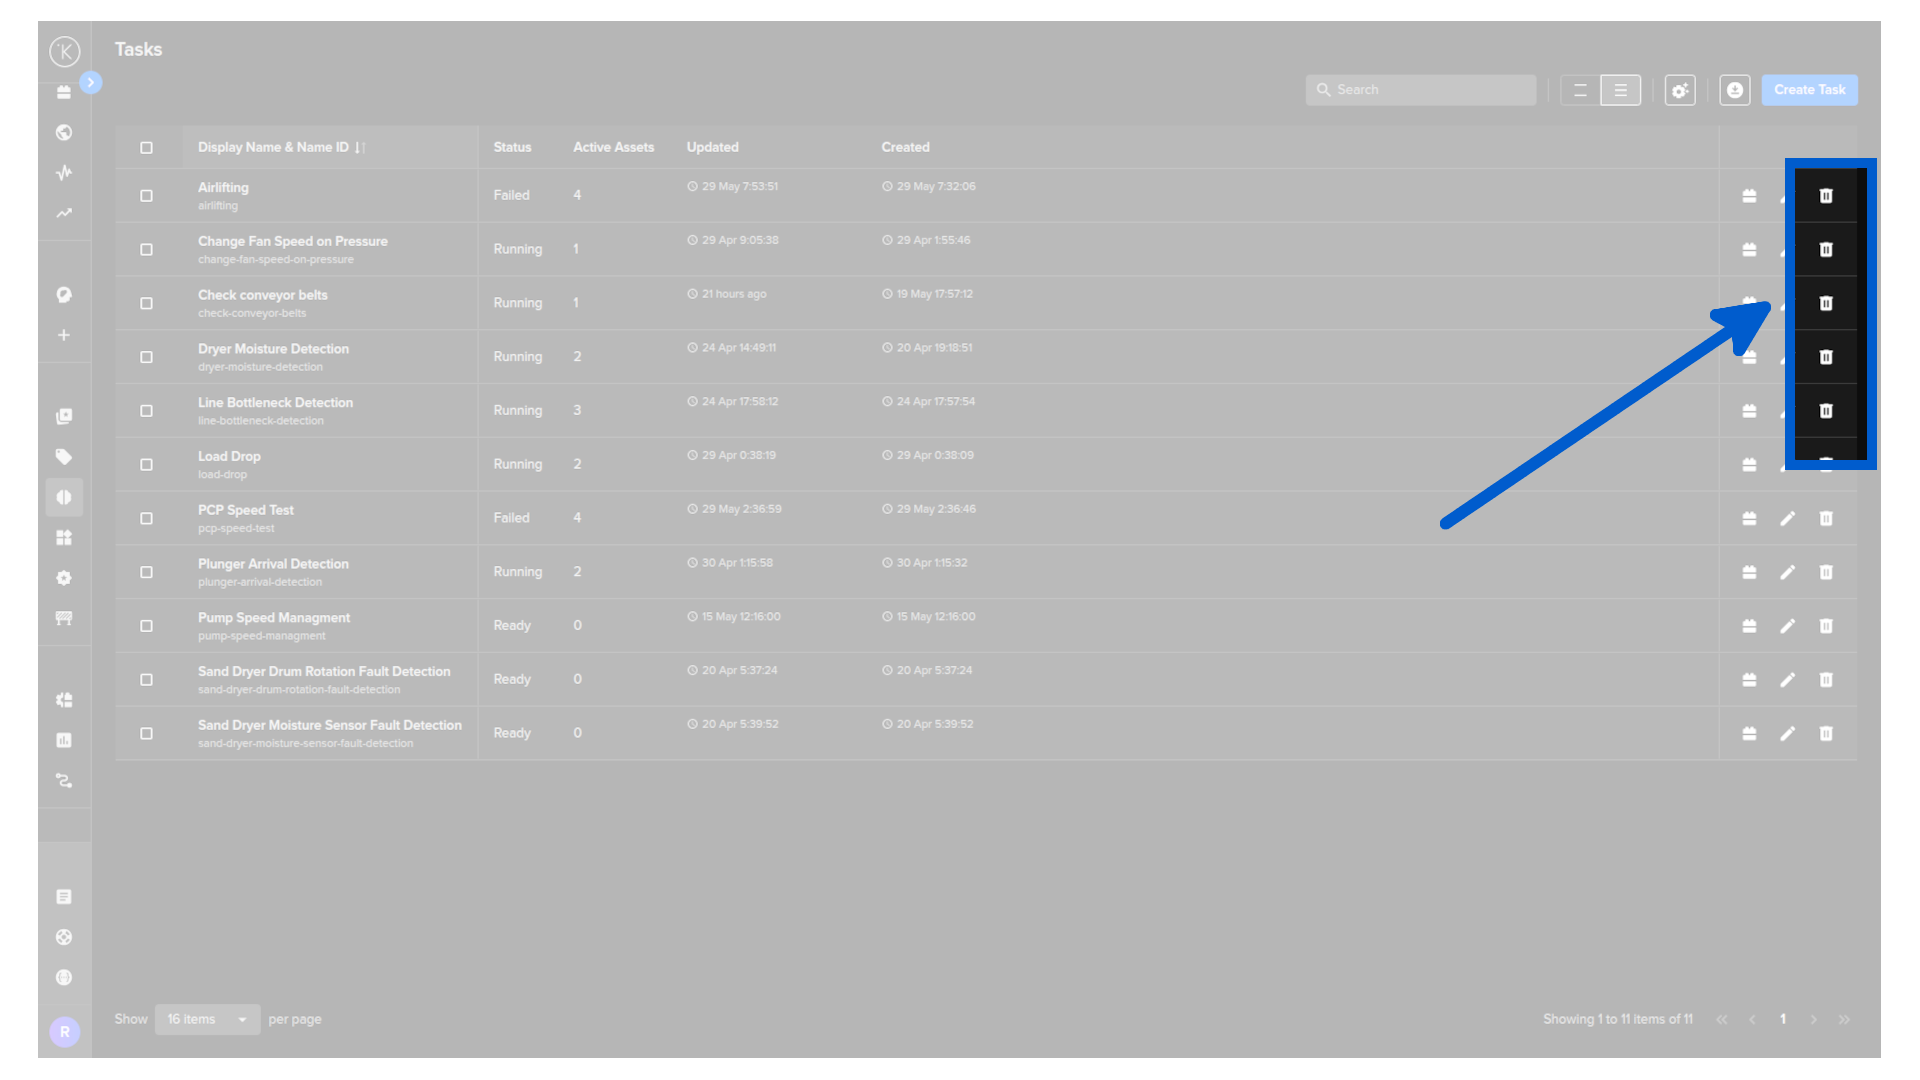
Click the delete icon to remove a single task.
Warning
This cannot be undone.
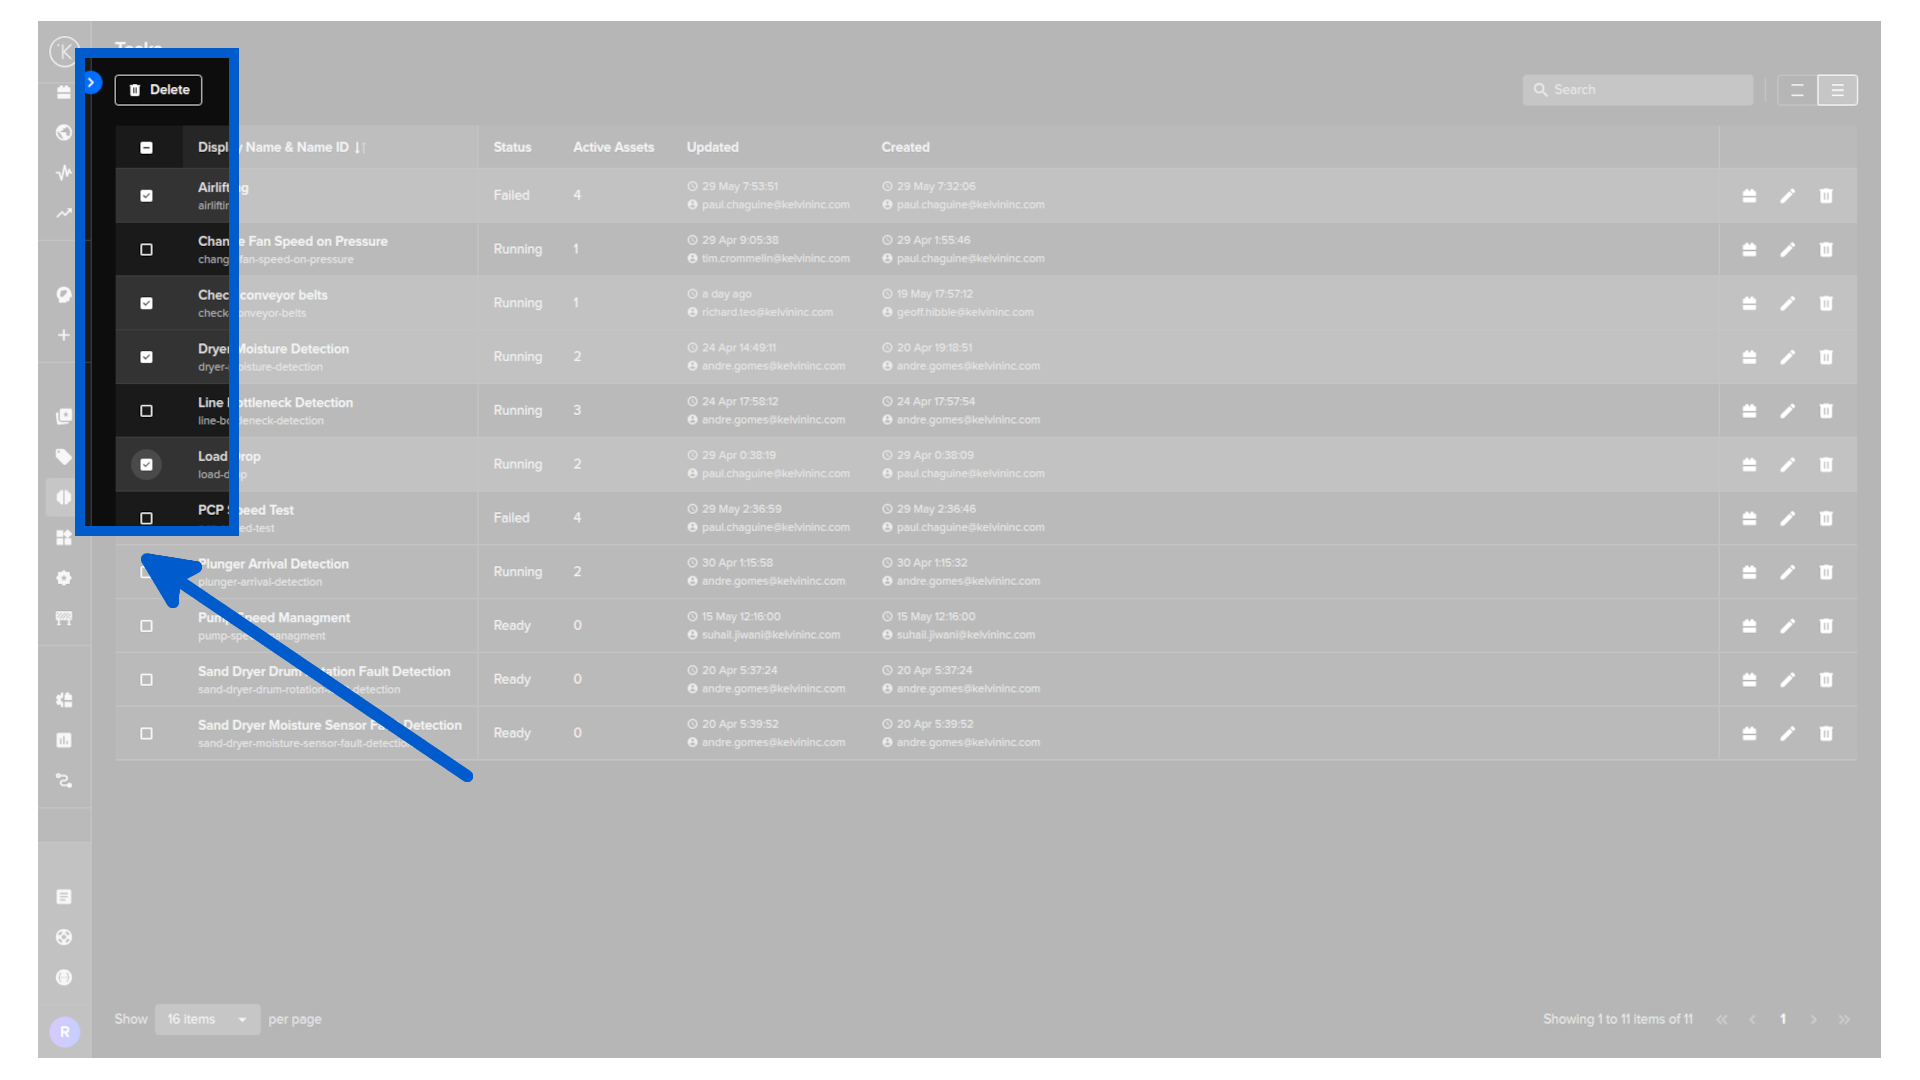
Select multiple rows using the checkboxes to enable bulk actions. The only bulk action available is Delete.
Bulk Delete Task
Click the delete icon to remove a single task.
Manage Task
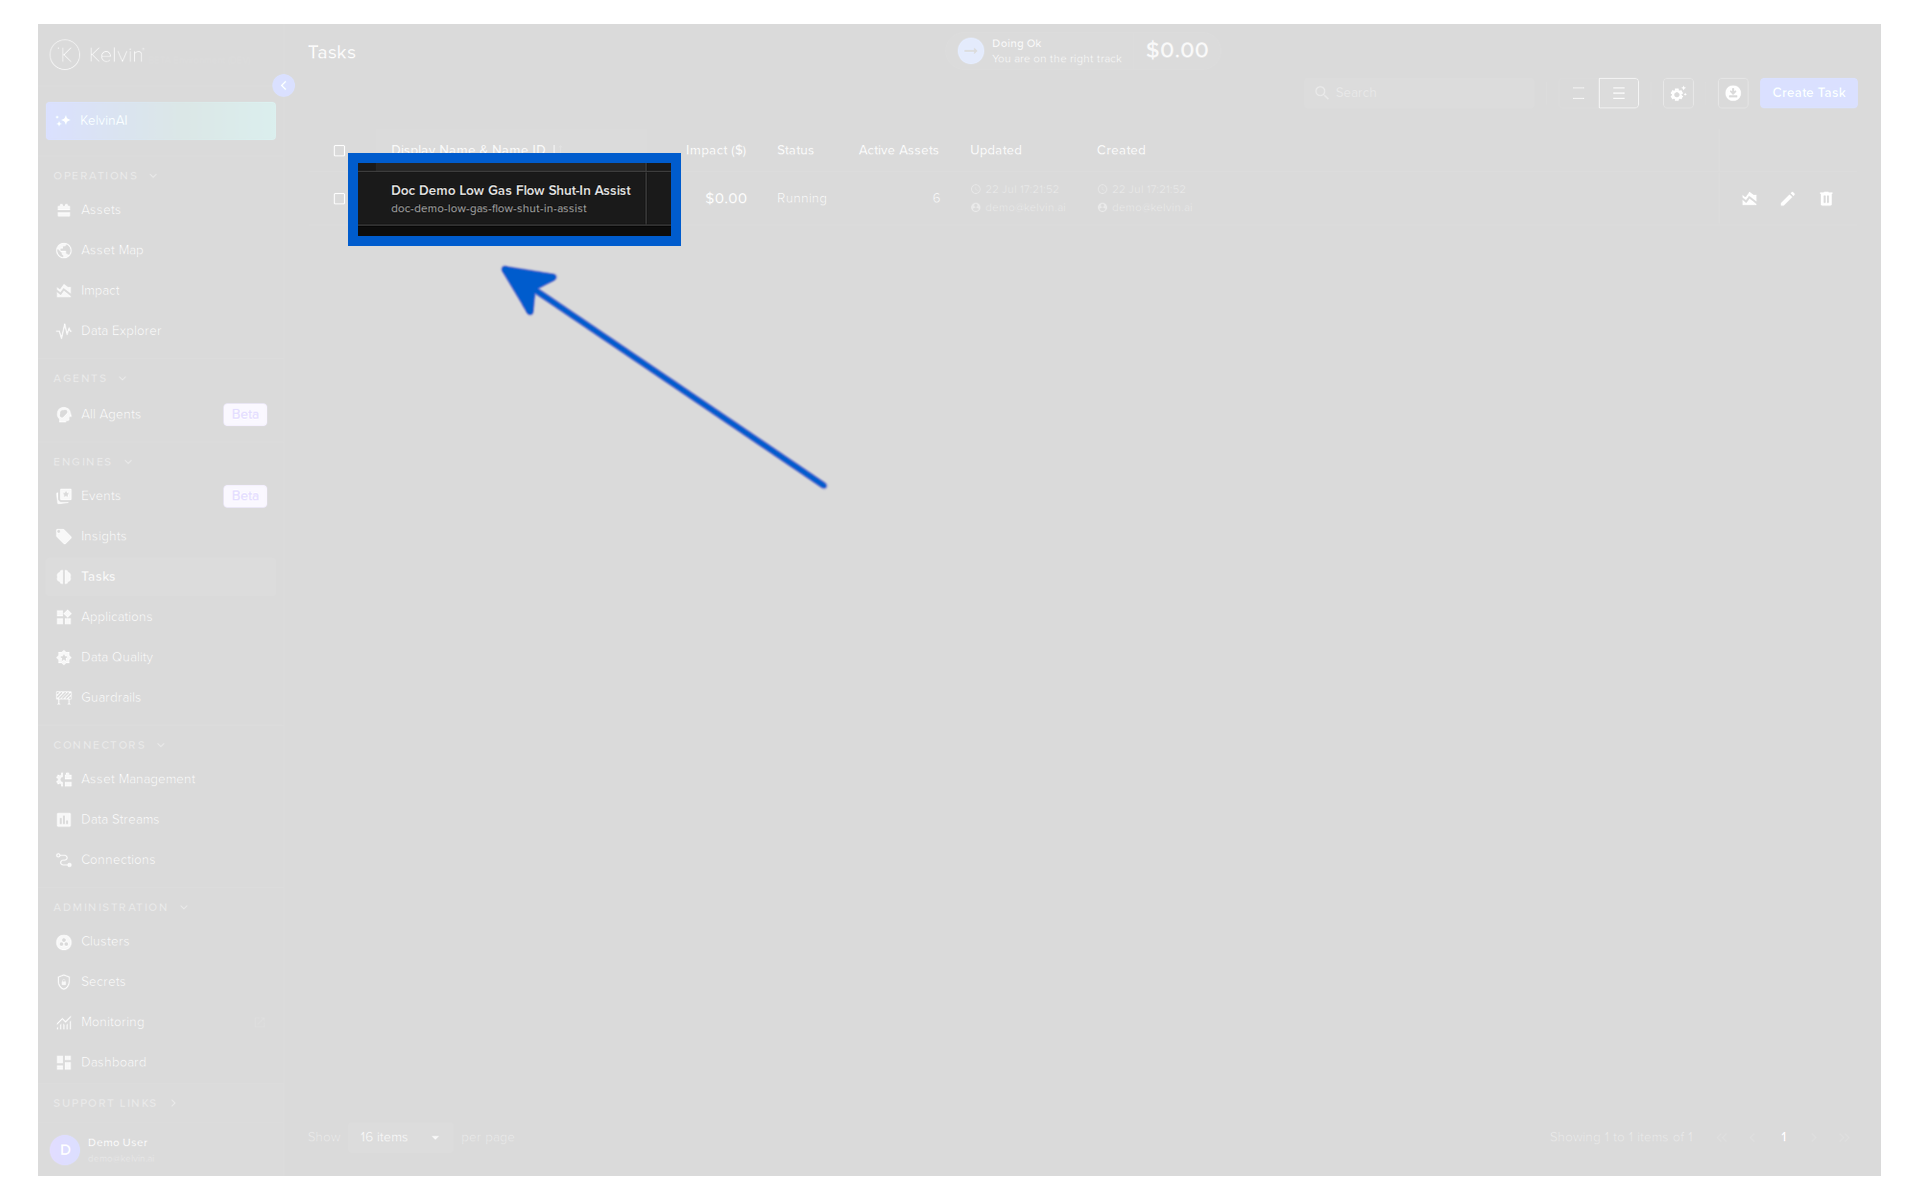
Click on a task name in a row to open the Manage Task screen.
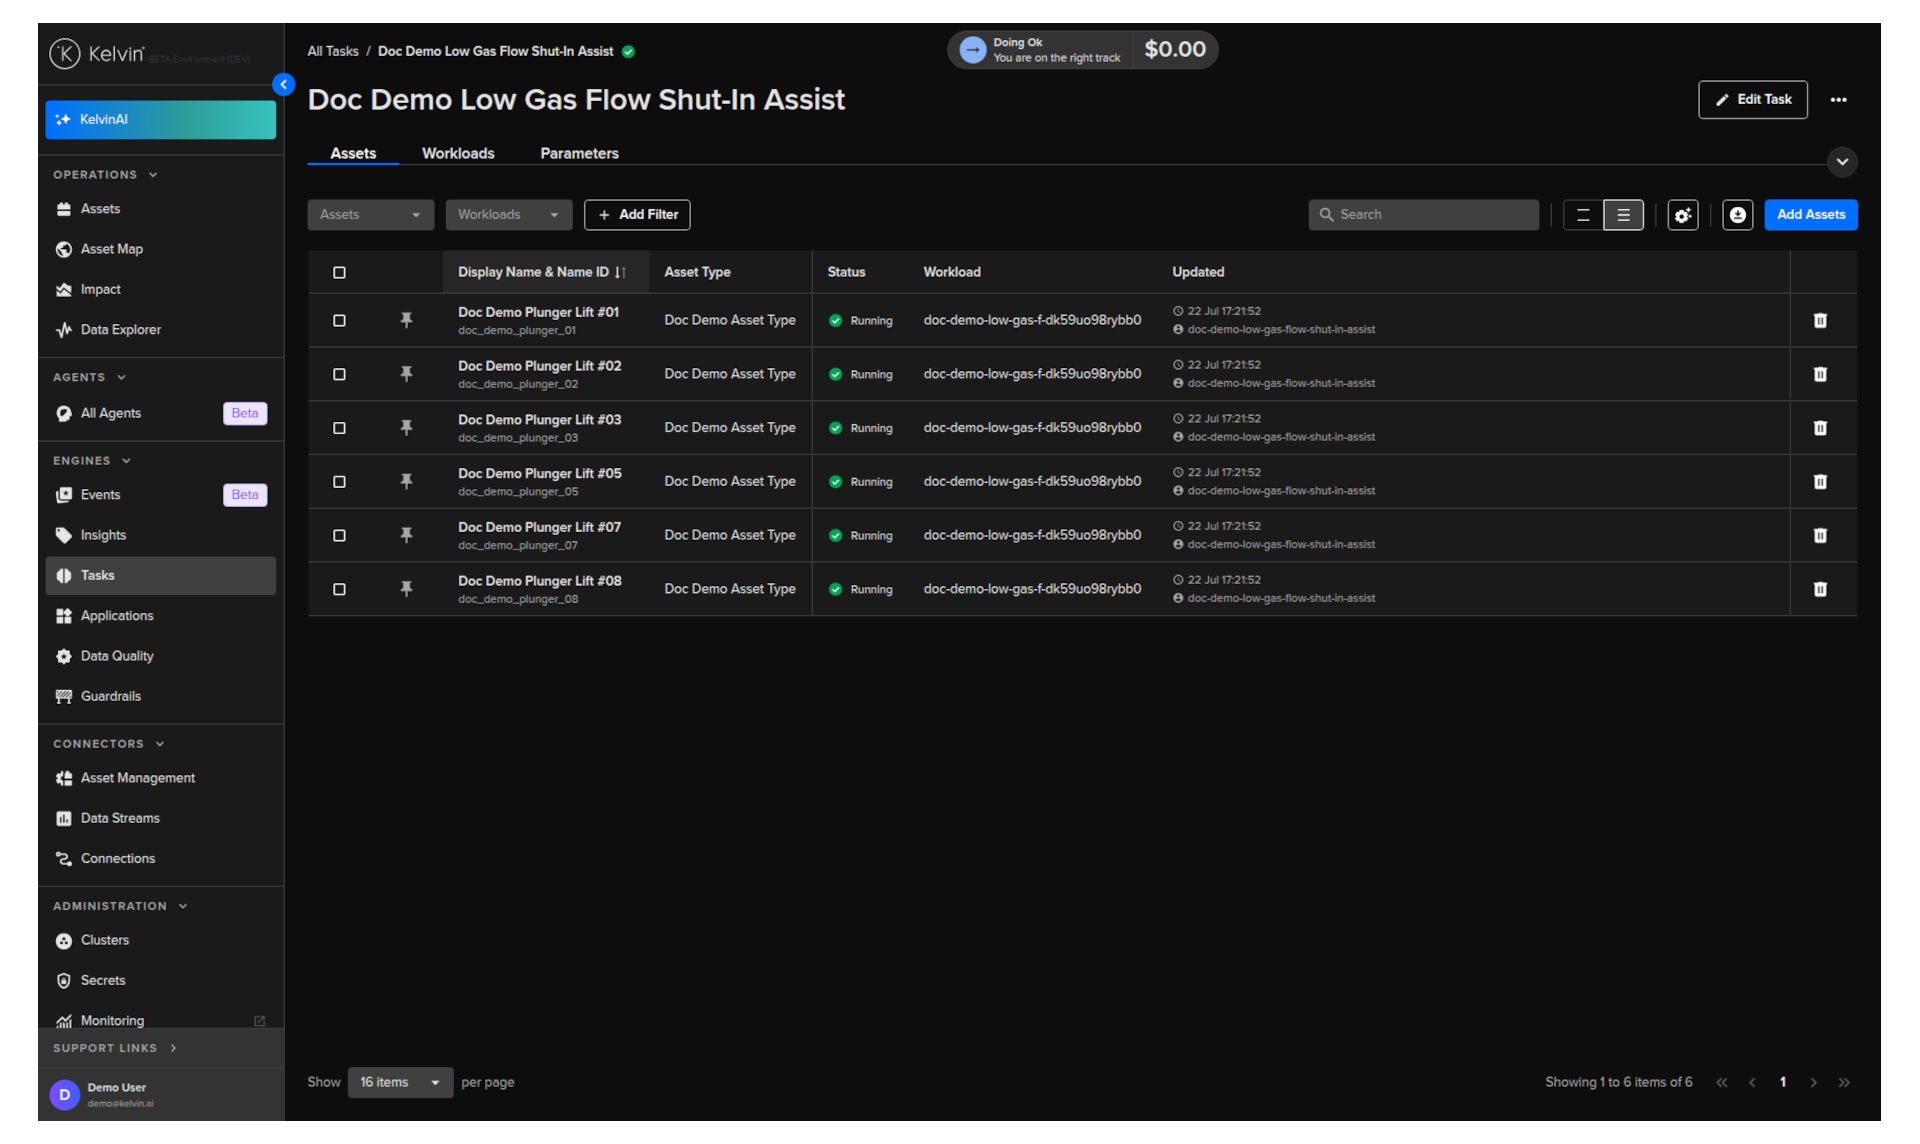
The Manage Task screen has three tabs: Assets, Workloads, and Parameters.
Assets Tab
The Assets tab shows all assets currently assigned to this task. From here you can add new assets or remove existing ones.
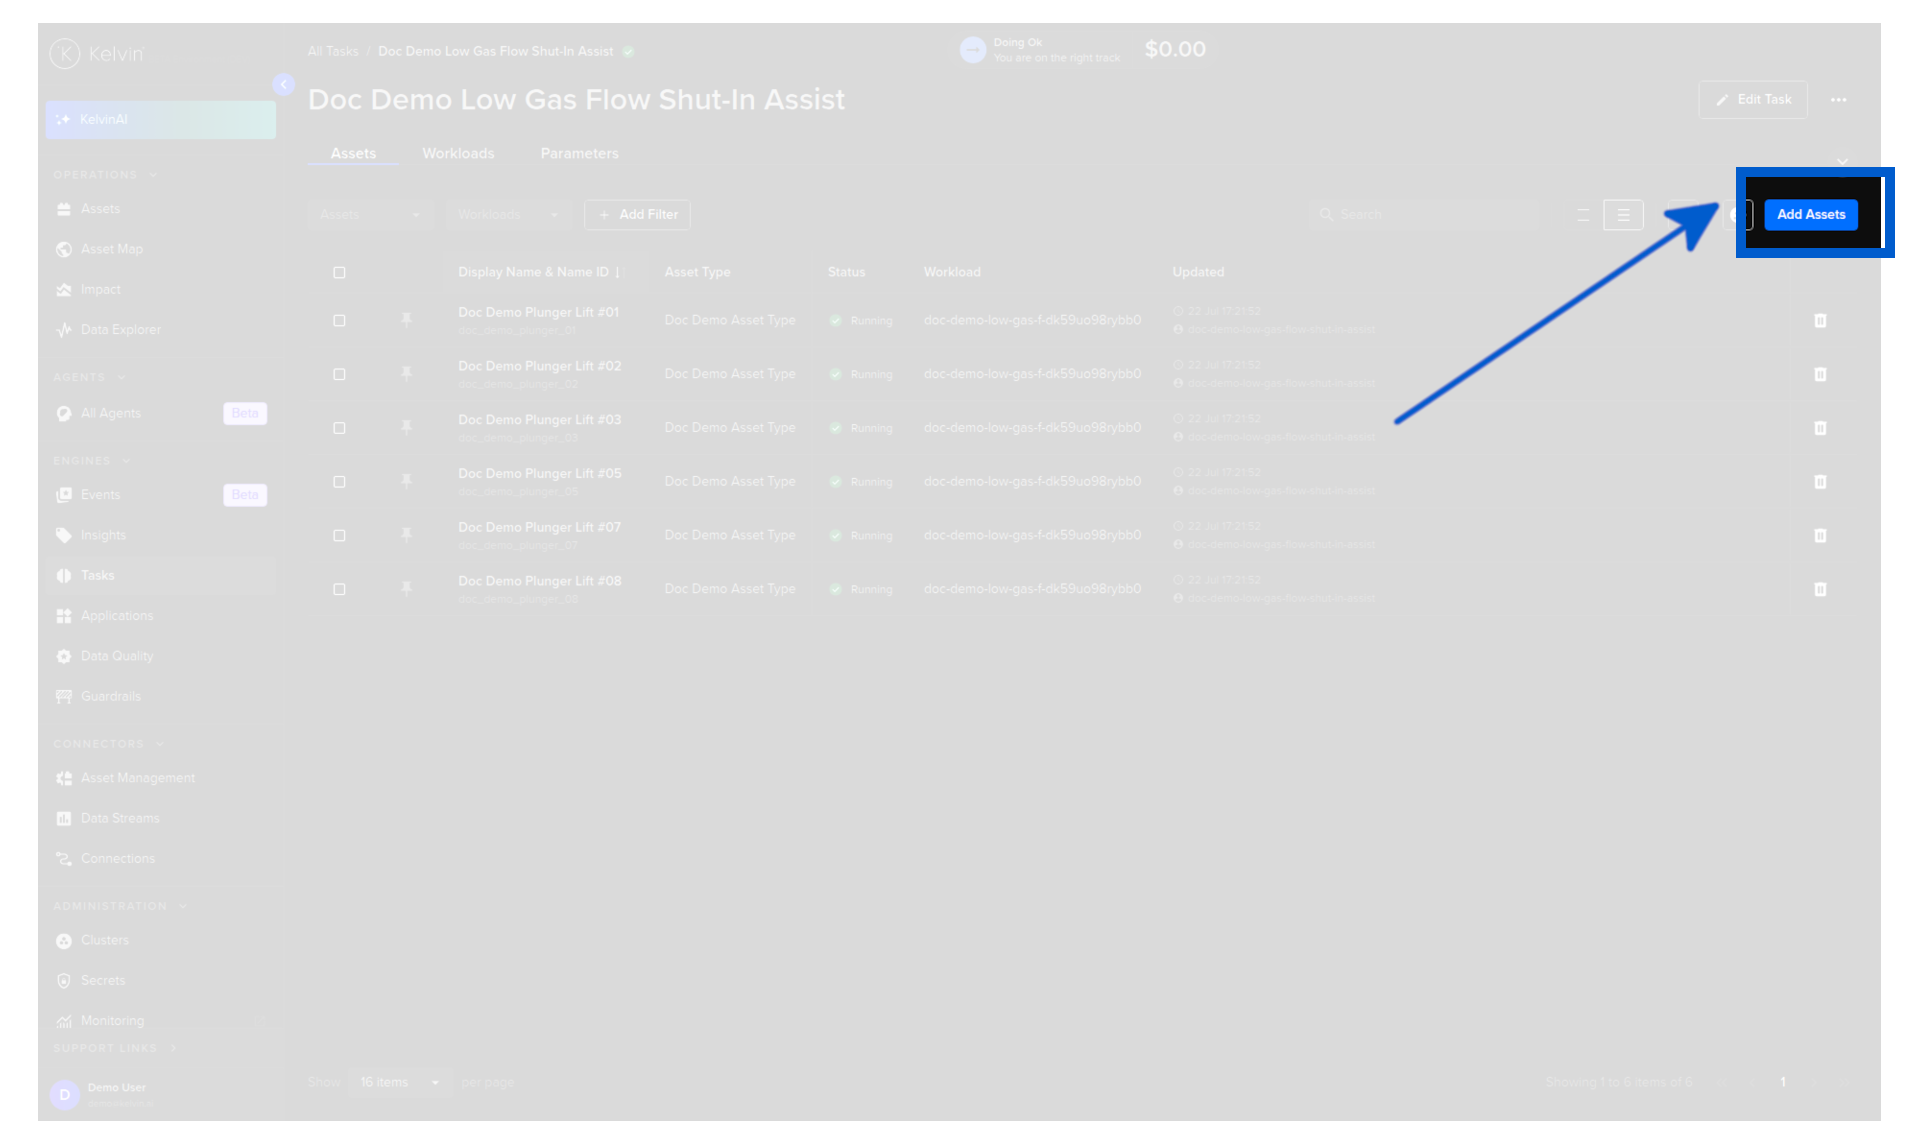
To add assets, click Add Assets. A full list of available assets is shown, filterable by Asset Type and Status. Select the assets you want this task to monitor and click Add.
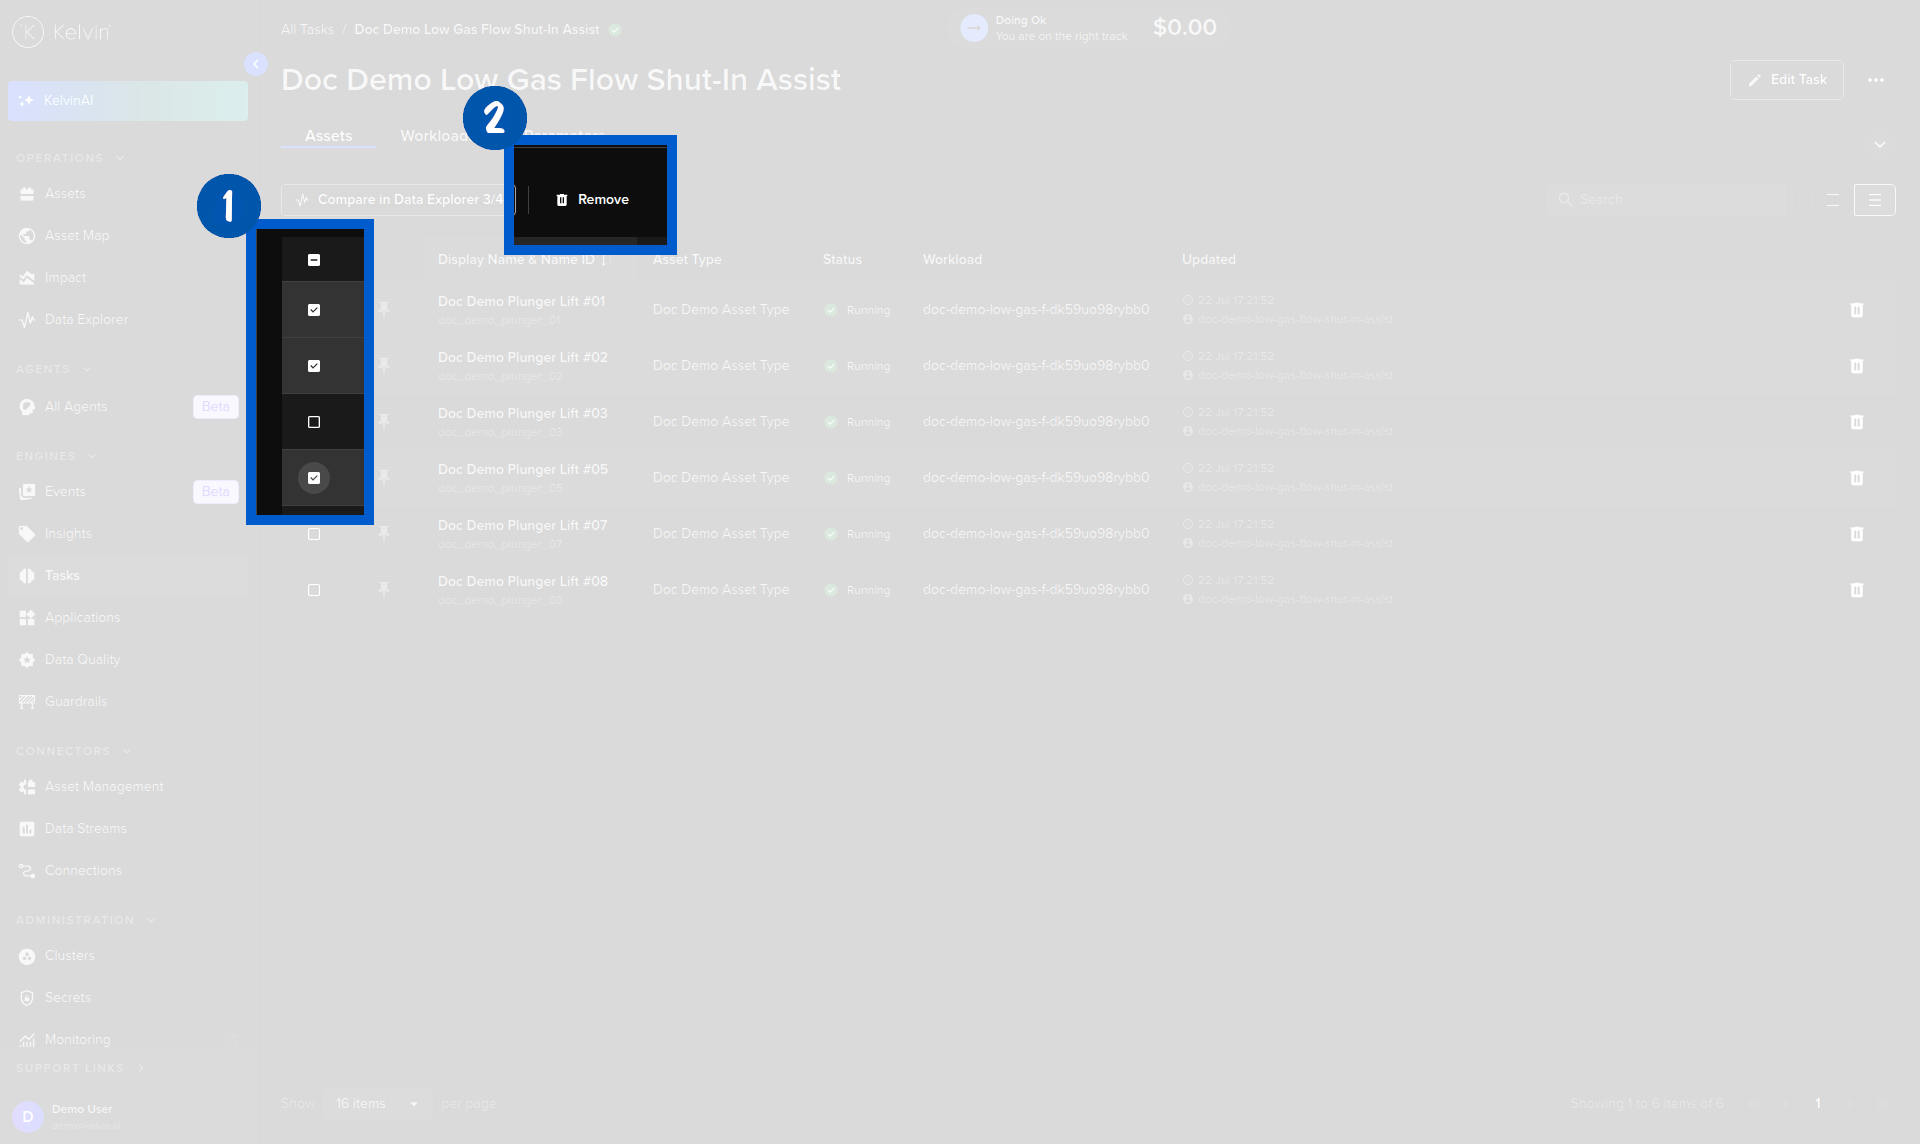
To remove an asset, select it in the list and click Remove.
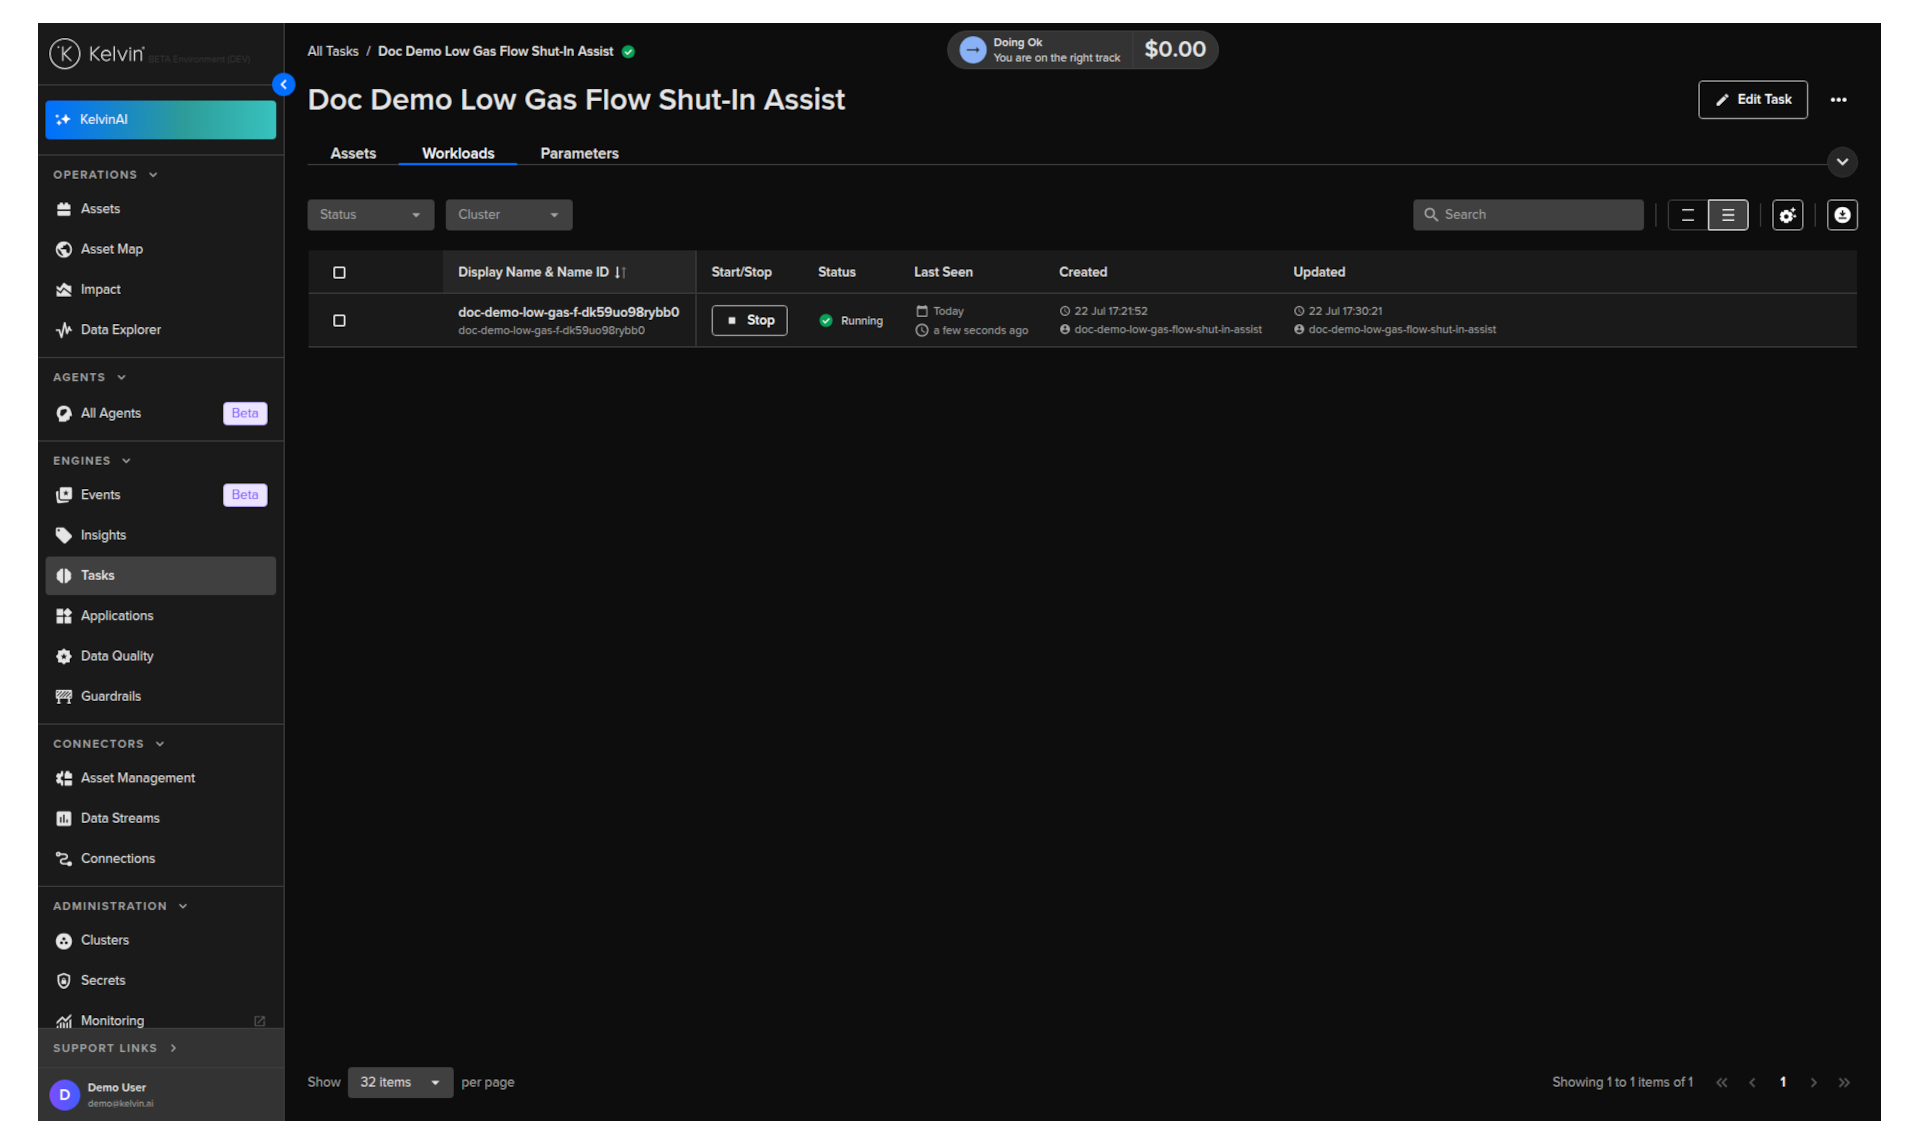
Workloads Tab
The Workloads tab shows the workloads that have been deployed to a cluster for this task. A workload is the running instance of the task at the edge.
Note
One workload can manage multiple assets depending on your deployment settings. The number of assets per workload is configured at deployment time.
For full details on workloads, see the Workloads Tab documentation in the Applications section.
Parameters Tab
The Parameters tab lets you view and update the parameter values for the assets assigned to this task.
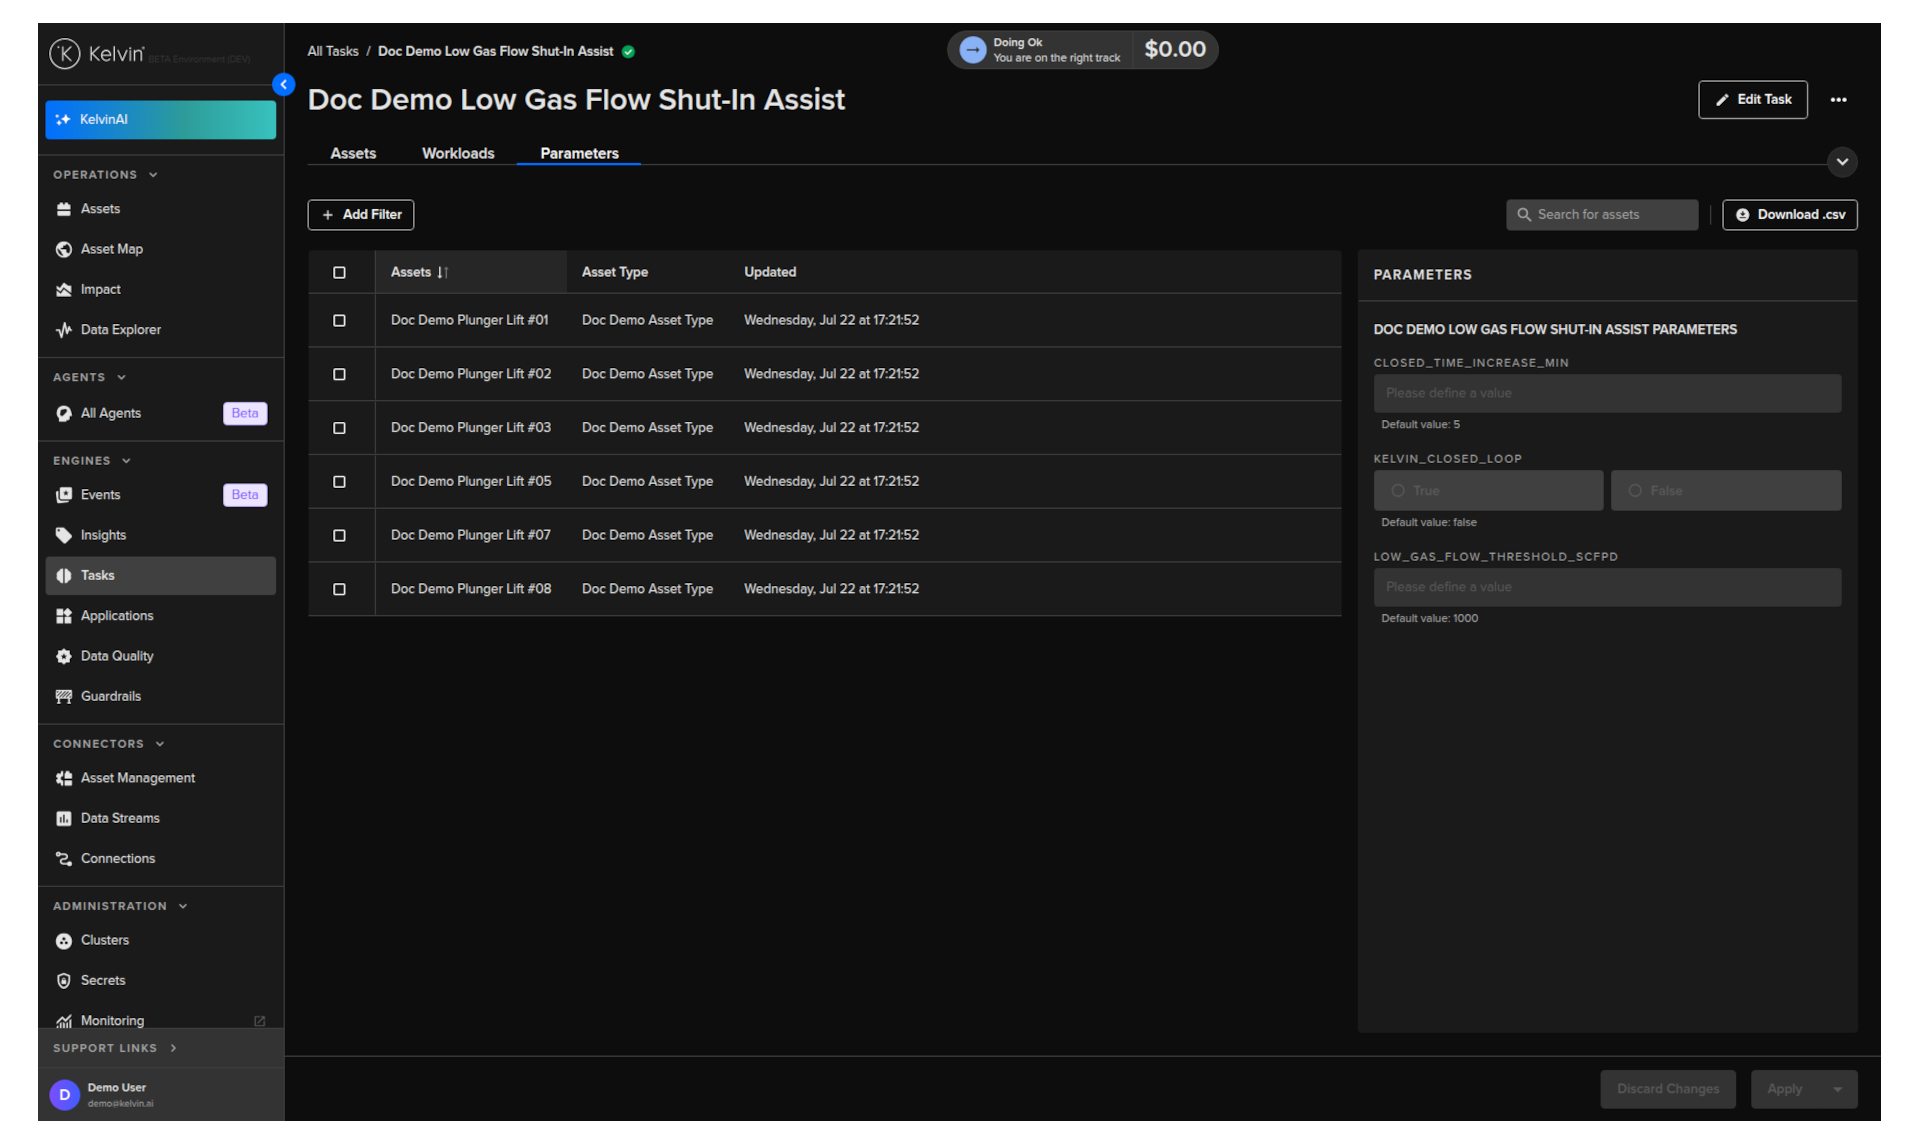
You can update parameters in two ways:
- Single asset -- select one asset from the list to see and edit its individual parameter values.
- Bulk update -- select multiple assets to update their parameters at once.
Note
When updating parameters in bulk across multiple assets, individual current values are not shown. You can still change the parameter values and they will be applied to all selected assets when you save.
For full details on viewing and changing single or multiple asset parameters, see the Parameters Tab documentation in the Applications section.