View Workload Logs
You can see the logs of the workload for any Application in the Kelvin UI.
Logs
Click on Applications, select the Application card, then navigate to the Workload tab to view the list of workloads for that Application.
Note
You can also see a Workload's logs by clicking on the Cluster menu, selecting a Cluster and then selecting the Workload from there.
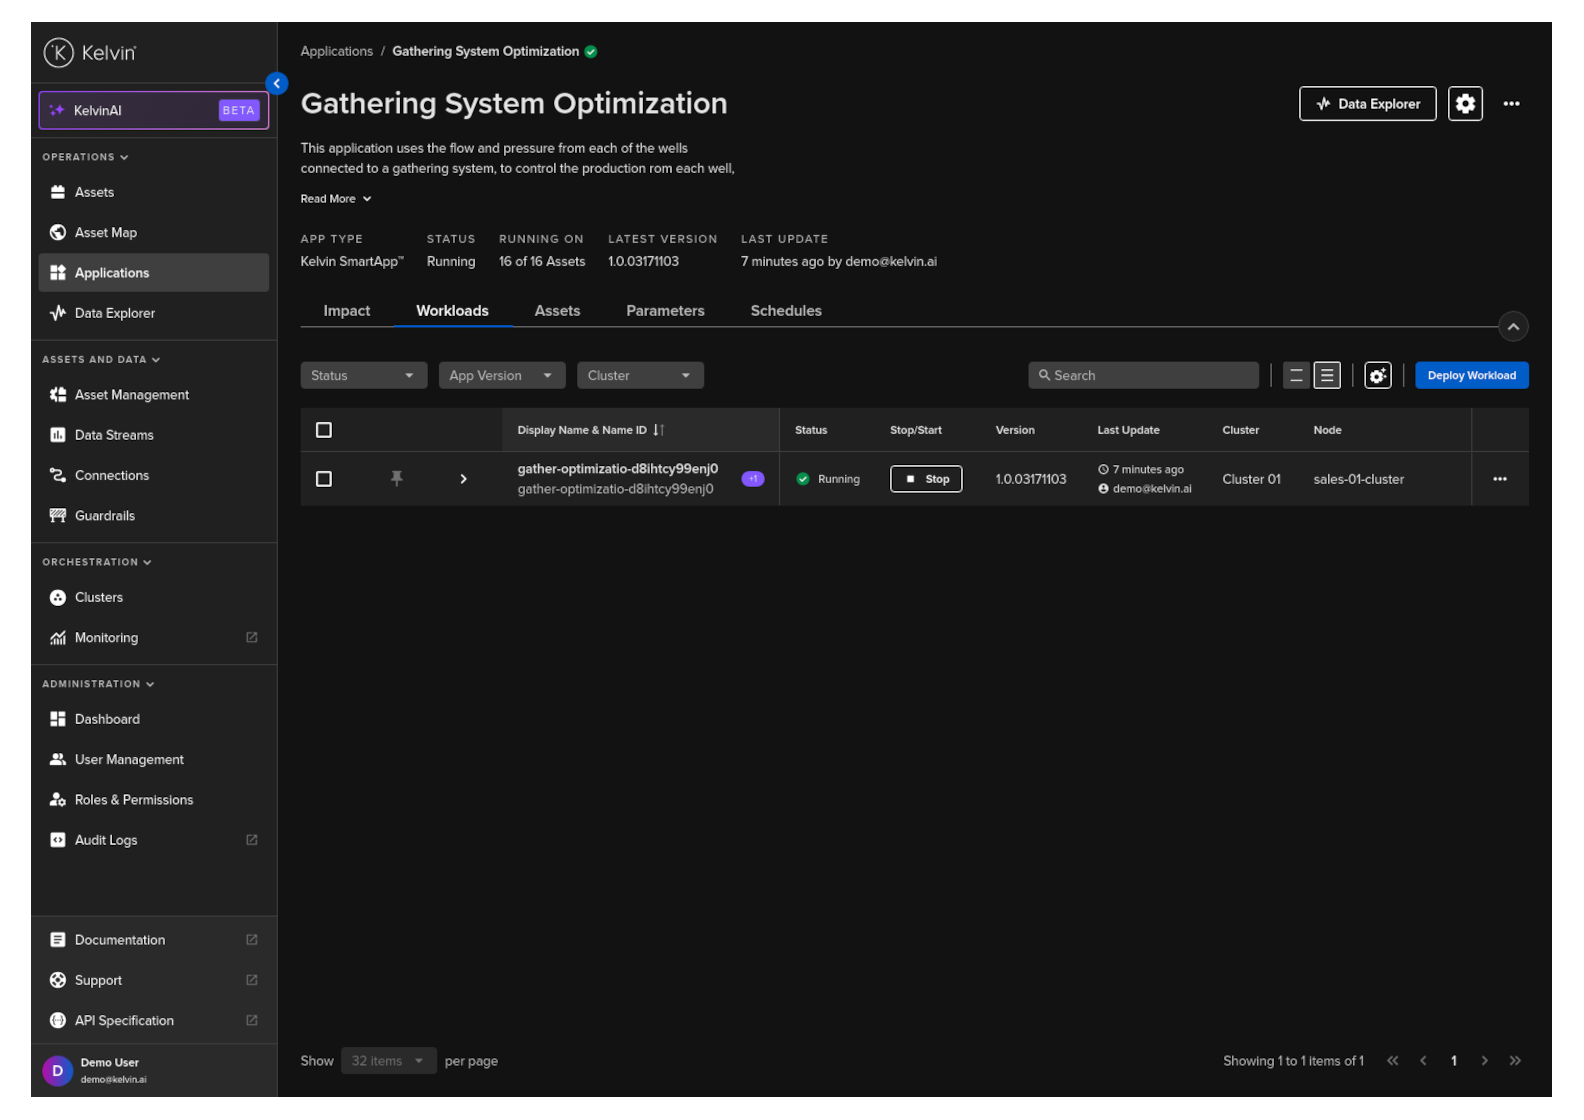
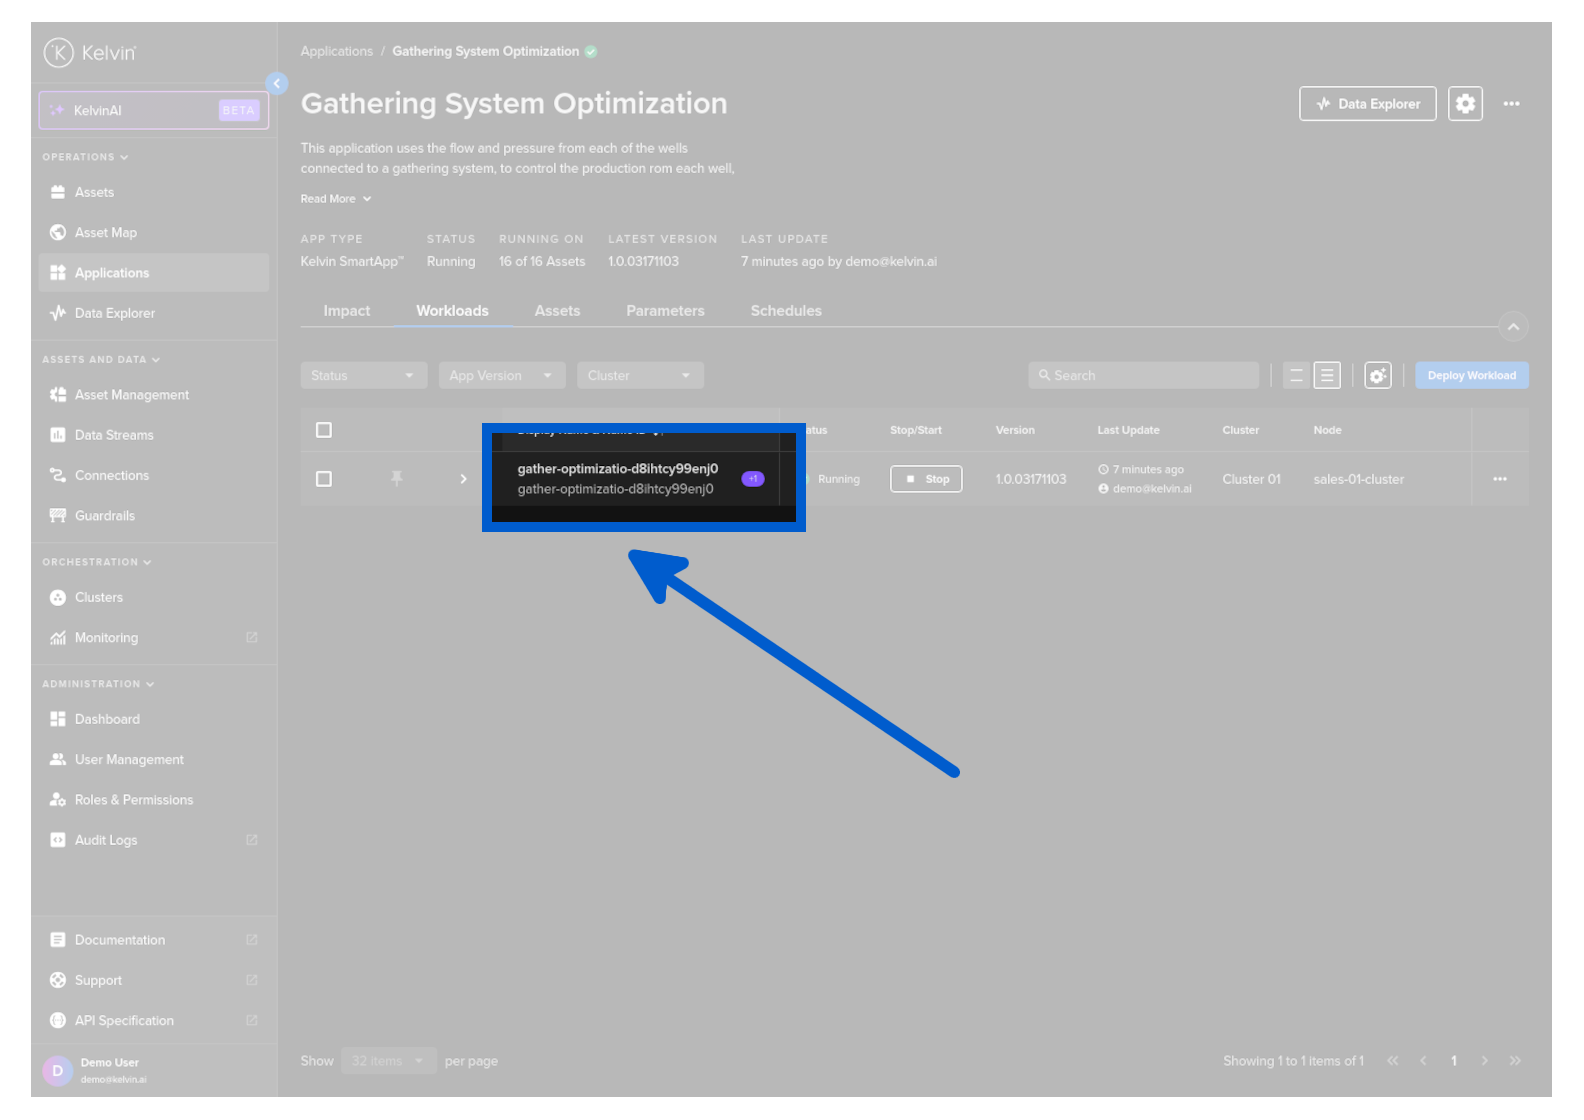
Then click on a Workload name to see the details.
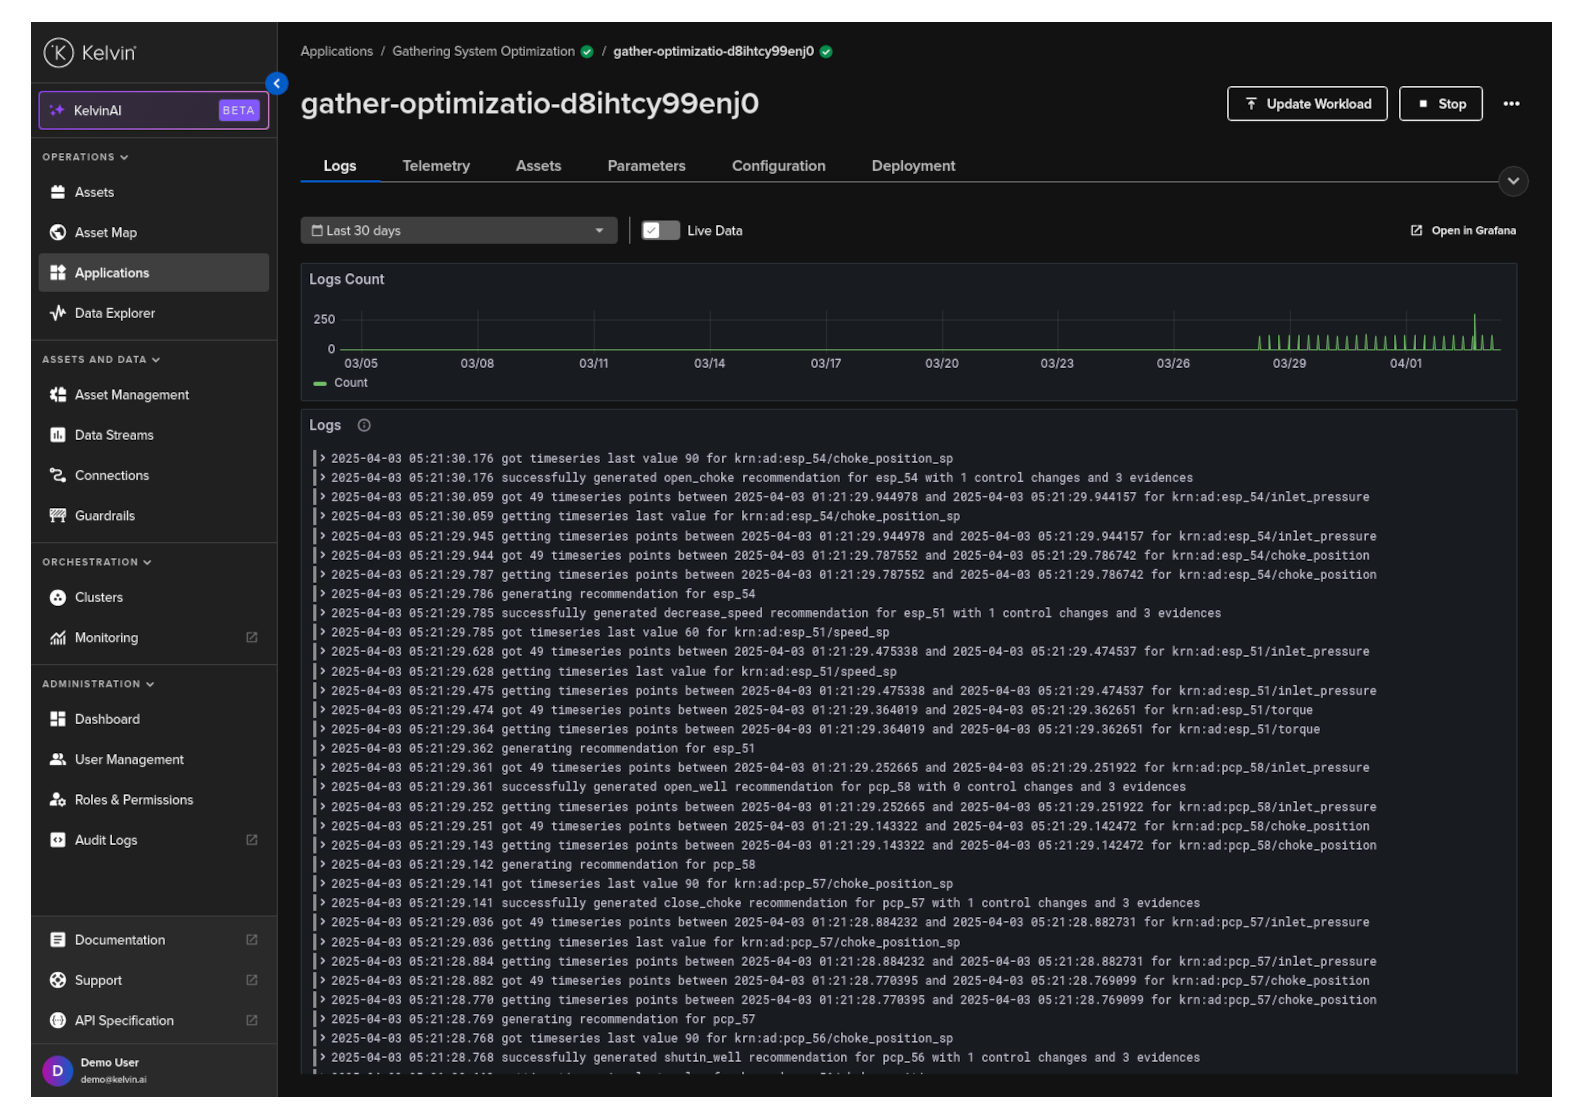
and then click on the Logs tab.
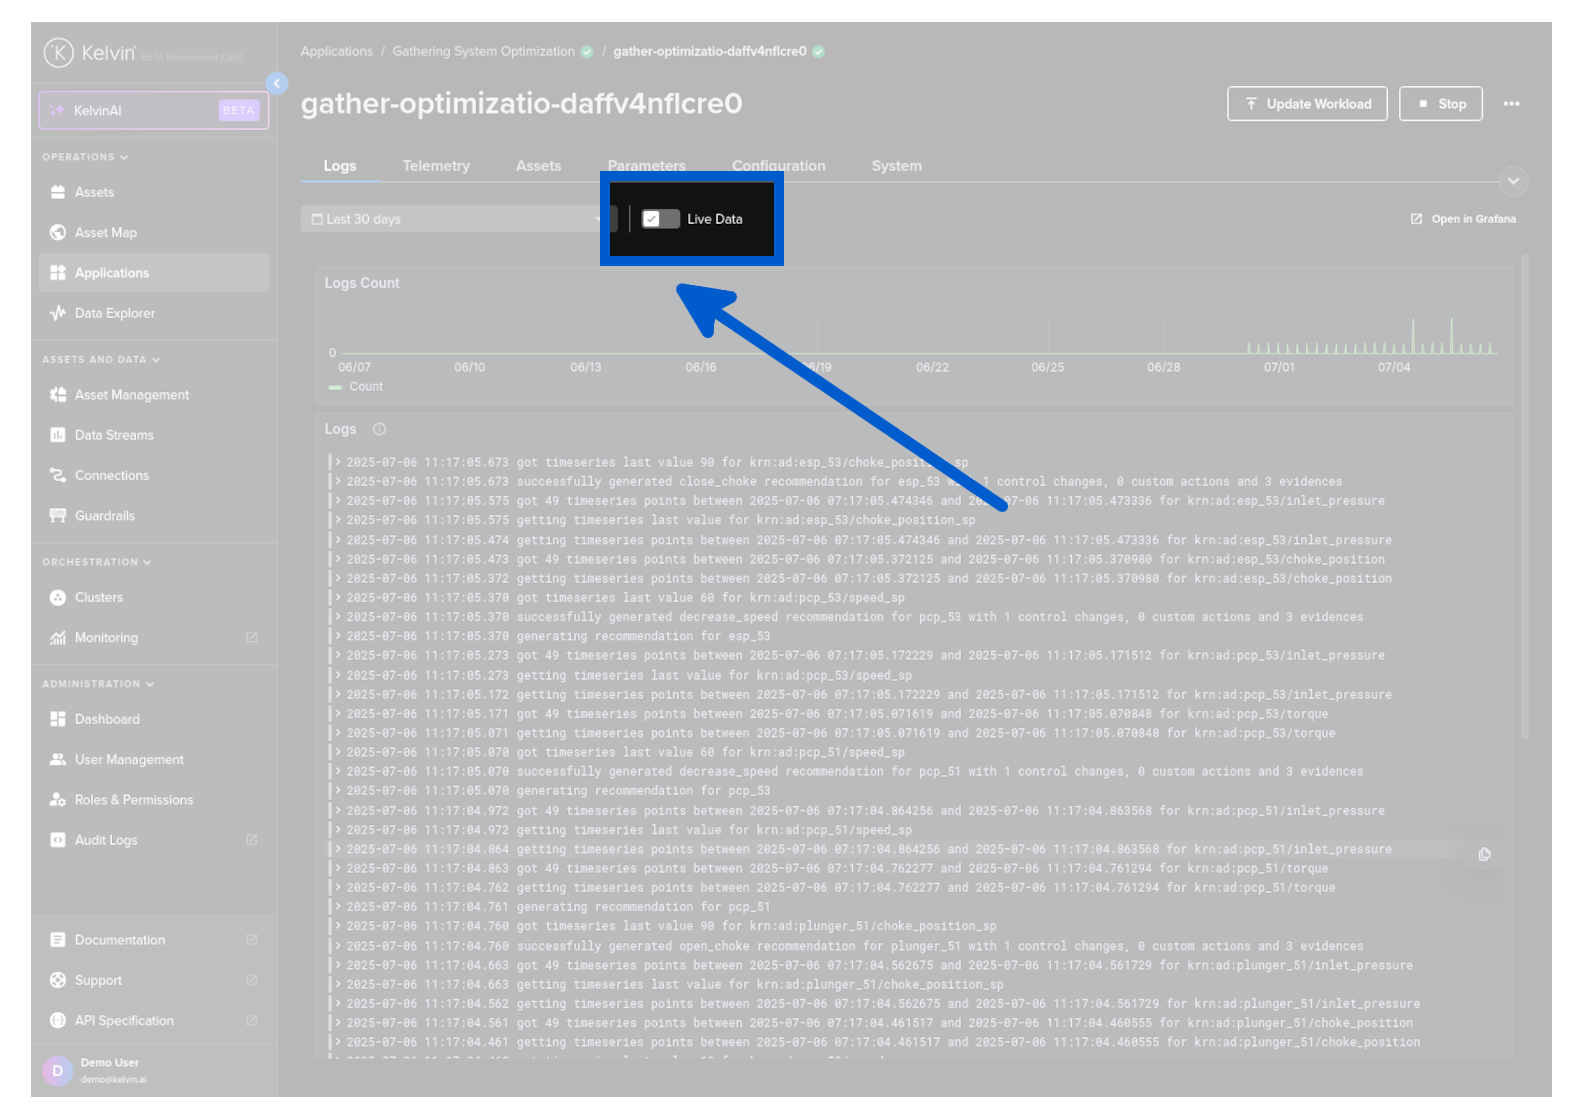
Live Data
In the Logs screen you have a toggle option called Live Data.
| Option | Description |
|---|---|
| Live Data |
The Workload logs are pulled directly from the edge to the Kelvin UI |
| Live Data (Locked) |
The Workload logs are pulled directly from the edge to the Kelvin UI. This behavior is fixed and cannot be modified for the current Edition of the Kelvin Platform. |
| Forwarded Data |
The Workload logs are pulled from the Kelvin Cloud to the Kelvin UI. Logs from the Workload at the edge are synced between the edge and the Kelvin Cloud automatically when online. |
| Forwarded Data (Locked) |
The Workload logs are pulled from the Kelvin Cloud to the Kelvin UI. Logs from the Workload at the edge are synced between the edge and the Kelvin Cloud automatically when online. This behavior is fixed and cannot be modified for the current Edition of the Kelvin Platform. |
Use the Live Data toggle to switch between viewing Workload log data from the Edge or from the Kelvin Platform.
Note
Live feature is preferred if you want to view the direct logs as a new Workload is deployed to the edge.
Forwarded Data is preferred if you want to compile a time range of historical log data for performance analytics.