Monitor Kelvin SmartApps™
Visualize Kelvin SmartApps™ Inputs and Outputs
Once your Kelvin SmartApp™ is deployed, you can visualize the Kelvin SmartApp™ data in Data Explorer.
Data Explorer is a powerful tool that allows you to visualize the data from your assets and Kelvin SmartApps™. You can explore the Inputs and Outputs of your Kelvin SmartApp™ by filtering the data by time, data streams, and assets.
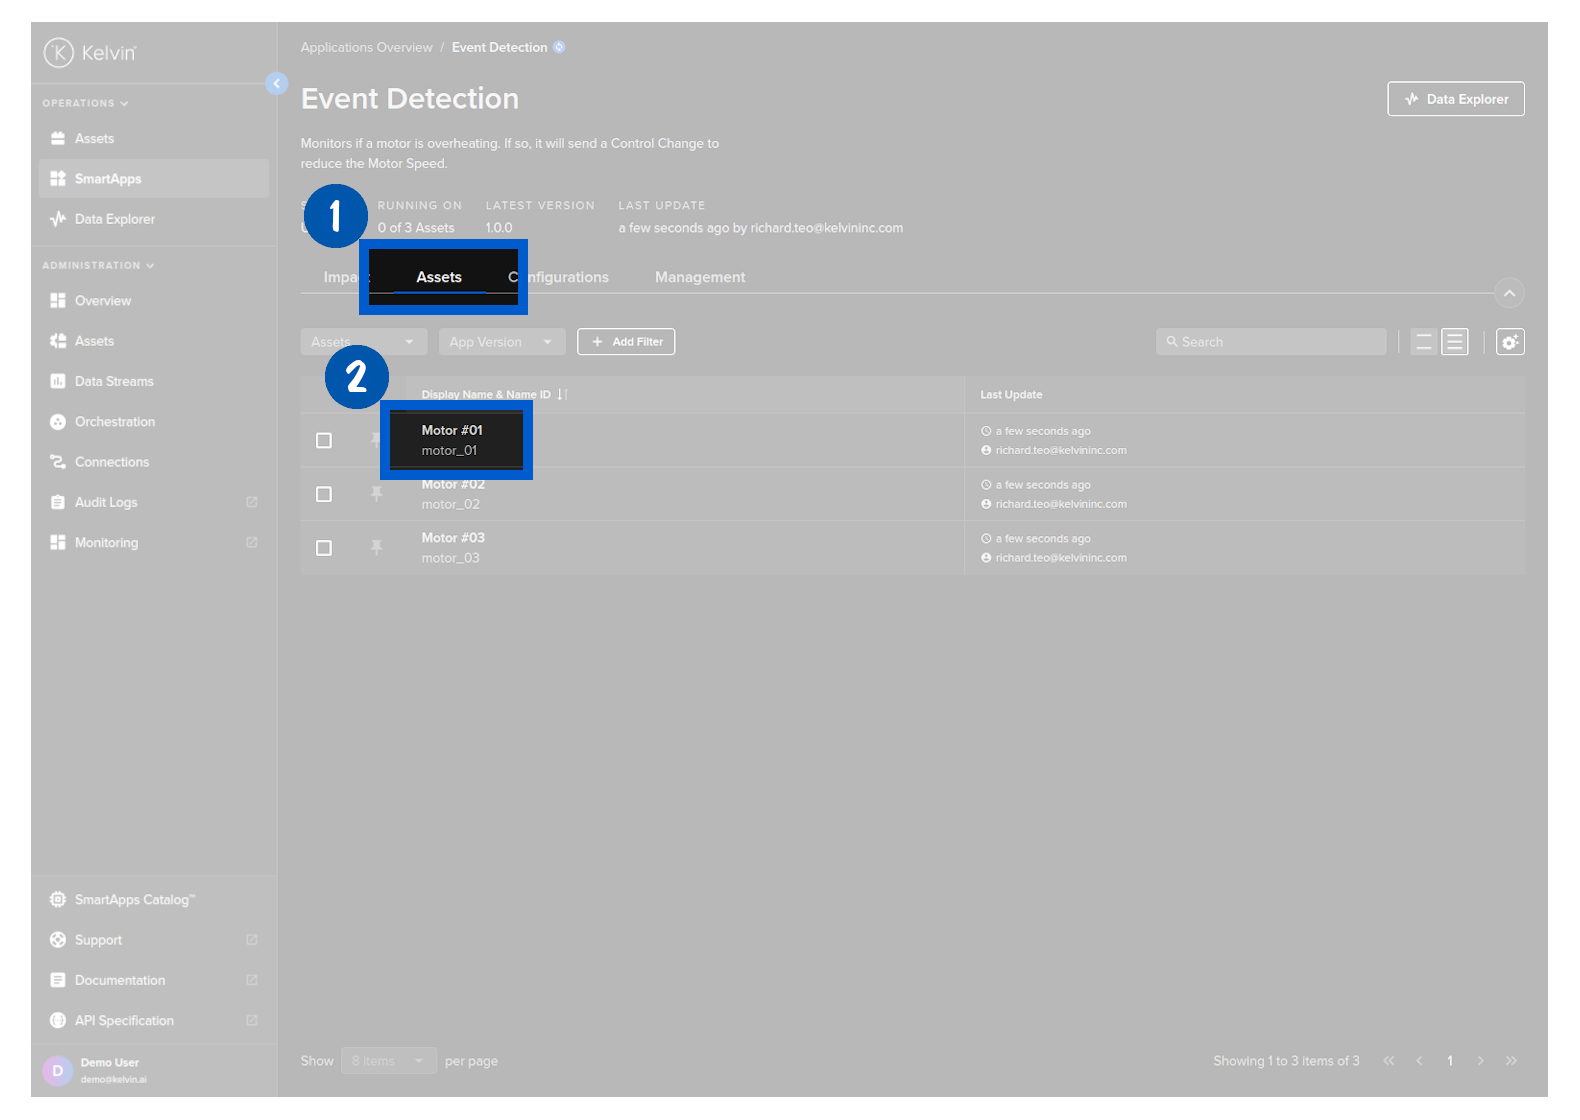
To do this, go to the Assets tab and click on the asset you want to visualize the data. This will open Data Explorer with the asset automatically selected.
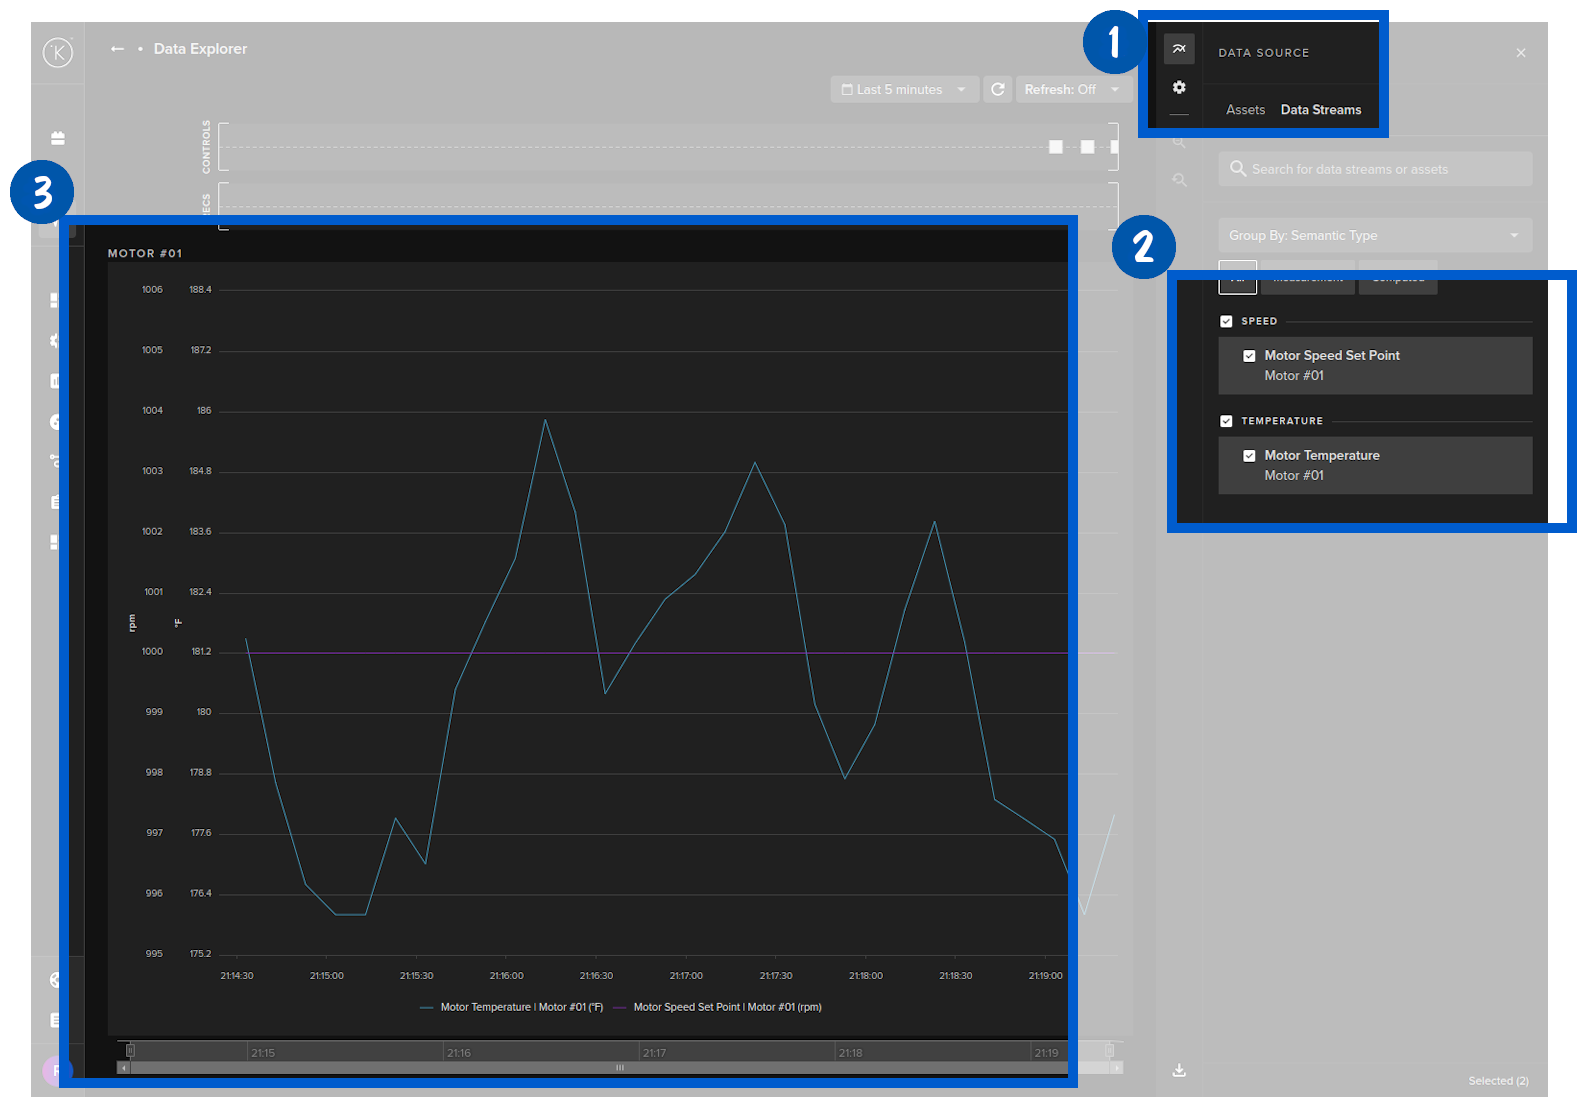
Select the data streams you want to visualize. In this case we will select the Motor Temperature and the Motor Speed Set Point data streams.
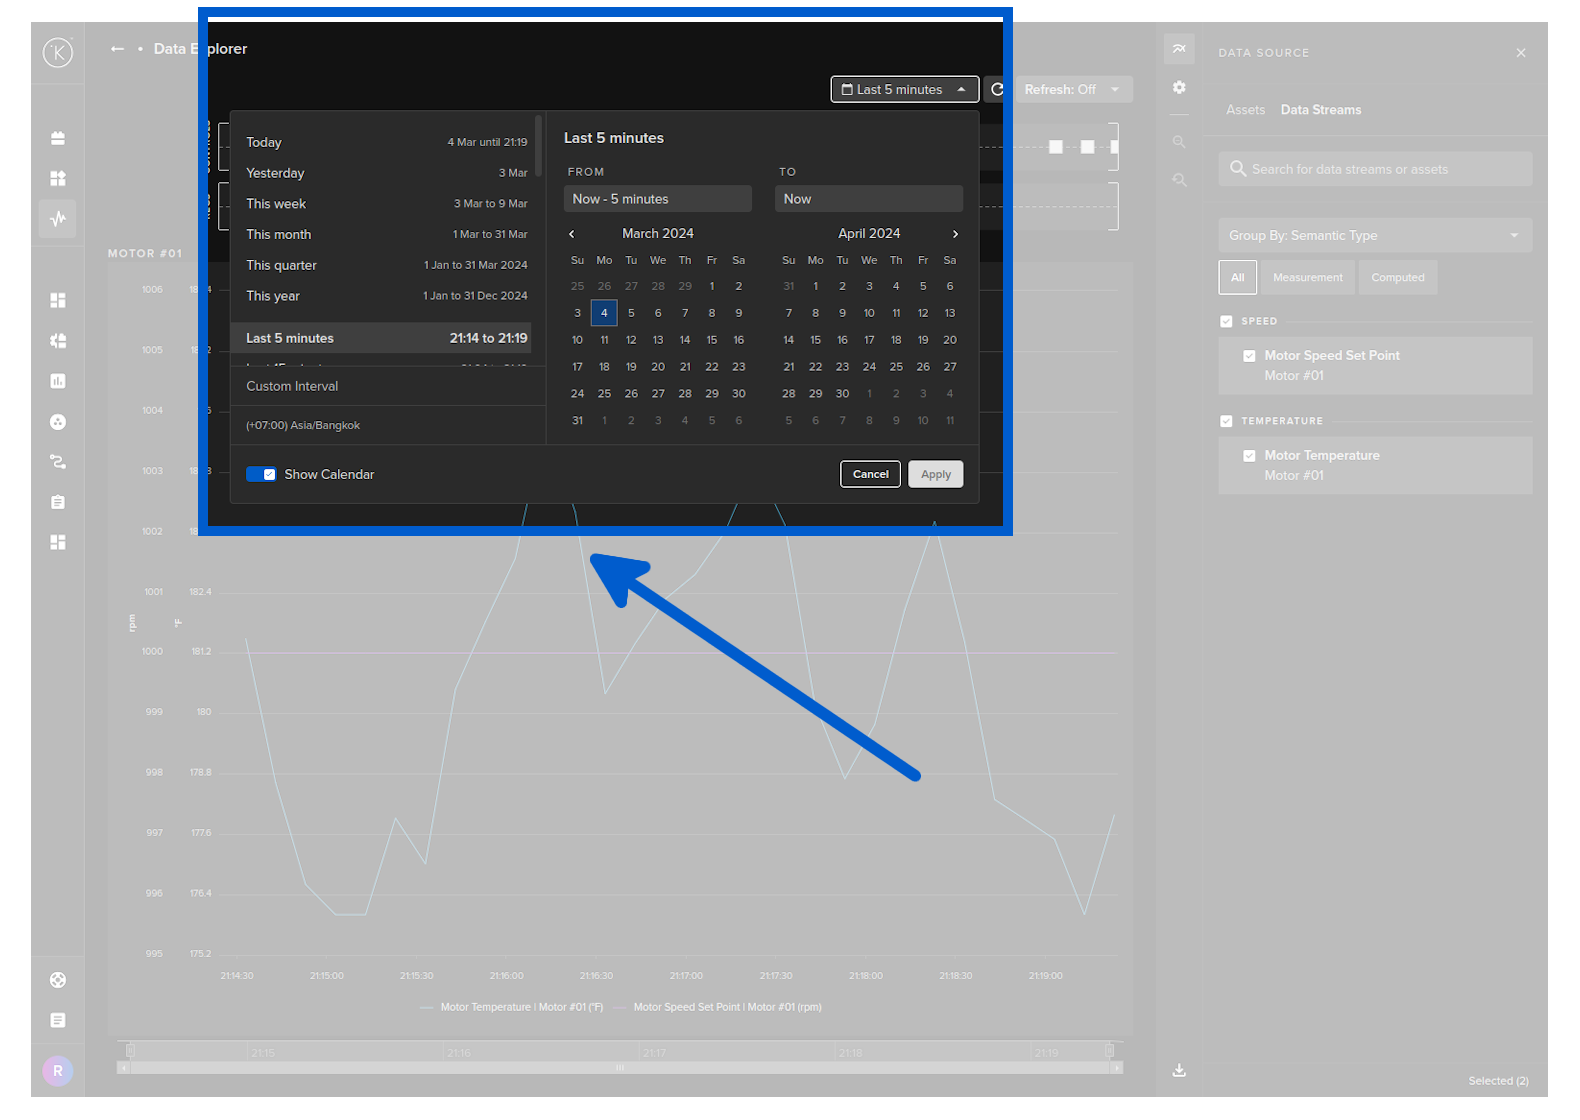
Select the time interval you want to visualize the data. In this case we will select the last 15 minutes.
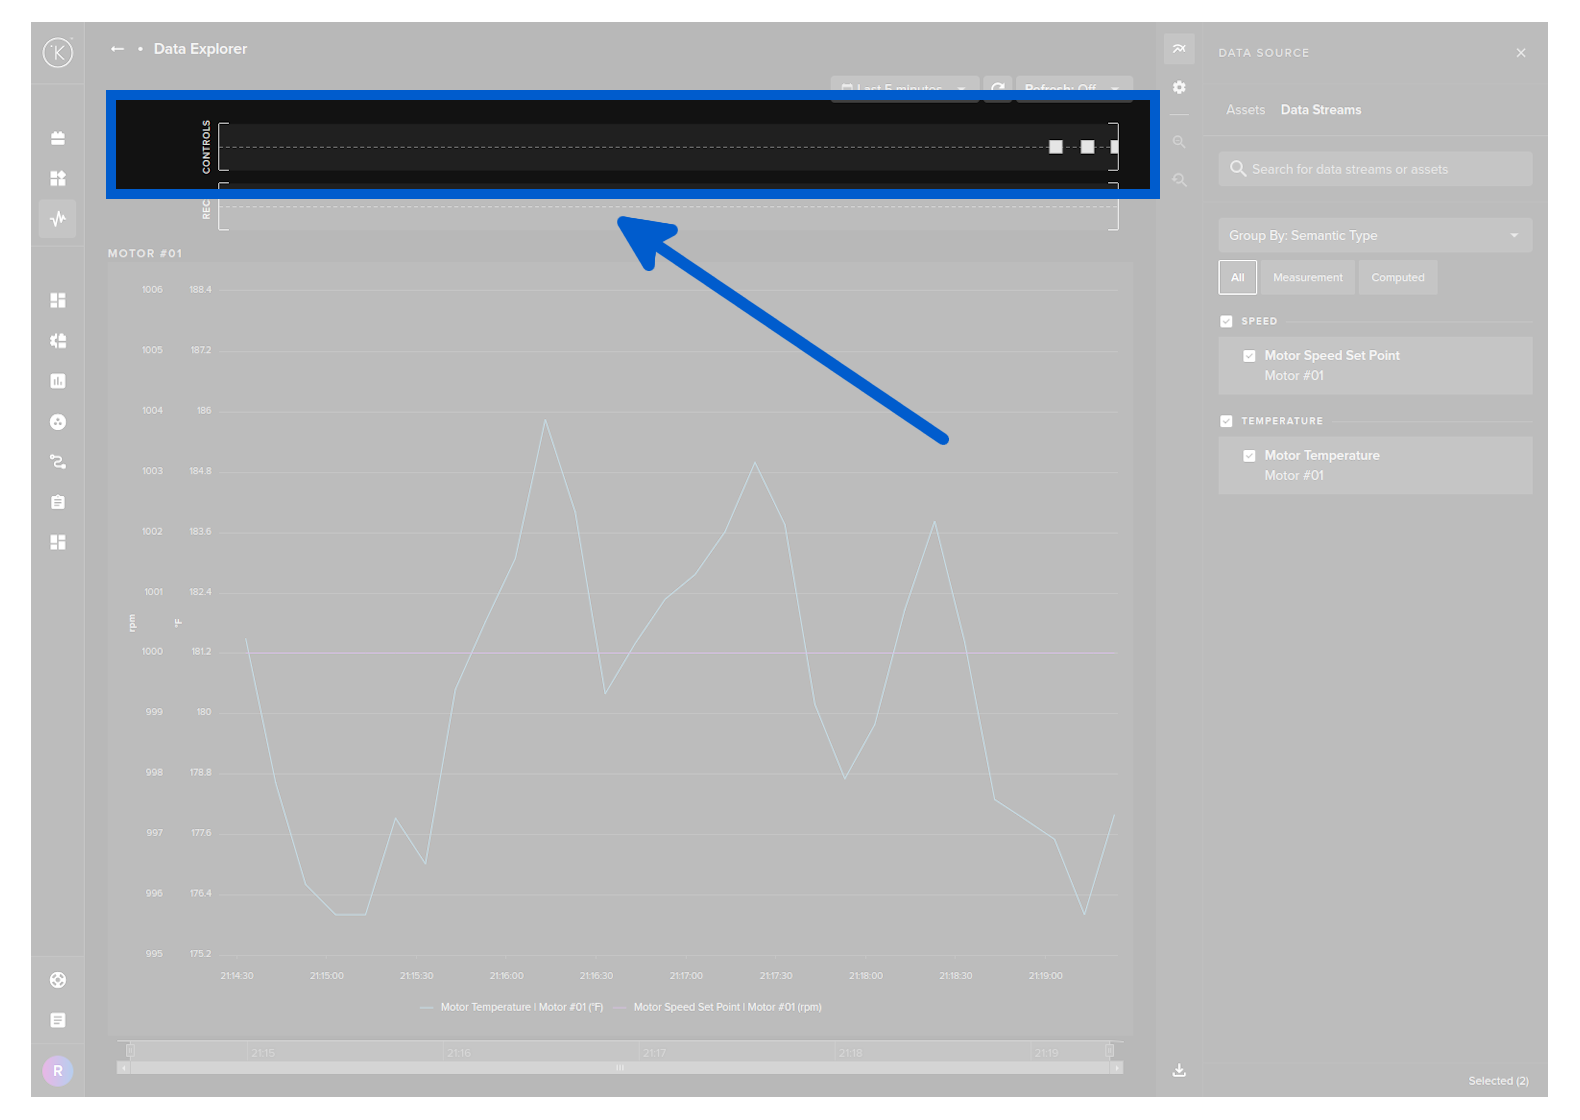
You can also see the control changes published by your Kelvin SmartApp™ in the swim lane above the chart.
Monitor Kelvin SmartApps™ Logs
Kelvin SmartApps™ logs are automatically uploaded to the Kelvin Instance.
Kelvin uses Grafana to visualize Kelvin SmartApps™ logs. This allows you to easily monitor Kelvin SmartApps™ and debug any issues. You can also define alerts in Grafana to automatically notify you when an issue occurs based on your log messages.
To visualize Kelvin SmartApps™ logs, click on the Workload Logs button:
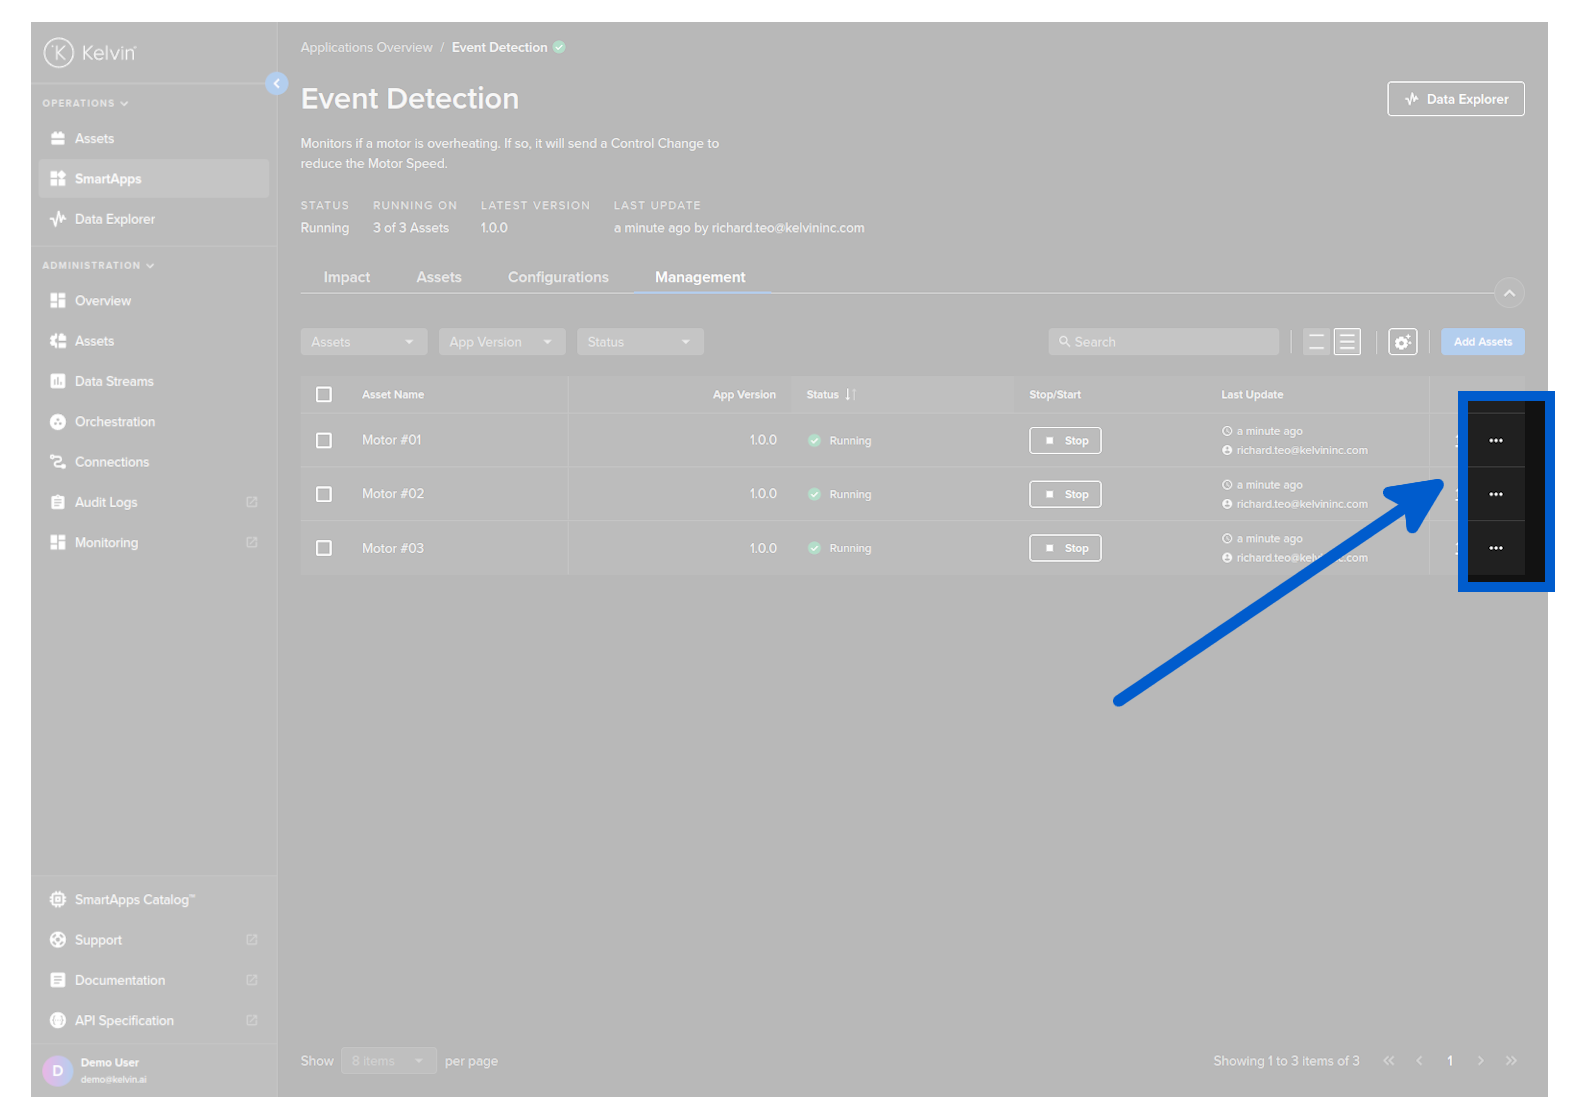
This will open the Workload Logs Grafana dashboard and automatically select the logs for your Kelvin SmartApp™:
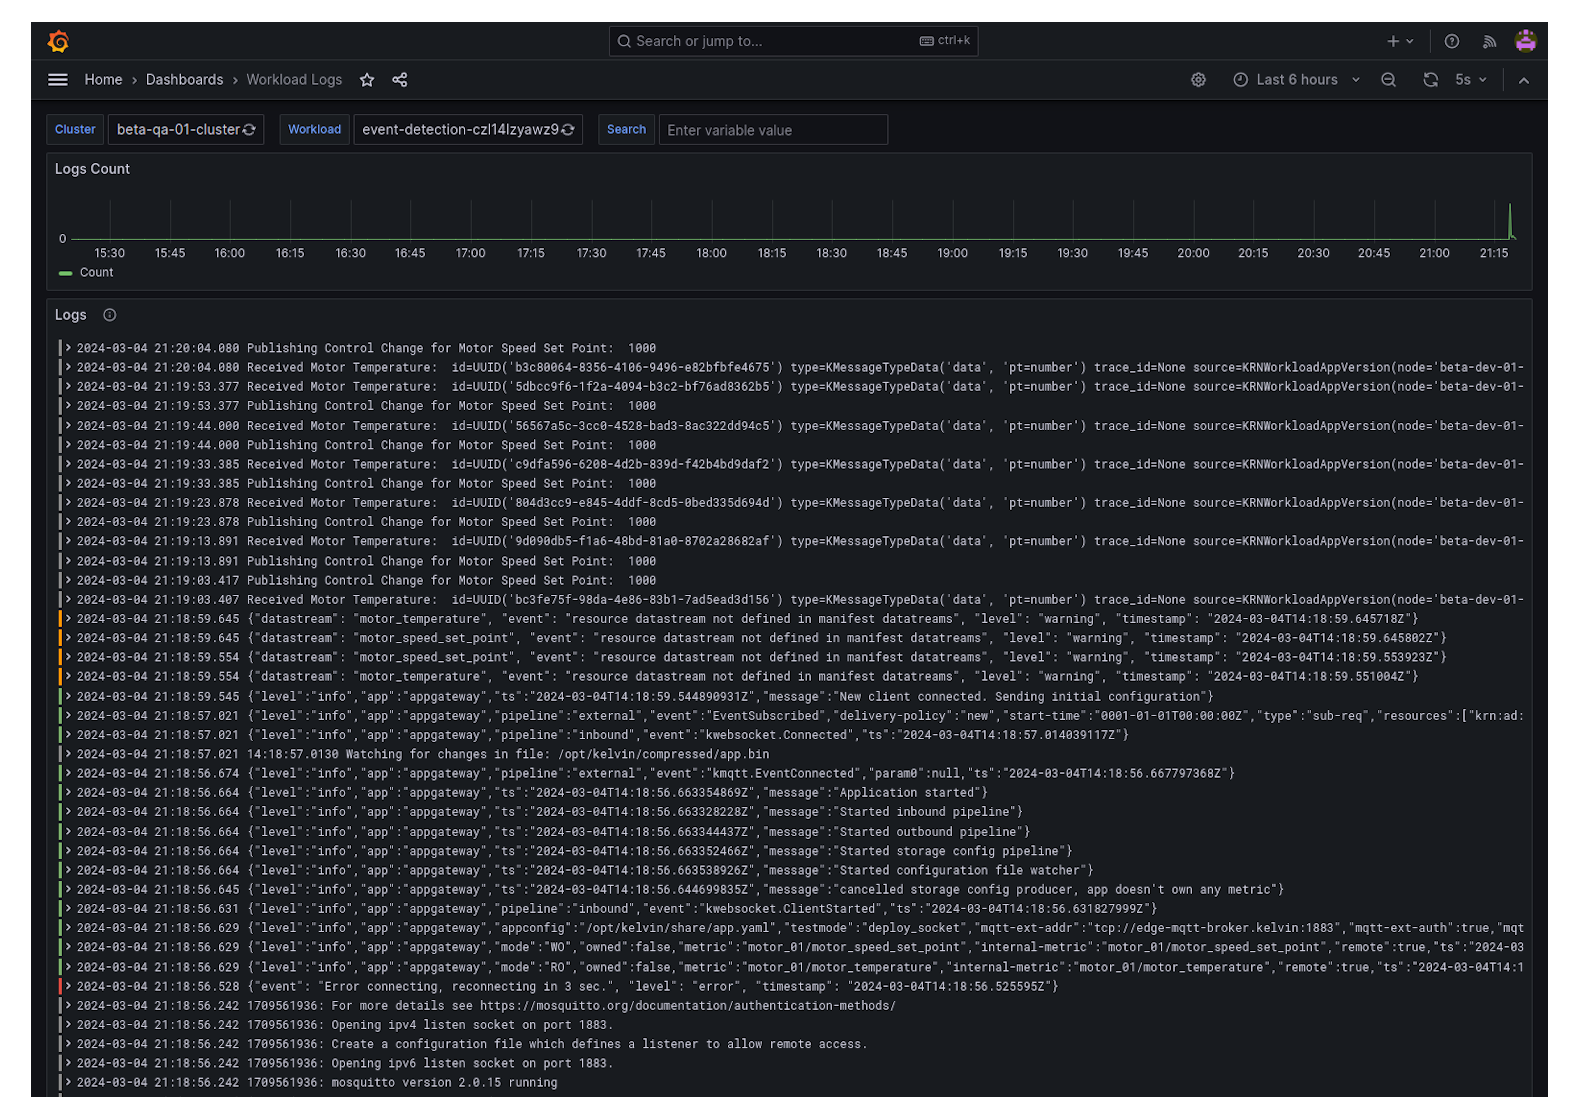
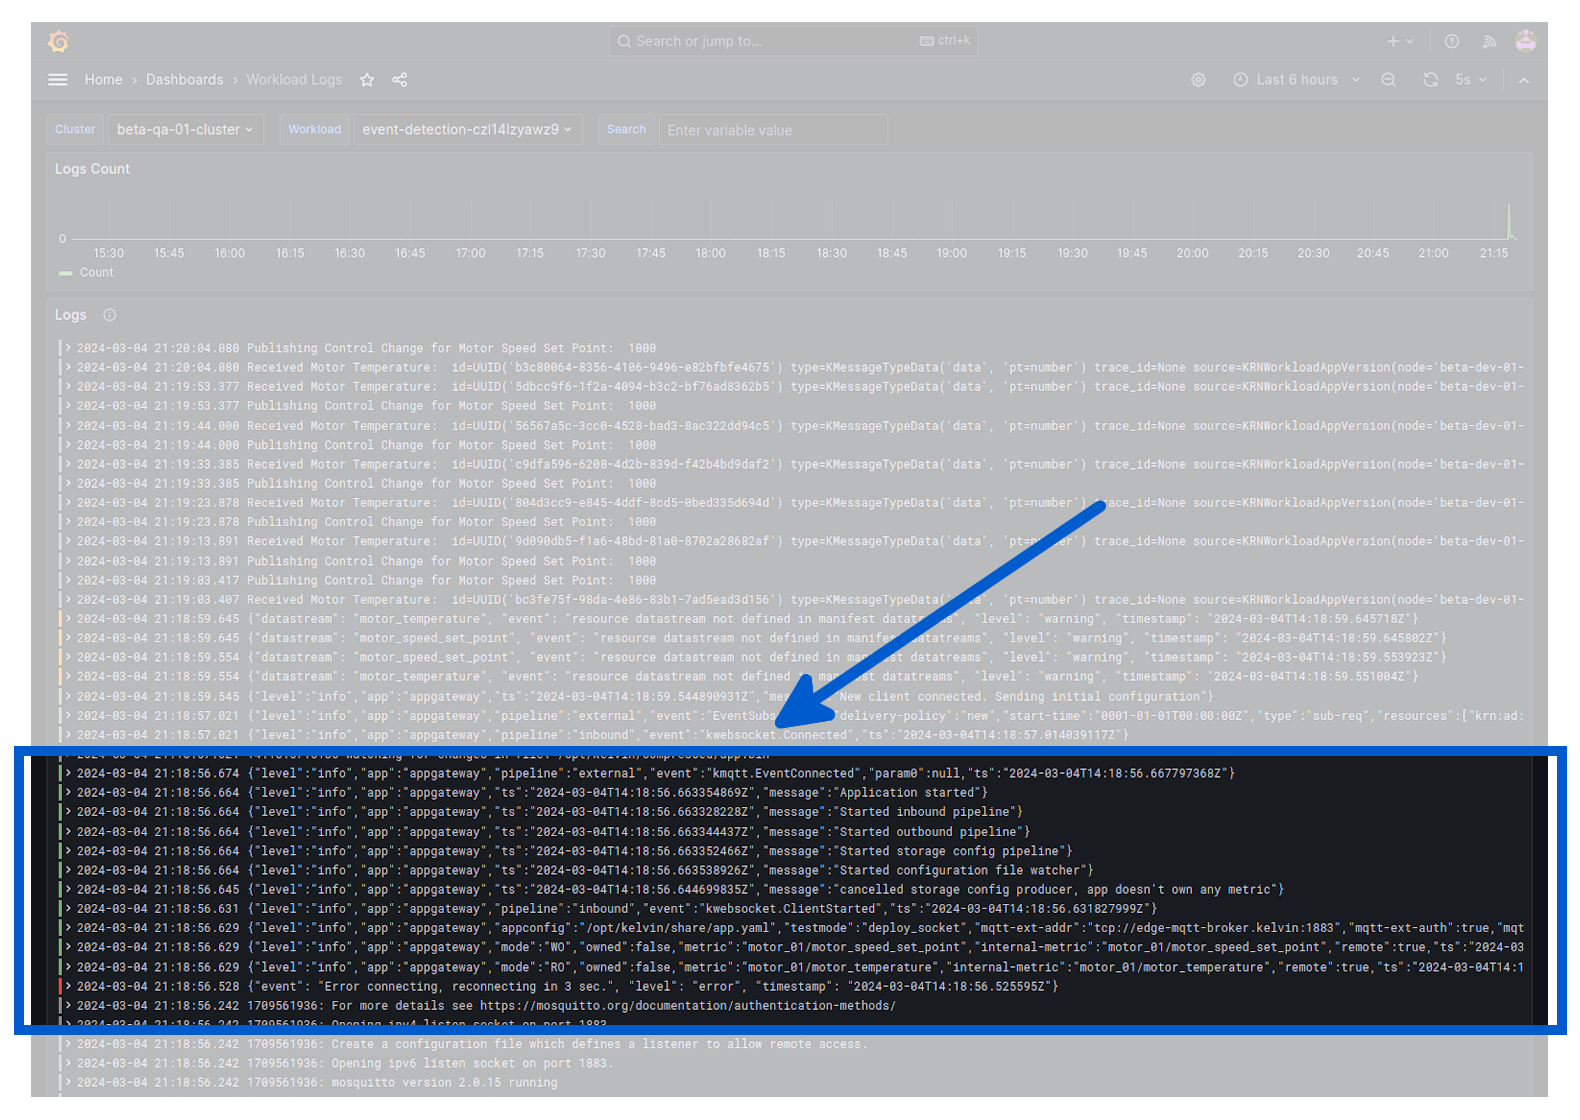
You can inspect the log messages and verify that Kelvin SmartApps™ is receiving the data from the asset:
Monitor Kelvin SmartApps™ Telemetry
Another aspect of monitoring your Kelvin SmartApp™ is to monitor telemetry data of your Kelvin SmartApp™.
Kelvin SmartApps™ automatically uploads information related with CPU, Memory and Network usage. These metrics can be used to assess the performance of your Kelvin SmartApp™ and to debug any issues.
To visualize Kelvin SmartApps™ telemetry, click on the Monitoring button:
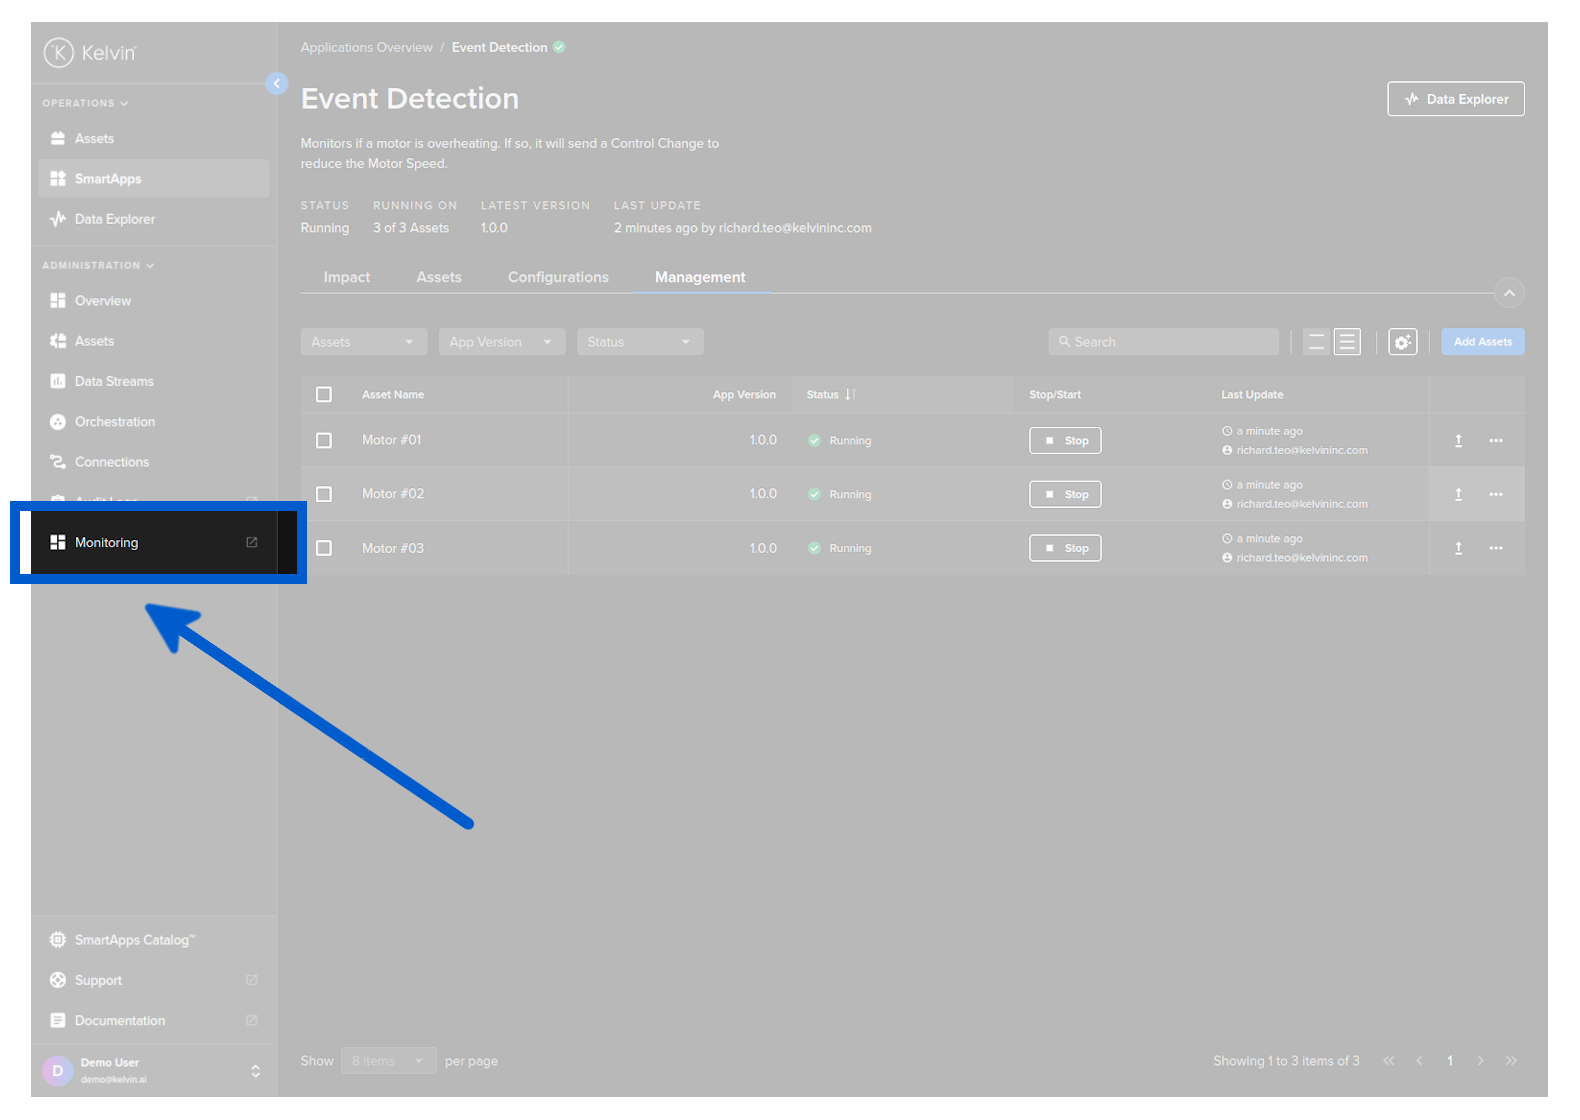
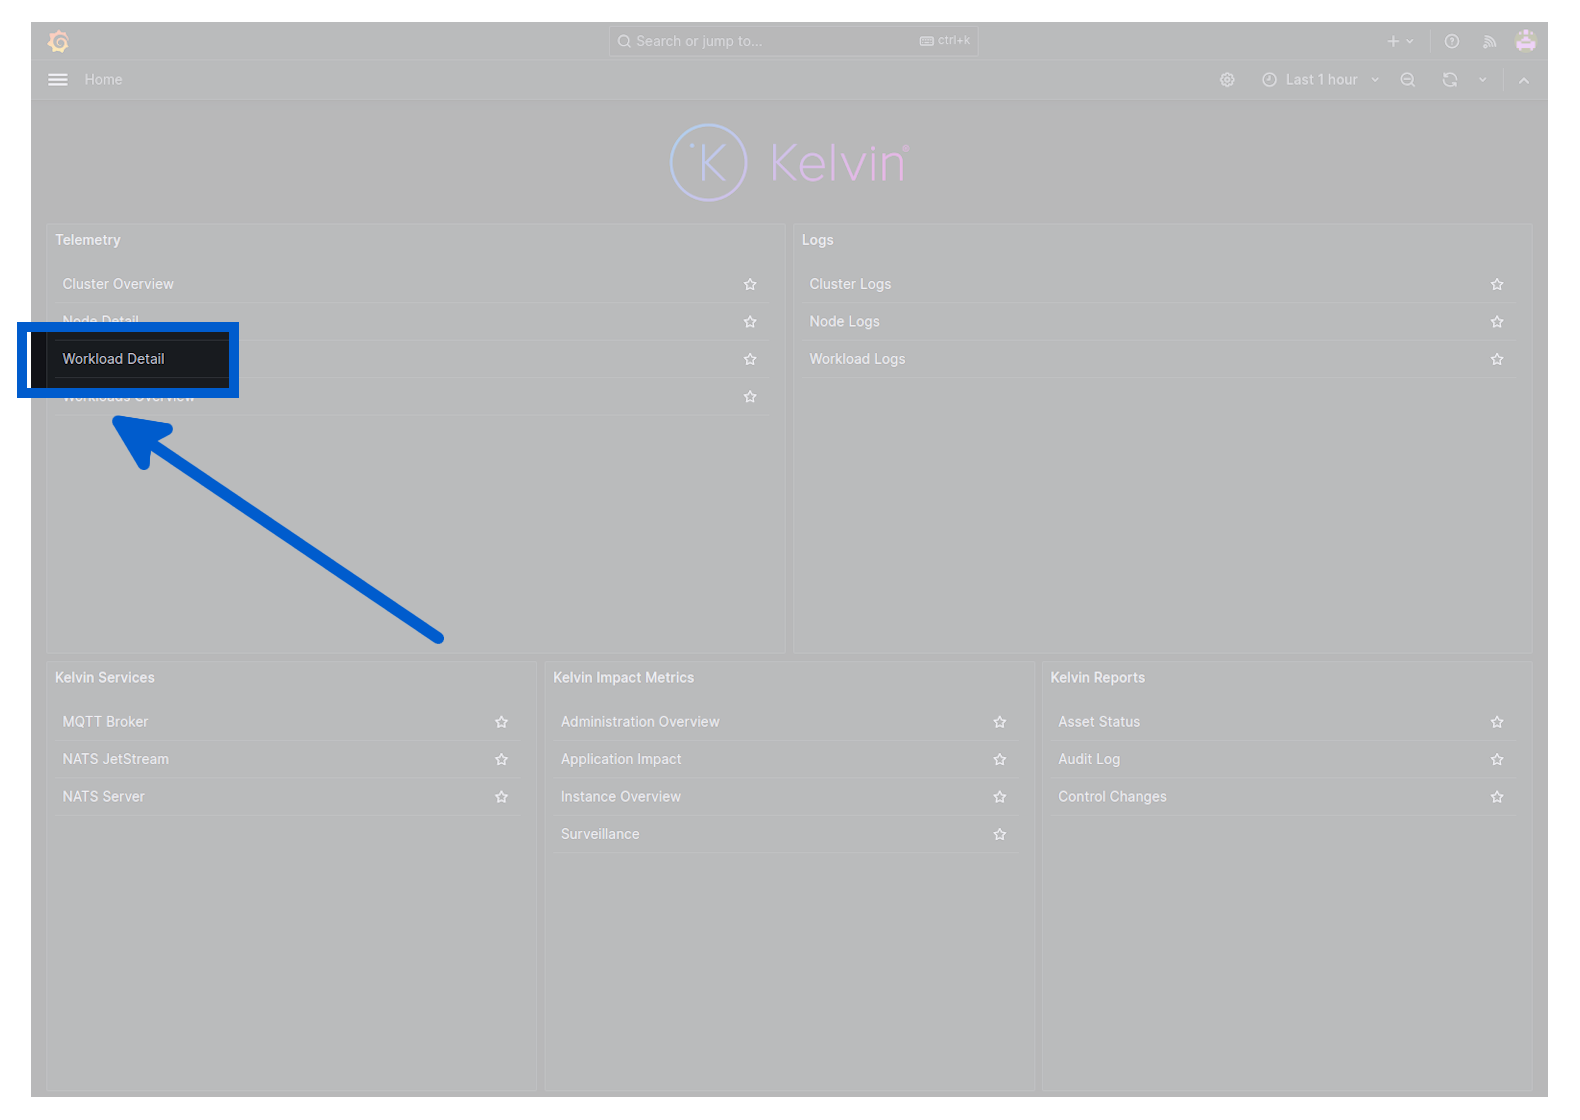
In Grafana, under the Telemetry section, select the Workload Detail dashboard:
And select the Cluster and the Workload you want to visualize the telemetry. In this case we will select the Event Detection Kelvin SmartApp™.
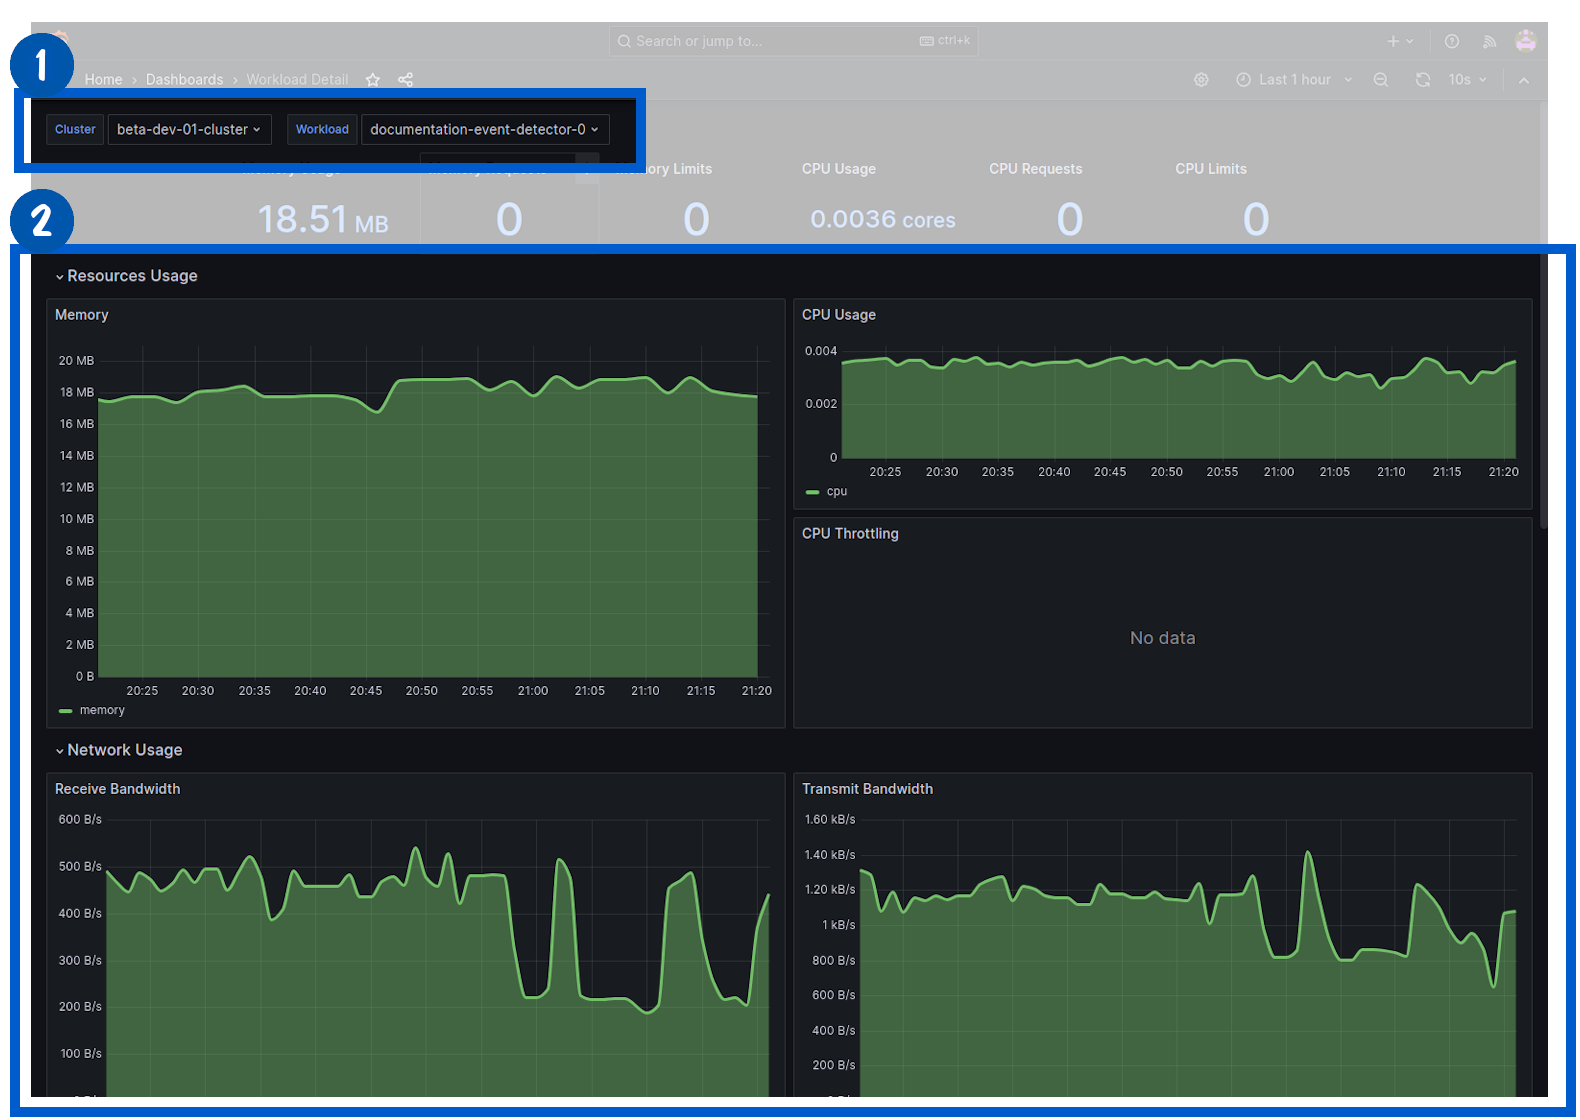
Congratulations! You've successfully monitored your Kelvin SmartApp™ by visualizing the data, logs and telemetry.
All done!
Congratulations! You've successfully created, uploaded and deployed your first Kelvin SmartApp™. You are now ready to start exploring other topics within Kelvin.